At the close of 2016, Washington, D.C. ended its year in crime. Homicides capped at 135, a 17 percent decrease from the previous year. 2015 was a markedly bad year for homicides in the District, with a homicide total of 162, the highest total homicides since 2008 and a significant increase after several years of record low homicides. However, long-term trends would indicate that 2015 was an anomaly after a 4-year span (2011 to 2014) of low occurrences of homicides. We could postulate 2016 is the beginning of the trend observed in 2011-2014.
It is also important to factor in population growth. A city’s population grows, in this case D.C., an increase in homicides may occur but the overall rate of homicides may decrease. To stabilize the data, I created the graph below, which shows the percentage of homicides per 10,000 residents from 2005 to 2016. This confirms that the percentage of homicides per 10,000 was stable from 2011 to 2014, with a spike in 2015, and a decline in 2016. Interestingly enough, 2016 showed a 17.7% decrease in homicides per 10,000, very similar to the percent decrease in overall homicide count.
Geographically, 43 areas of D.C. (broken down by census tract) saw decreases in homicides. The areas with the most significant decline include Congress Park, Bellevue, and Buzzard Point. On the other hand, an equal number of areas saw an increase in homicides. The neighborhoods with the most significant increases were Anacostia, Deanwood, and Brightwood Park.
In several neighborhoods, Georgetown and Glover Park for example, the percentage of homicides increased significantly. This is the result of 1 or 2 murders where previously none had occurred. So, while there was an equal number of areas in which the percentage of homicides increased and decreased, as a whole the number of homicides in D.C. was on the decline in 2016. Explore the map below to see what areas in D.C. had significant swings in Homicide.
Additional analysis of certain geographic areas yielded correlations with race, education, and poverty. My findings revealed that economically impoverished neighborhoods with lower levels of educational attainment and a higher percentage of African Americans saw higher rates of homicide. I will discuss this in further detail in the analysis portion of this post.
Analysis: Identifying where, when, and why homicides occurred
To discover where homicides occur most frequently in the District I began mapping individual homicides throughout the District. Next, I spatially joined homicides with census tracts to highlight neighborhoods that experienced higher frequencies of homicide. While I could have visualized this as a series of points, visualizing the data by census tract gives me the ability to run a regression analysis, identifying potential correlations with demographics of each tract.
Where did homicides occur?
In 2016, homicides occurred in 70 out of 179 census tracts. While homicides did occur in almost every Ward, a majority clustered within Wards 7 and 8, in neighborhoods such as Fort Dupont, Burrville, and Barry Farms.
The map below details the homicides that occurred on 2015. Overall, homicides clustered within Wards 7 and 8, similar to 2016. Neighborhoods that were hit hard by homicides in 2015 include Congress Heights, Congress Park, and Langston.
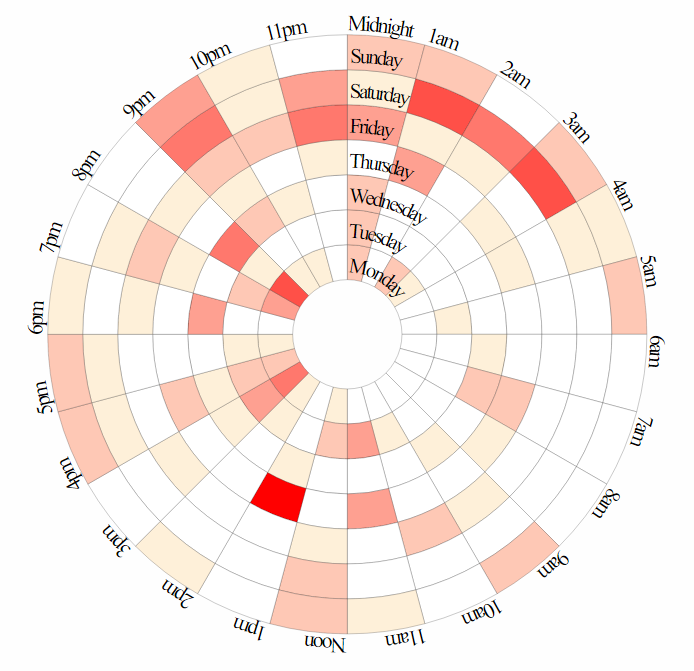
When did homicides occur?
I also broke down homicides temporally. I hypothesized that homicides occur less frequently during daylight hours. The 2016 data for homicides in the District backs up my hypothesis. The temporal heat map below illustrates how homicides in 2016 occurred most frequently between 10pm and 2pm, Friday through Sunday. This data makes sense when you consider that individuals frequent clubs and bars late at night on the weekends. An increase in alcohol consumption may also be a contributing factor.
In 2015, homicides did not cluster temporally in the same way as the homicides in 2016. There is a more even spread in occurrences between 4pm and 4am. Both 2015 and 2016 still show a slight increase in homicides during the late night weekend hours.
Why did homicide occur?
Demographics emerged as key factor in identifying where homicides occur. To determine how strongly demographics correlates to where homicide occurs in the District, I ran a regression analysis. The dependent variable was set as homicides per 10,000 people in each census tract. Starting with about 110 demographic attributes, I was able to identify the 7 variables that are the most influential when attempting to predict where homicides will occur.
The regression model identified these demographics to be the most important:
- Percentage of population that are in the age group 45-49 years old,
- Percentage of the population that are divorced,
- Percentage of the population that only retain a high school diploma,
- Percentage of the population that are below poverty level,
- Percentage of the population that are African American,
- Unemployment rate, and
- Median house value.
The R2 of the model was 0.51. Below is a scatterplot matrix visualizing the relationship of selected demographic attributes from my model, or in this case, the relationships to the homicides rate. Interact with the visual using the brush tool to highlight individual clusters in all off the graphs at once.
When looking at the regression analysis scatterplot, which plots the estimated homicide rate of the model vs. the actual homicide rate, I noticed a few outliers in the group. These outliers had extreme standard residuals, meaning they either had a far higher homicide rate than they should or a far lower rate. These outliers are highlighted in blue on the plot below.
The neighborhood cluster of Deanwood, Burrville, and Lincoln Heights had a census tract that saw a homicide rate (17.3 percent) almost double what was estimated (8.9 percent). The estimation of homicide rates was high to begin with, but the tract was an extreme over performer based on the demographics at hand. On the opposite end of the spectrum, a census tract that included Capital View, Marshal Height, and Benning Heights clusters had a much lower homicide rate (3.5 percent) than was estimated (9.5 percent). With characteristics such as high unemployment rate (26 percent) and a high percentage of the population below the poverty level (37.8 percent), it’s no wonder why the model would estimate a high homicide rate.
Conclusion: Socioeconomic and demographic factors are related to where homicides occur, but other factors remain to be explored
The demographic and socioeconomic factors I used in my model account for about half (51 percent) of the geographic variability of homicides in D.C. in 2016. The remaining 49 percent leaves me questioning what other factors are influencing homicides in D.C. Potential explanations lie in the allocation of police resources, gang-related activity, or a host of other factors that are more difficult to quantify, both in terms of the availability of data and methodology of collecting such data.
About the data
Data for the demographic models I used were obtained from the U.S. Census Bureau’s American Community Survey, 2015. Criminal data sets were obtained from DC Open Data, 2016. Visit my GitHub page for code used in each visual.