
Recent reports increasingly point to a slowdown in the Washington regional economy, slower hiring in the District, and stronger private sector employment in the city. A deeper dive into jurisdictional differences across the metropolitan Washington area show that the District’s role in the region as an employment center is indeed growing.
When tracking employment in the District and the metropolitan area, we usually keep our eyes on the monthly employment data released by the Bureau of Labor Statistics on every third Friday of the month.[1] These data, also called the Current Employment Statistics (CES), are comprehensive and timely. But because they are released at the state and metropolitan region levels, CES do not allow us track employment patterns across the administrative units that make up the Washington metro region.
To explore within-metro area employment trends, we must turn to the Quarterly Census of Employment and Wages (QCEW), which are based on administrative records related to the unemployment insurance taxes. These data are released quarterly, with over half a year of delay. They also cover a smaller set of employees: self-employed persons, as well as workers on small farms, and student workers hired by universities, among others, are excluded.[2] While not trivial, these differences are not large enough to distort the underlying employment trends in the region, and thus, makes the QCEW data a useful source for analyzing intra-regional employment and pay trends.
QCEW data reveal important regional trends in hiring. First, across the entire region, the federal government’s role as an employer is declining, but strong growth in private sector employment is making up for the losses. Second, the District’s regional share in private sector employment is increasing, as the city is outperforming its immediate neighbors: Arlington, Alexandria, Fairfax County, Montgomery County, and Prince George’s County. However, the exurbs of Virginia—especially Loudoun and Prince William counties—are outperforming even the District in private sector employment growth. Finally, District wages are increasingly becoming higher compared to other jurisdictions in the metropolitan area. In terms of labor costs, the District is now the most expensive place for businesses in almost every industry.
Federal workforce in the Washington metro area shrank, but growth in private sector employment made up the losses.
Between 2010 and 2018, employment in the greater Washington metropolitan area[3] grew by nearly 10 percent, increasing from 2,870,000 to 3,146,000. During this period, the federal workforce in the region declined by 17,680 (5 percent), but the private sector growth made up for this loss: private sector employment in the same period grew by 12 percent, and now accounts for 78 percent of total employment in the metro region.
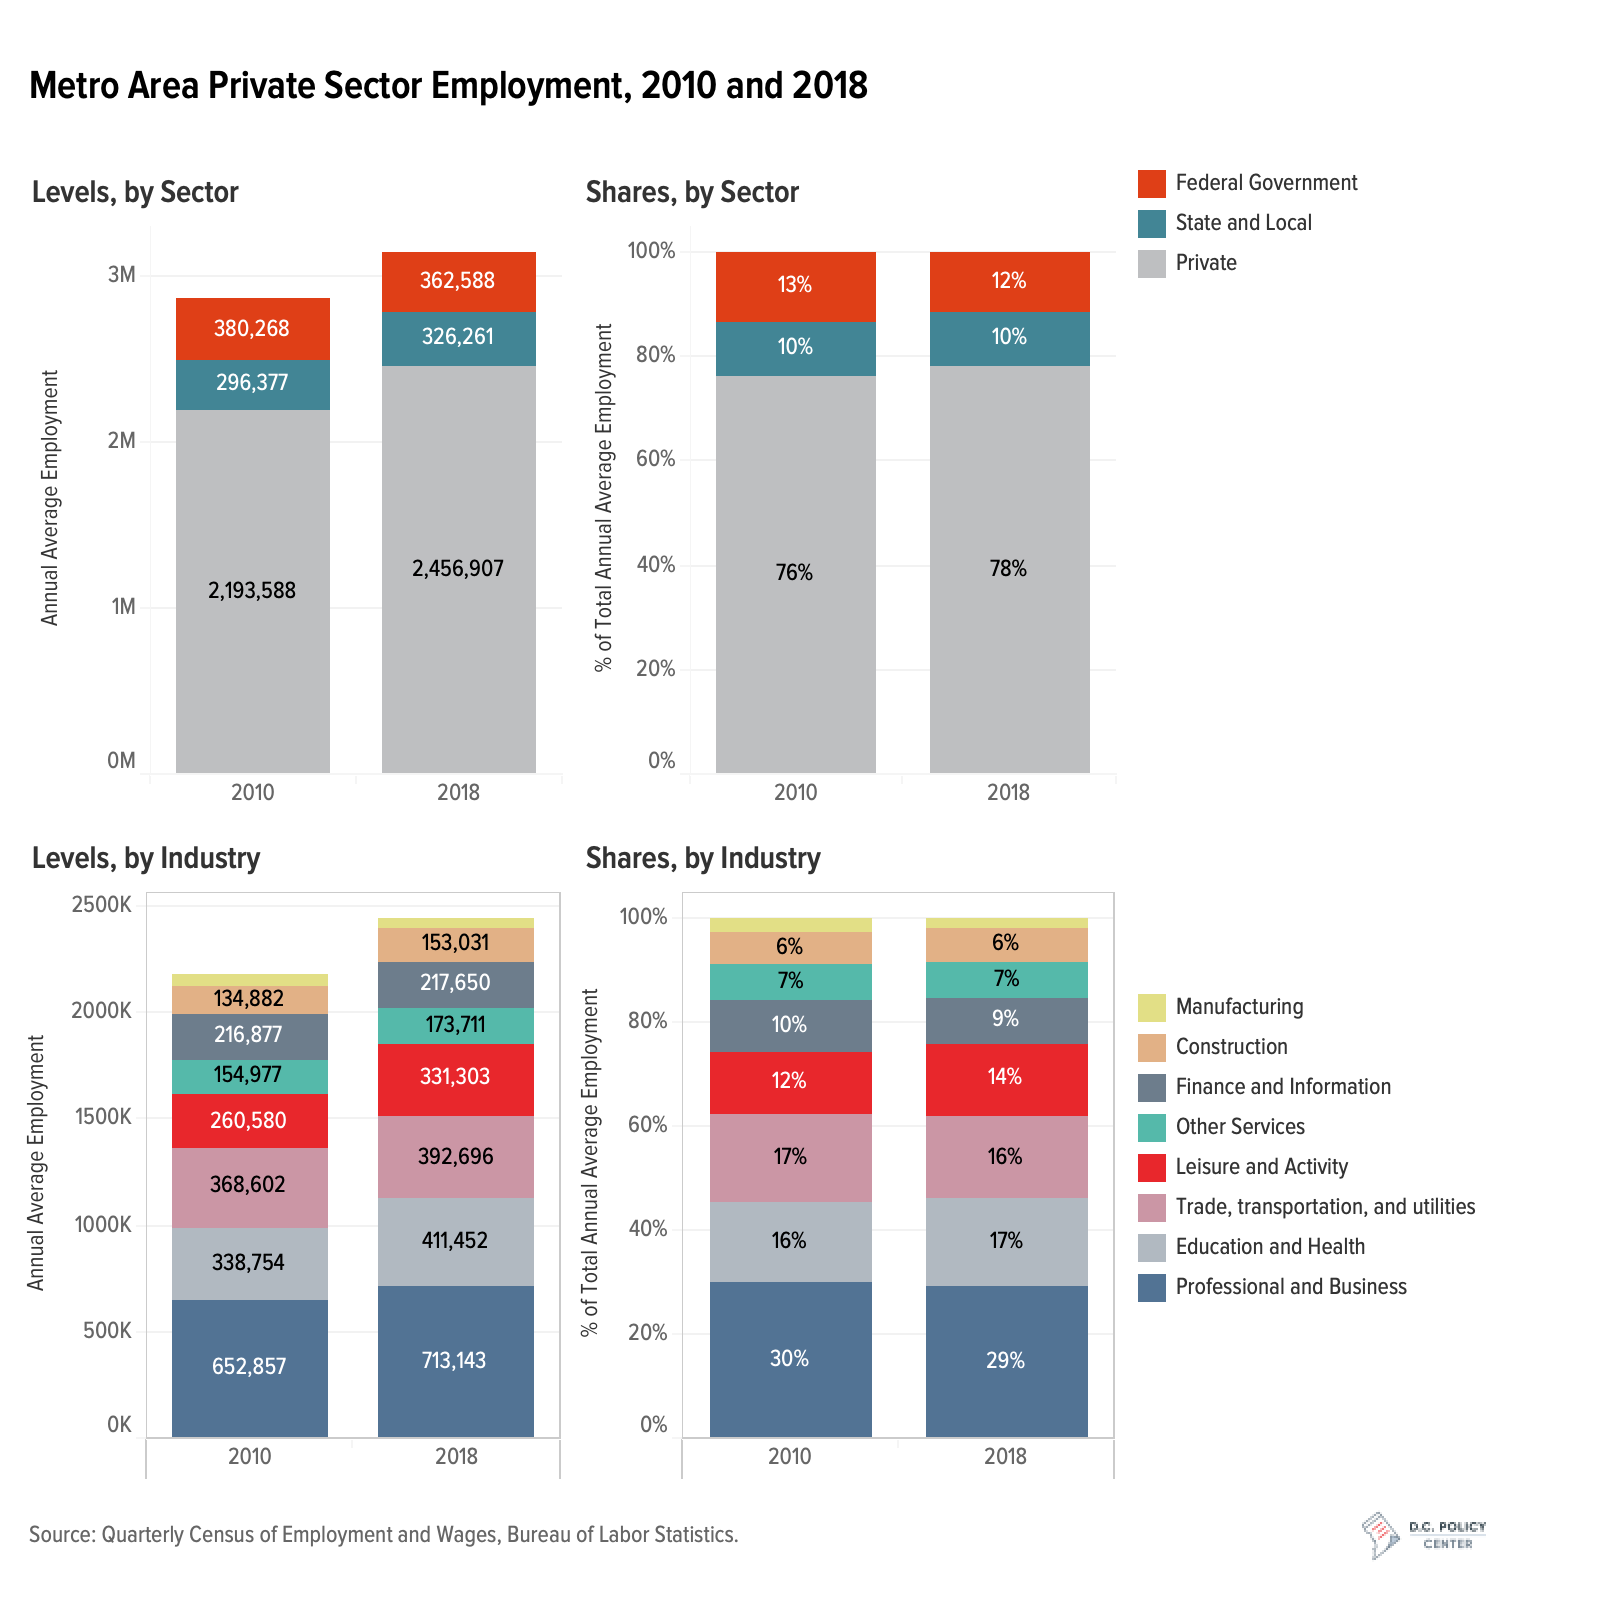
While private sector is growing, there are no significant changes in what the region does best. What has been lost by the shrinking of the federal workforce is being made up by the region’s key industries: professional and business services, education, health, and leisure. The employment profile by industry has showed little change between 2010 and 2018, as shown in the chart above. Leisure and activity sector (including hotels, restaurants, and entertainment venues) as well as education and health services slightly expanded their shares in employment. Professional and business services—the key industry of the region—grew almost at par with overall employment. These industries collectively account for 60 percent of all employment in the metro region (up by 1 percent since 2010). All other industries grew within regional norms.
The District is now the largest private employment center in the metropolitan region
The District has always been the center of employment in the region, but this was largely due to the presence of a large federal workforce. For the first time in 2016, the District also became the top private sector employment center, with employment exceeding that of the previous leader: Fairfax County.
By 2018, private sector employment in D.C. stood at 534,225, growing by 86,287 since 2010 (or at 19.3 percent, which is almost twice the rate of growth in the metropolitan Washington region). Other strong performers in private sector employment are Arlington, which grew by nearly 17 percent, and exurbia in general, which grew by 15 percent. Among then core counties of the metro region, Alexandria shrank by 4 percent, and Maryland suburbs—especially Montgomery County—showed the weakest growth (below 7 percent).
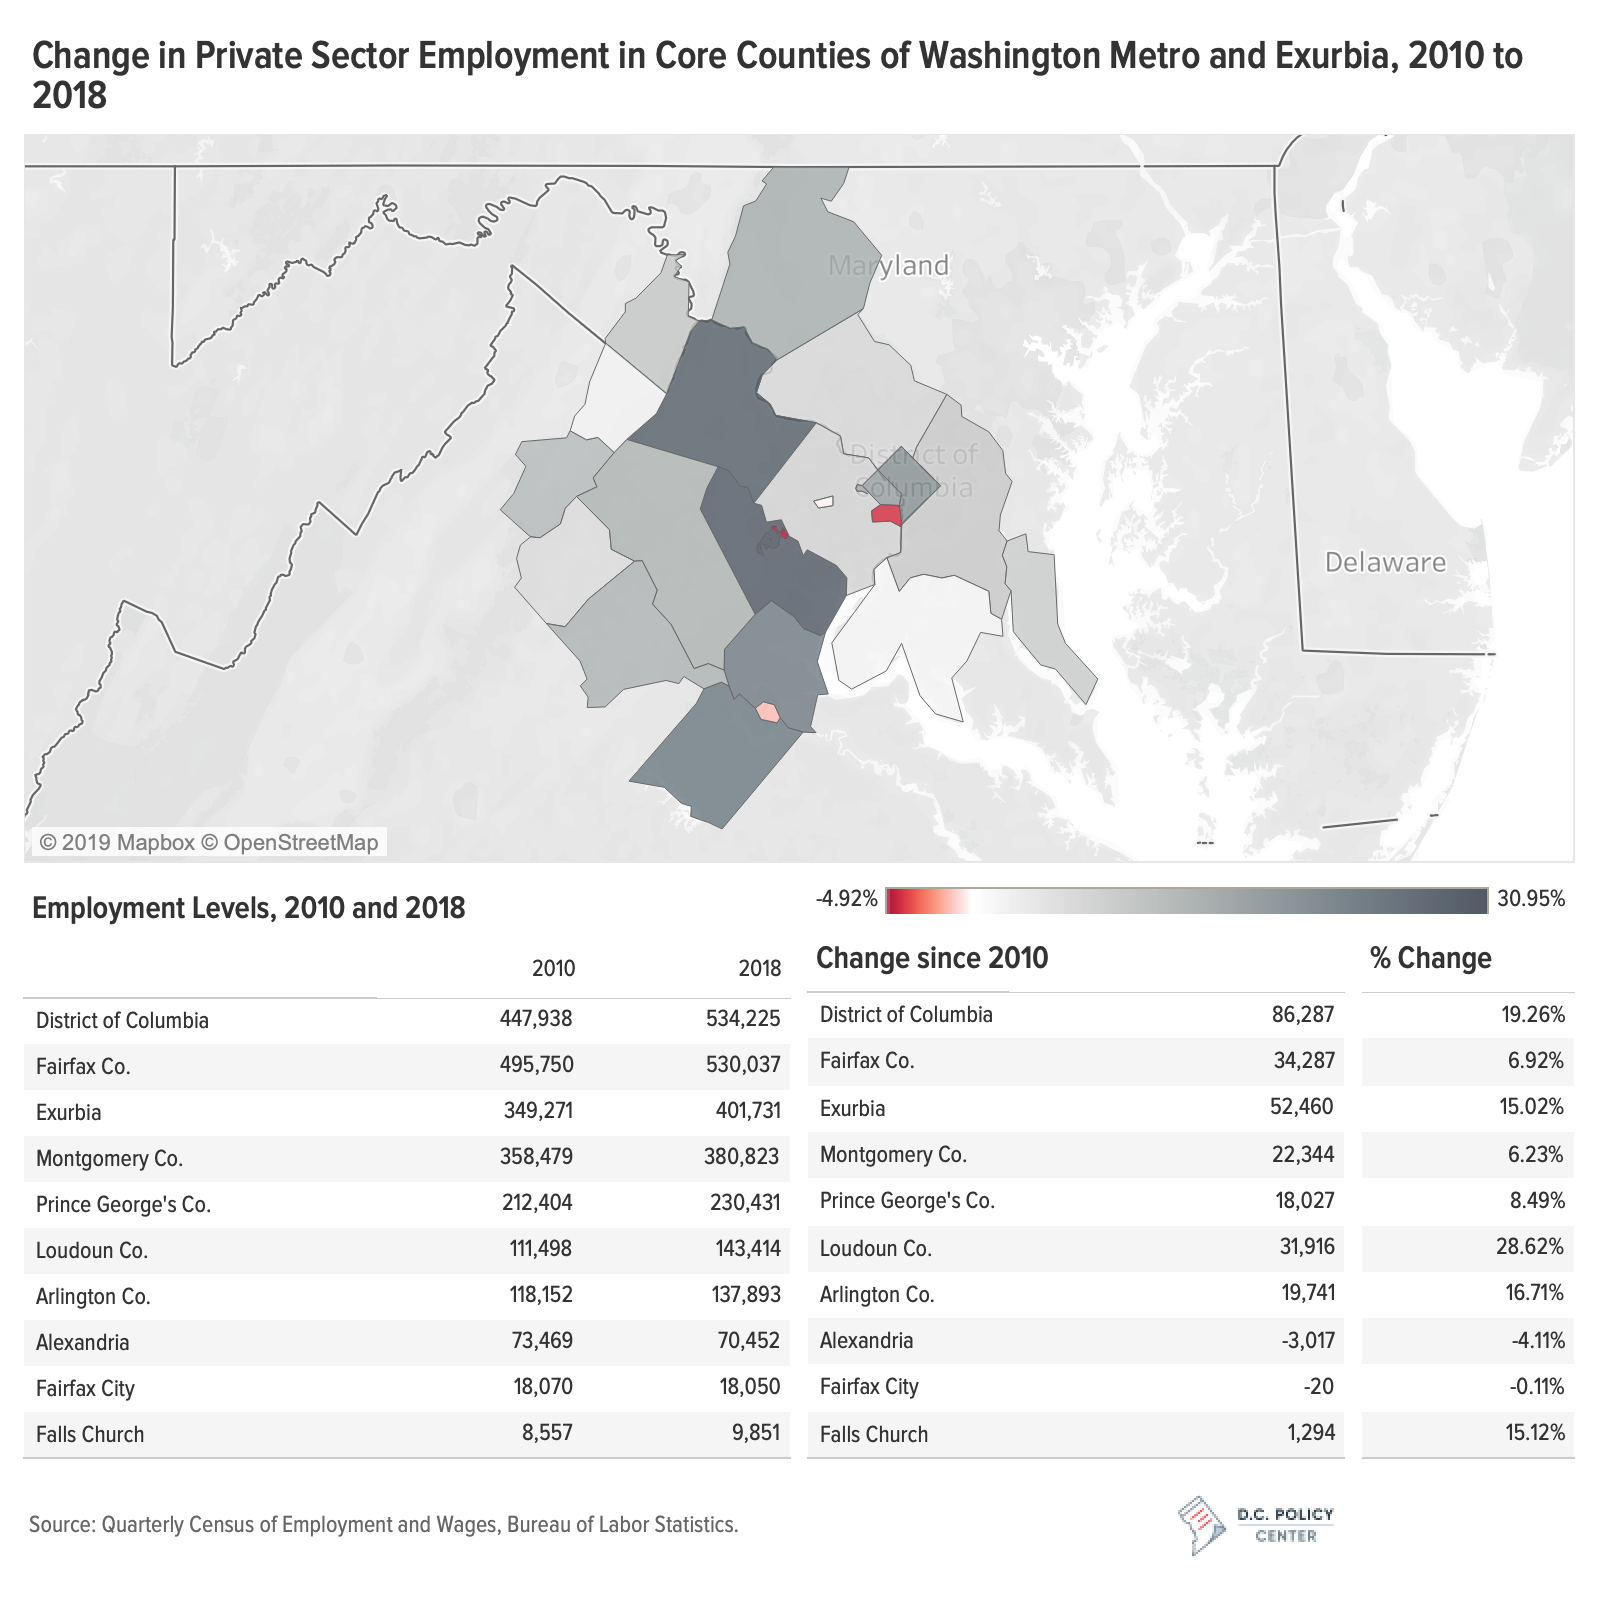
The strongest performer in the region when it comes to employment growth has been Loudoun County. Loudoun began the 2010s with fewer employees than Arlington, and ended with more, showing a growth of 28.6 percent.
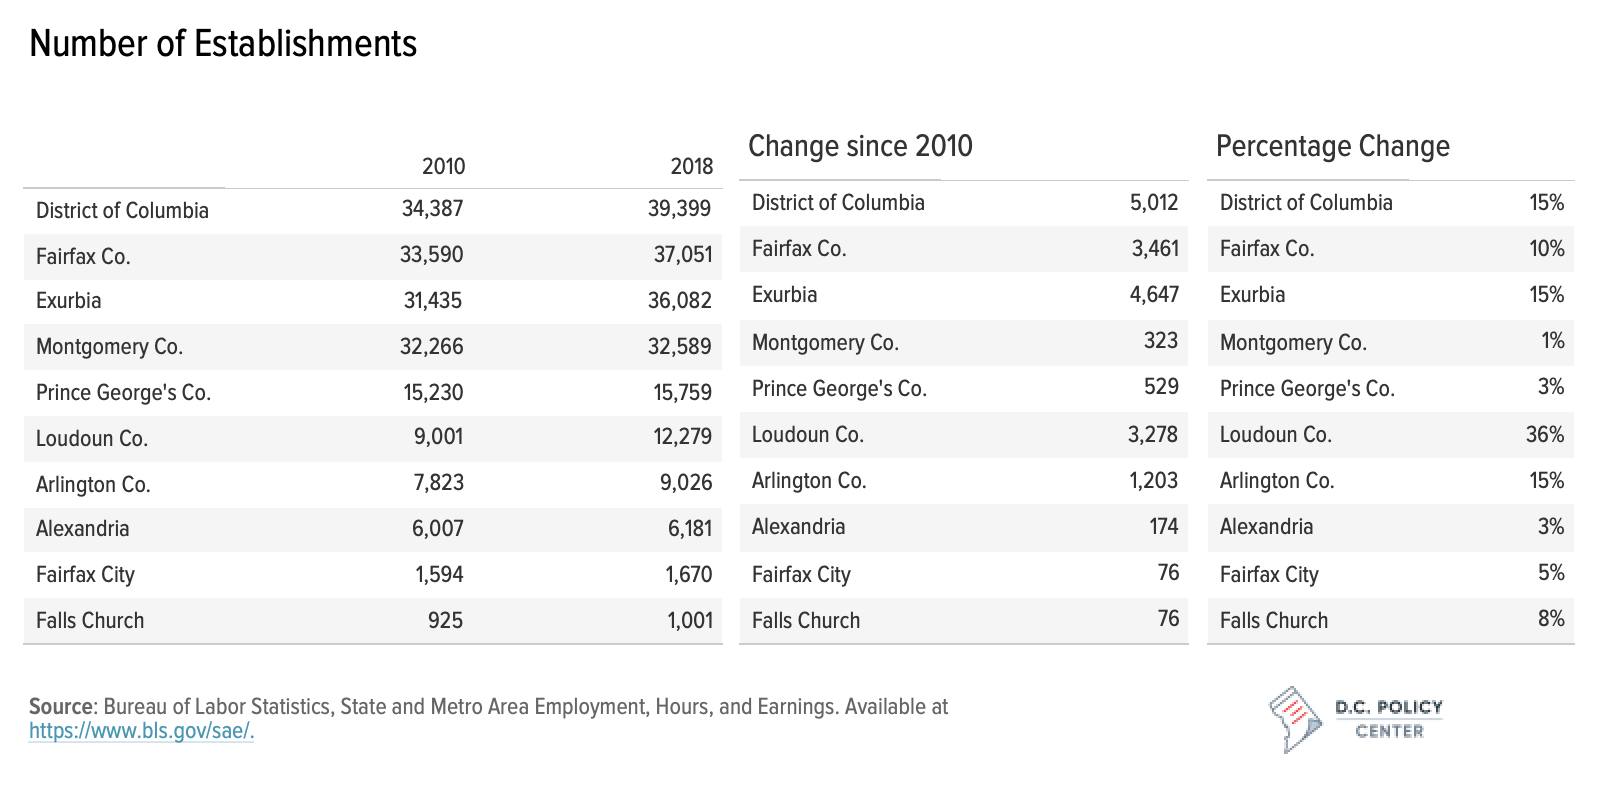
Much of that growth came from hiring done by new establishments: between 2010 and 2018, Loudoun added nearly 3,300 new establishments—nearly on par with Fairfax County. Given its low starting point, this meant a growth over 36 percent, or more than twice the rate of the second-best performers in terms of establishment growth: D.C. and Arlington. That is, Loudoun County became a destination for new firms as well as establishments that chose to relocate from other parts of the metro region.
In contrast, Montgomery County added 323 new establishments during the same nine-year period (1 percent growth), and Prince George’s added 529 (3.5 percent growth).
The District is outperforming its immediate neighbors in private sector employment growth, but exurbia’s role in region’s employment is increasing.
Looking at the counties and cities in the metro region with more than 20,000 employees, we see that the District’s employment growth was stronger against its neighbors in Maryland (Montgomery and Prince George’s counties) and Virginia (Arlington and Fairfax counties, and the City of Alexandria). In 2010, Arlington, Fairfax, and Alexandria, when combined, had 53 percent more private sector employment than in D.C.; in 2018, this lead had narrowed to 38 percent. The combined lead of Montgomery and Prince George’s counties in Maryland declined from 27 percent to 14 percent.
In 2010, Fairfax County had an 11-percentage point lead in private sector employment against the District; in 2018, the District was ahead by one percentage point. In 2010, Montgomery County employed 8 workers for every 10 employed by D.C.’s private sector (20 percent higher employment in D.C.); in 2018, this ratio was 7 to 10 (29 percent lead by D.C.). Compared to its neighboring jurisdictions, the District increased its lead in almost every sector between 2010 and 2018. The only exception is Arlington, which grew faster than the District in its private sector employment in professional and management services (closing the employment gap by 3 percentage points) and finance and information (closing the gap by 1 percentage point).
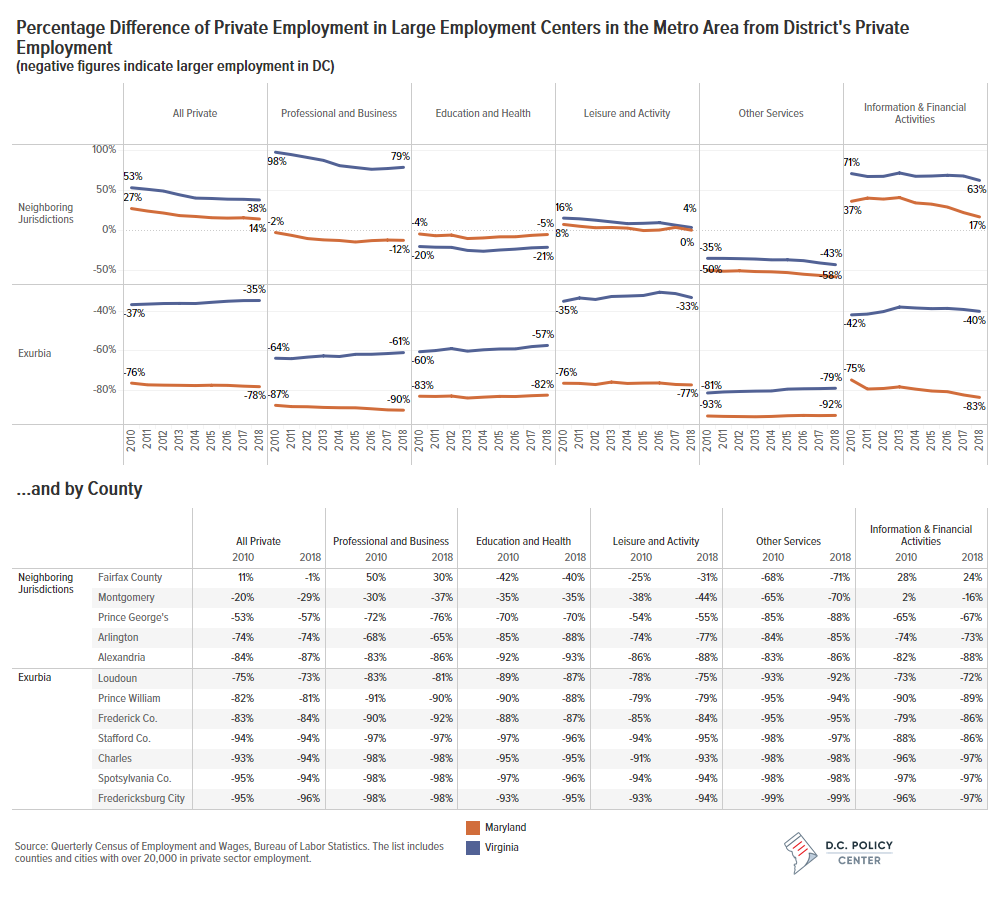
Out in exurbia, Loudoun and Prince William counties grew faster than the District in all major industries. The District’s private sector employment was 75 percent greater than Loudoun County in 2010; this gap declined by 2 percentage points by 2018. Prince William’s relative share increased by one percentage point. The District’s lead over Loudoun declined by two percentage points in professional services and education and health services, by three percentage points in leisure and activities, and by one percentage point in other services (a consequence of rapid population growth in Loudoun).
The District’s wages are increasing faster than the rest of the region.
Pay in the District has always been higher than elsewhere in the metro area—perhaps because of the direct competition with federal jobs, or perhaps because the business establishments attract workers with stronger qualifications, or because workers demand a premium for commuting from places outside the city. This wage gap increased between 2010 and 2018, even when compared to nearby jurisdictions which draw their employment from a very similar labor force.[4] In 2010, jobs in the District had a 14 percent premium over jobs in its immediate neighbors; in 2018, this premium increased to 17 percent. In 2010, wages offered in Fairfax County was on average 4 percent higher than those offered in D.C.; by 2018, D.C. and Fairfax County wages had equalized. Private sector jobs in every industry now command a wage premium in the District compared to all its neighboring counties and cities.
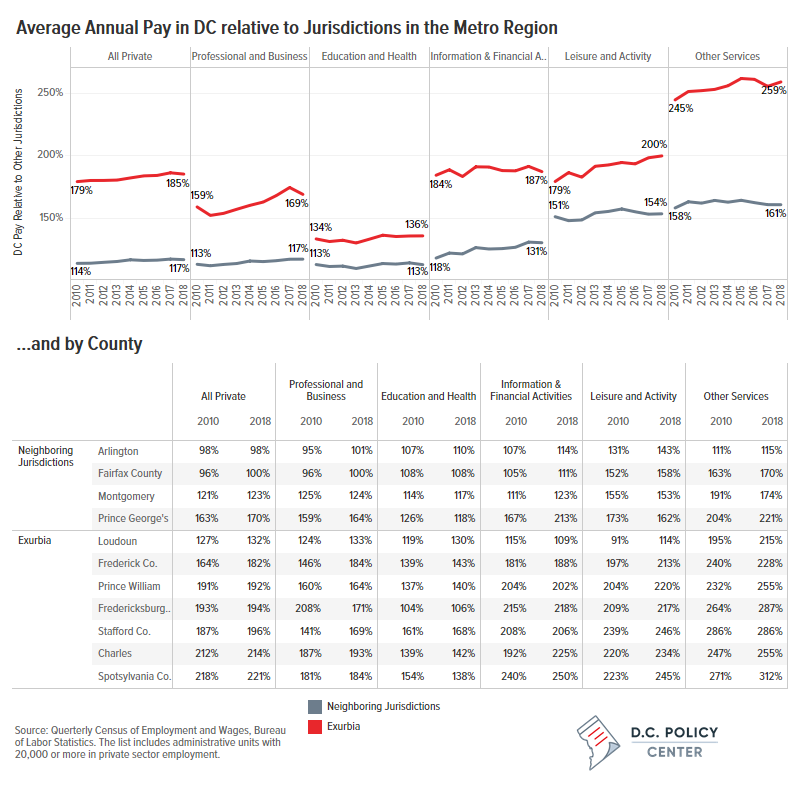
And while exurbia is growing its private sector employment, wages are not growing as fast. The District’s wage premium over exurbia increased from 79 percent to 85 percent between 2010 and 2018, and the growth in wage premiums have been especially high in the leisure industries. The District pays now twice the salary in this sector compared to exurbia. In professional and business services, annual pay is nearly 70 percent higher in D.C. in 2018, compared to a nearly 60 percent premium in 2010. Focusing on Loudoun County, which had the strongest growth in employment, we see that the wage gaps are narrower: Loudoun wages are about 30 percent lower than the District’s; which places Loudoun just behind the Montgomery County in terms of wages that workers can command.
Growing employment is good news for the District. It shows that the city is attracting good business ideas and sound business models that find demand for their products and services at rates greater than neighboring jurisdictions.
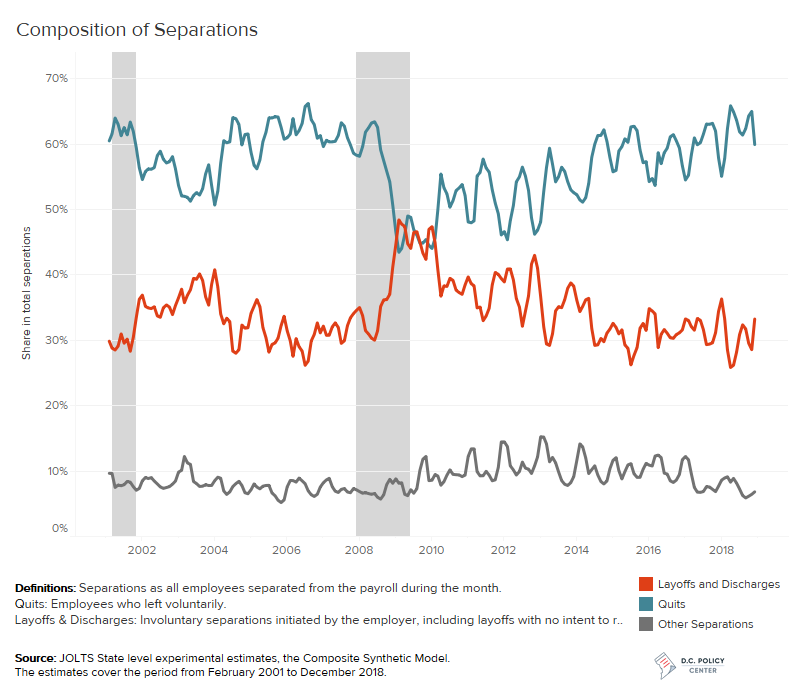
There are indicators that the District’s labor market has been tight since 2014 and turnover in employment is increasingly resulting from people voluntarily leaving their jobs (quits in this chart) compared to layoffs and discharges. This is also evident in the growth in wages that has exceeded the growth in the rest of the region.
These characteristics make the District a good, but a relatively expensive place, to do business.
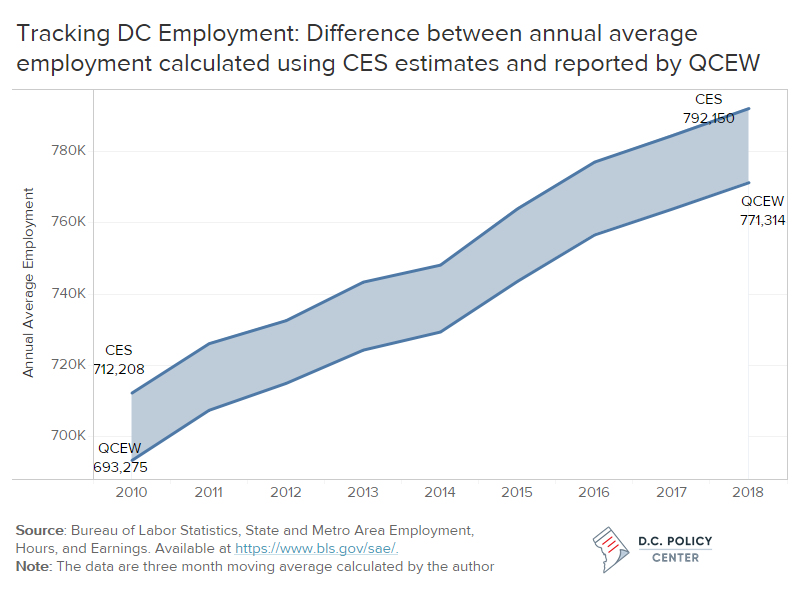
Update (June 28, 2019): In contrast to administrative data, survey data show that D.C. employment is underperforming compared to the region
About the data: A technical note on CES v. QCEW
Current Employment Statistics (CES) are estimates based on a monthly survey of businesses and government agencies, and are considered as one of the most reliable and comprehensive sources of information on employment. The CES estimates are quickest to be announced, allowing tracking of the labor market conditions with little delay. The CES is also comprehensive, as it includes full and part-time employees as well as temporary workers, whether they are paid or not (on leave) during that week.
But CES estimates are not entirely free from limitations. First, they are estimates, and are subject to errors. BLS economists update the estimates once a year as new information becomes available from Unemployment Insurance tax reports, filed by all employers. These revisions can affect the 21 previous months and can be large: for D.C. they varied between an increase of 1.1 percent (in March of 2013) and a decline of 0.6 percent.
Importantly, the CES are estimated for states and metropolitan areas. For D.C., they can tell us how the city is doing relative to the rest of the metro area, but cannot help us identify trends in hiring across different counties in the Washington metro region.
The alternative to CES that allows county-level analysis are data from Unemployment Insurance Tax Records, which are tracked through the Quarterly Census of Employment and Wages (QCEW). This data is based on administrative records, and therefore is not subject to sampling errors. However, it is reported quarterly (as companies are required to file quarterly), with about six months of delay. Additionally, QCEW report only filled jobs of potential interest for unemployment insurance purposes. Self-employed workers, elected officials, some domestic workers, and most student workers at schools are excluded. Therefore, QCEW employment figures tend to be smaller than CES.
For D.C., the difference between CES and QCEW has been consistently between 2.4 percent and 2.7 percent. For 2018, this means QCEW is not capturing nearly 21,000 employees that are captured in CES.
About this publication
This publication is available online at: https://www.dcpolicycenter.org/publications/employment-trends-washington-region/. Download a PDF version here.
The author would like to thank Jeannette Chapman for her feedback and insights.