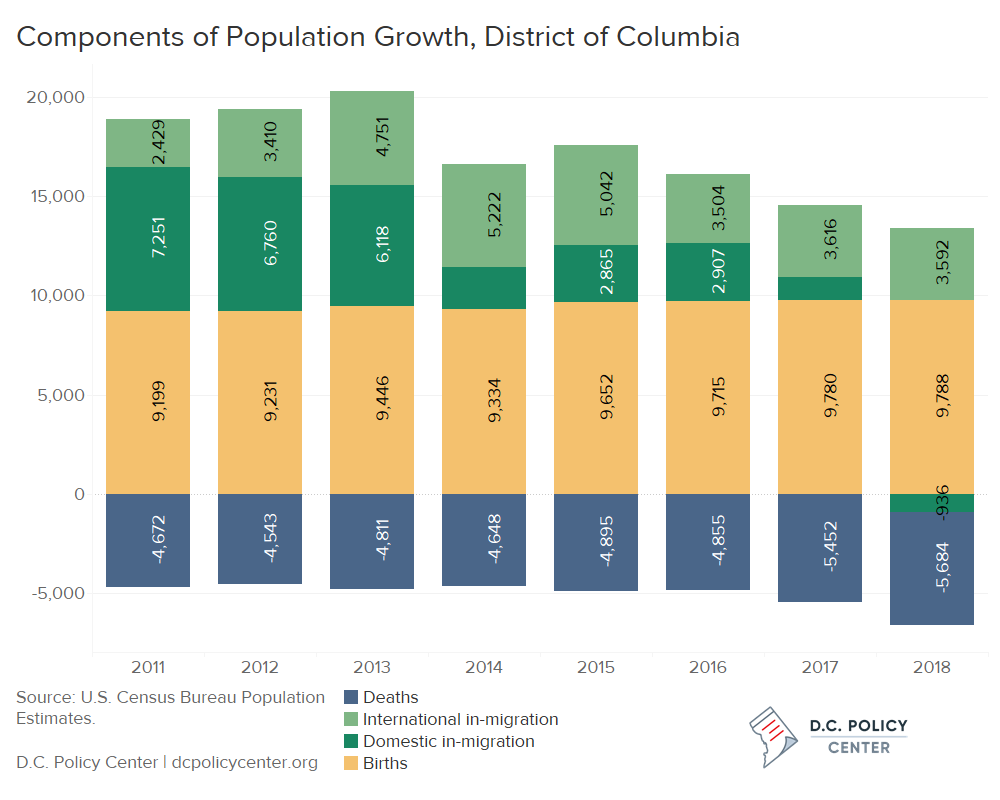
Population growth in the District of Columbia is slowing and migration patterns are changing. Population growth in 2018 was 2,400 lower than the previous year (growth of 6,764 in 2018 compared to 9,116 in 2017).[1] While D.C.’s growth used to be driven in part by domestic migration, the District’s current population gains are propelled entirely by new births and international immigration. In 2018, 936 more people left the District (including for other parts of the metropolitan area) than moved in, reversing the trend of strong in-migration that had added nearly 58,000 residents to the District between 2000 and 2017.
D.C.’s public[2] school enrollment and population have been increasing in tandem since 2012, so changing demographic patterns raise questions about projected growth in public school enrollment. Instead of general migration and population growth, enrollment projections are more directly linked to the number of births (or the base) and the rate at which students select and stay in D.C.’s public schools (or the flow). Despite the slowdown in population growth, enrollment is expected to continue to increase as births have stabilized in recent years and children are enrolling in public schools at higher rates.
A recent D.C. Policy Center report, Will Children of Current Millennials Become Future Public School Students?, projected ten-year growth of 21,100 more students after School Year (SY) 2016-17. This would mean D.C. public schools would enroll 104,625 pre-kindergarten to grade 12 students in SY 2026-27, or about 2,113 additional students per year. The report’s projected enrollment in pre-kindergarten to grade 12 was aligned with the Office of the D.C. Auditor’s citywide projections of 103,584 students enrolled in a model based on residence[3] and the Deputy Mayor for Education’s Master Facility Plan sector-level enrollment projections of 102,984 in SY 2026-27.[4]
However, our projections of future enrollment growth rely heavily on enrollment increasing faster in higher grades, with the expectation that the increased enrollment in public schools in early and elementary years will yield more students staying through middle and high school years. That is, quality school options must continue to attract and retain students from pre-kindergarten throughout high school. If this happens, strong trends in births will continue to drive enrollment. If this does not happen, the lack of options will push families out of the public school system to private schools or out of the District.
Population growth is slowing but births have stabilized
Although enrollment is projected to grow faster than previous years, the District’s population growth has slowed in recent years. D.C.’s population grew by 6,764 residents from 2017 to 2018, or about 560 residents per month, a decrease from four years of growth when the District was adding 1,000 (or more) per month. One driver of this lower population growth is a loss of 936 residents annually due to out-migration, which represents a shift from more residents moving to the District on net in previous years. Another contributing factor is the increase in the number of deaths. The other two components of population growth—international in-migration and babies born in the District—have stabilized, at least according to Census estimates.
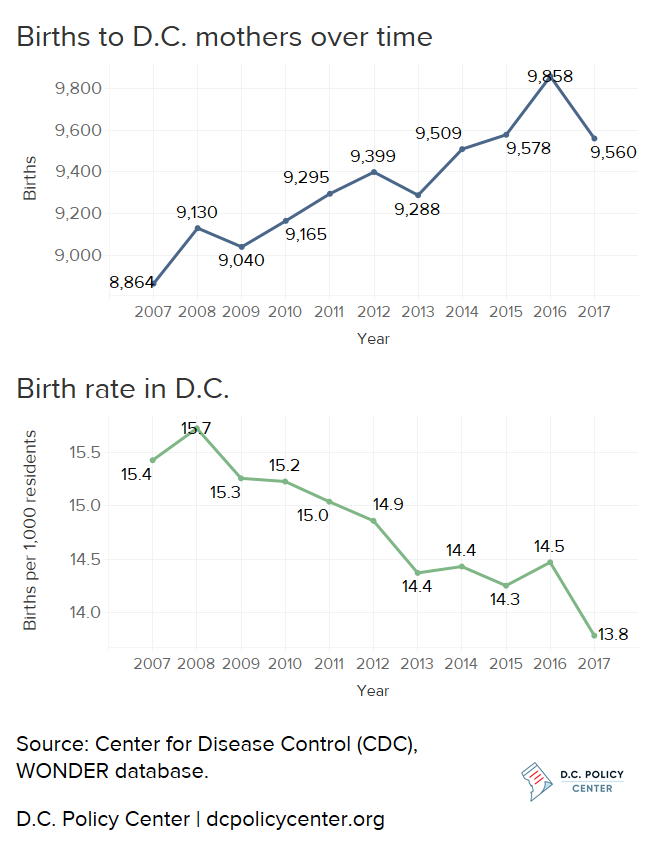
The Census estimates for births are supported—at least through 2017—by the data that the Center for Disease Control (CDC) tracks on the actual number of births. The number of births has increased over the past ten years, with a stabilization in recent years (and a spike in 2016). The CDC has not yet reported the number of births in 2018. This information will inform whether births are continuing to increase or remaining constant. The birth rate in 2017 declined after a few years of hovering around 14.4 births per 1,000 residents.[5] Given the Census projections, it may bounce back in 2018.
Our enrollment projections through 2026-27 assume that births would continue to increase by 134 per year, or the average annual increase in births over the previous ten years. If births remain stable again in 2018 instead, we may revise our projections.
With each new cohort, more students are staying in public schools
While births have stabilized in recent years, the rates at which 2018-19 students stayed in public schools compared to births to District mothers in earlier years increased for all grade bands (represented by kindergarten for early education, grade 5 for elementary school, grade 8 for middle school, and grade 12 for high school). In other words, over the long run, cohorts in final years of grade bands stayed in D.C.’s public schools at higher rates than previous cohorts. A decrease in the share of the school-age population in private schools is aligned with this trend – an estimated 17.6 percent of kindergarten through grade 12 students were in private schools over the period of 2008-2012 compared to 15.6 percent from 2013-2017.[6]
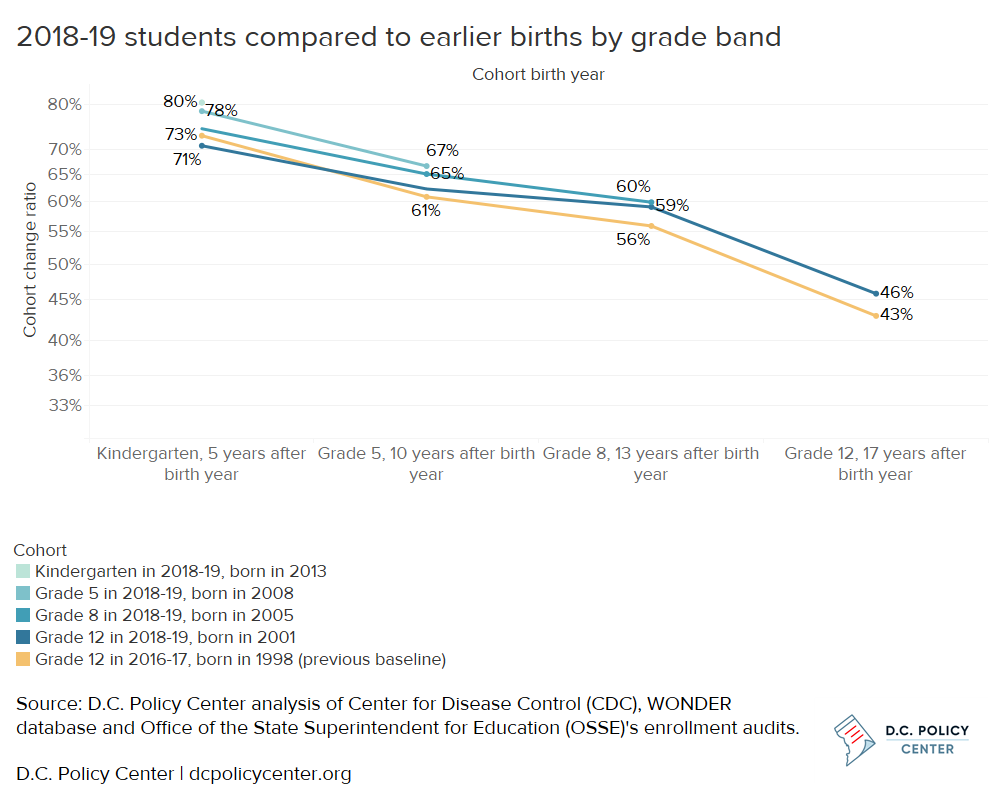
We have updated our cohort retention calculations to include data from 2018-2019 school year. This data show that in 2018-19 the District’s youth were more likely to stay in public schools through high school on net: out of every 100 births in 2001, there were 46 students in grade 12 in 2018-19 compared to 43 students in grade 12 in 2016-17 for every 100 births in 1998.
Persistence through middle school did not increase much for the most recent cohorts, with grade 8 students in 2018-19 representing 60 percent of births in 2005 compared to 56 percent of births for the grade 8 students and births in 1998.
In earlier grades, the rates of staying in public schools across cohorts have continued to increase. There were 67 grade 5 students for every 100 babies born to a District mother in 2008, compared to 61 grade 5 students for the 1998 birth year cohort. And the number of kindergarteners per 100 babies born five years earlier increased to 80 students in 2018-19 compared to 73 students in the 2003-04 school year.
High school enrollment in 2018-19 is lower than projected
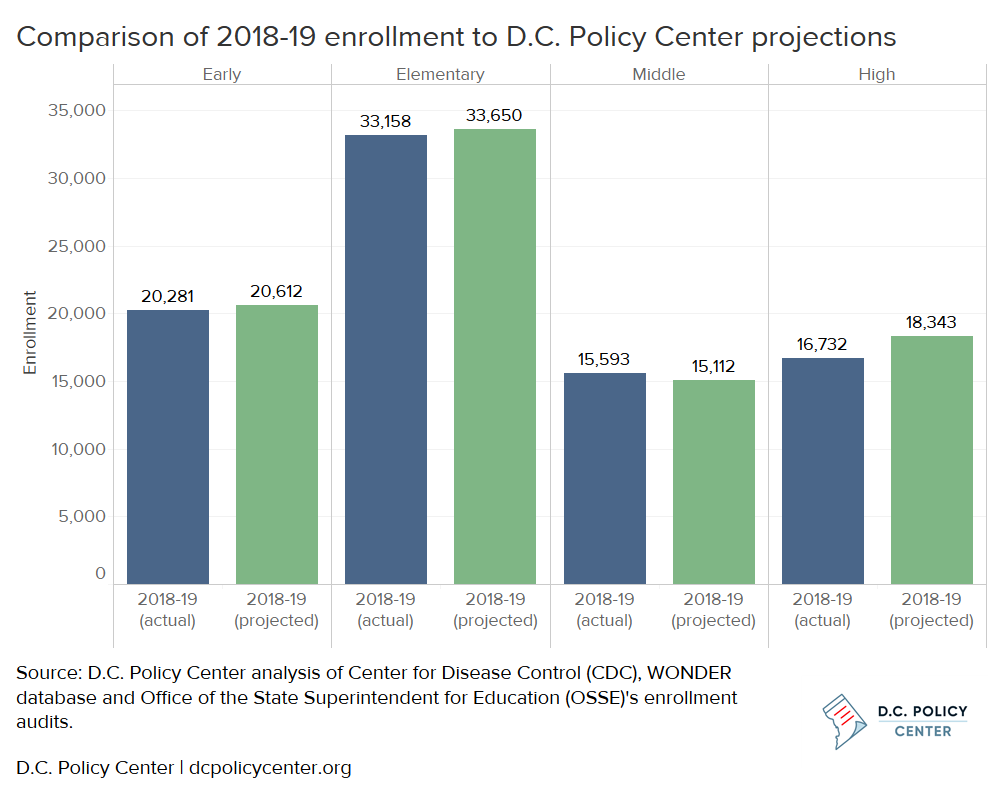
However, drawing students especially into high schools at greater rates will be necessary to realize projections. Overall enrollment in pre-kindergarten to grade 12 has grown by 1,136 students on average per year over the last two years, or about half of the projected growth.
Much of this discrepancy is due to slower than projected growth in high schools. Our model projected that half of growth would occur in middle and high school grades with the expectation that parents and caregivers will continue to choose public schools after their students complete elementary school. While these projections were on target at middle school, they were not realized at the high school level. Actual 2018-19 enrollment in grades 9 to 12 is 1,611 students lower than the projected amount, which continues the trend of high school as the point with the greatest number of exits from the system. This could reflect more dropouts especially if the lower graduation rate in 2017-18 persists or if more students transition to adult schools, which had an increase in enrollment in 2018-19.
What to watch
Updated figures show that births have stabilized in recent years but children are staying in public schools at higher rates over the long term, signaling that enrollment will continue to increase if there are quality options to attract and retain students throughout high school. Births in 2018 and public school enrollment in 2019-20 will allow for recalibration of enrollment projections. Births will show whether the base is expected to remain the same for those entering kindergarten, and enrollment will show whether students are still increasing choosing public schools. Importantly, realizing future growth in enrollment depends on stronger middle and high schools as half of growth is projected in these grades.
This can be done by quality options that attract students, especially in high school where quality schools also have the potential to reduce disengagement from school.
Notes
This posted was updated on July 31st, 2019 to correct the cohort change ratio for kindergartners born in 1998 to 73%.
[1] U.S. Census Bureau Population Estimates. https://www.census.gov/programs-surveys/popest.html
[2] Here and throughout, public schools refer to both traditional public and public charter schools.
[3] The residency model is intended for facility and boundary planning.
[4] Both enrollment estimates were calculated from reported totals based on average annual growth.
[5] Center for Disease Control (CDC) WONDER database. https://wonder.cdc.gov/
[6] American Community Survey 5-year Estimates. https://www.census.gov/programs-surveys/acs/data.html
Chelsea Coffin is the Director of the Education Policy Initiative at the D.C. Policy Center.
Photo: Courtesy of Allison Shelley/The Verbatim Agency for American Education: Images of Teachers and Students in Action