Administrative data are slowly catching up with the impacts of the COVID-19 induced economic downturn. On March 9, 2021, the Bureau of Labor Statistics released the full data set for the Quarterly Census of Employment and Wages (QCEW) through the third quarter of 2020 (ending September 2020). What the data show is somewhat of a puzzle.
The District has lost many jobs but added many businesses.
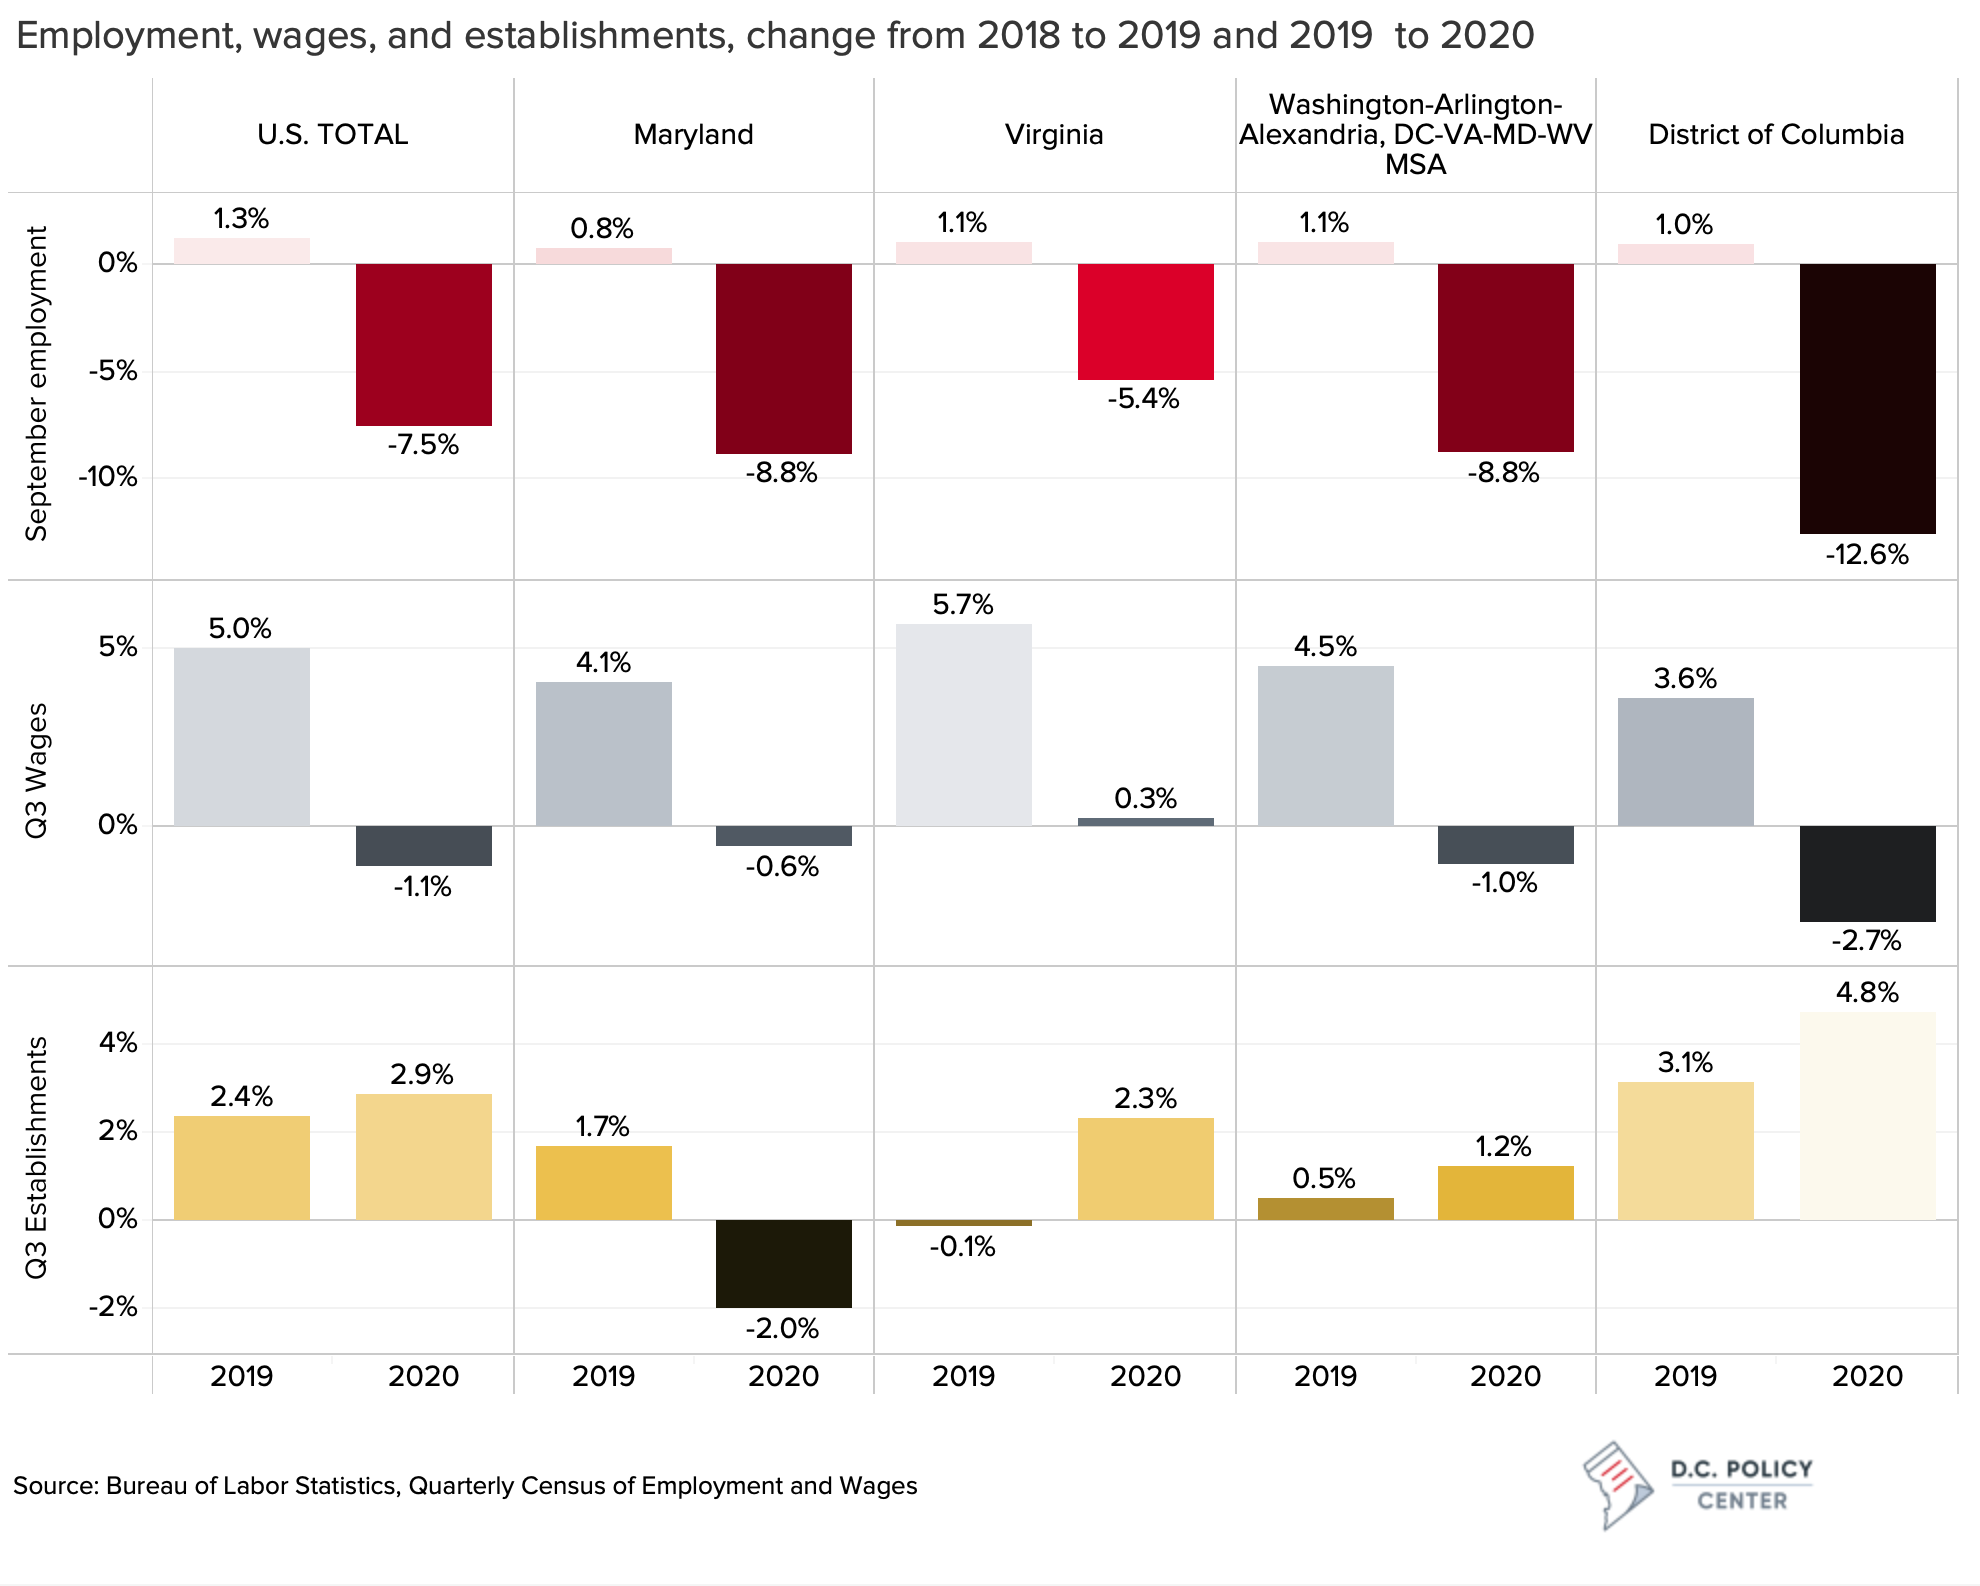
Between September of 2019 and September of 2020, private sector employment in the District of Columbia declined by 12.6 percent (or 68,000 jobs lost), and wages earned in the third quarter of 2020 were 2.7 percent below where they were a year ago. By both metrics, the District’s losses exceeded the United States average, the states of Maryland and Virginia, and the greater Washington metropolitan area. But there was one area where the city shined: The number of wage-paying establishments—on net—grew by 4.8 percent during this period, at a rate much faster than many other places in the country.
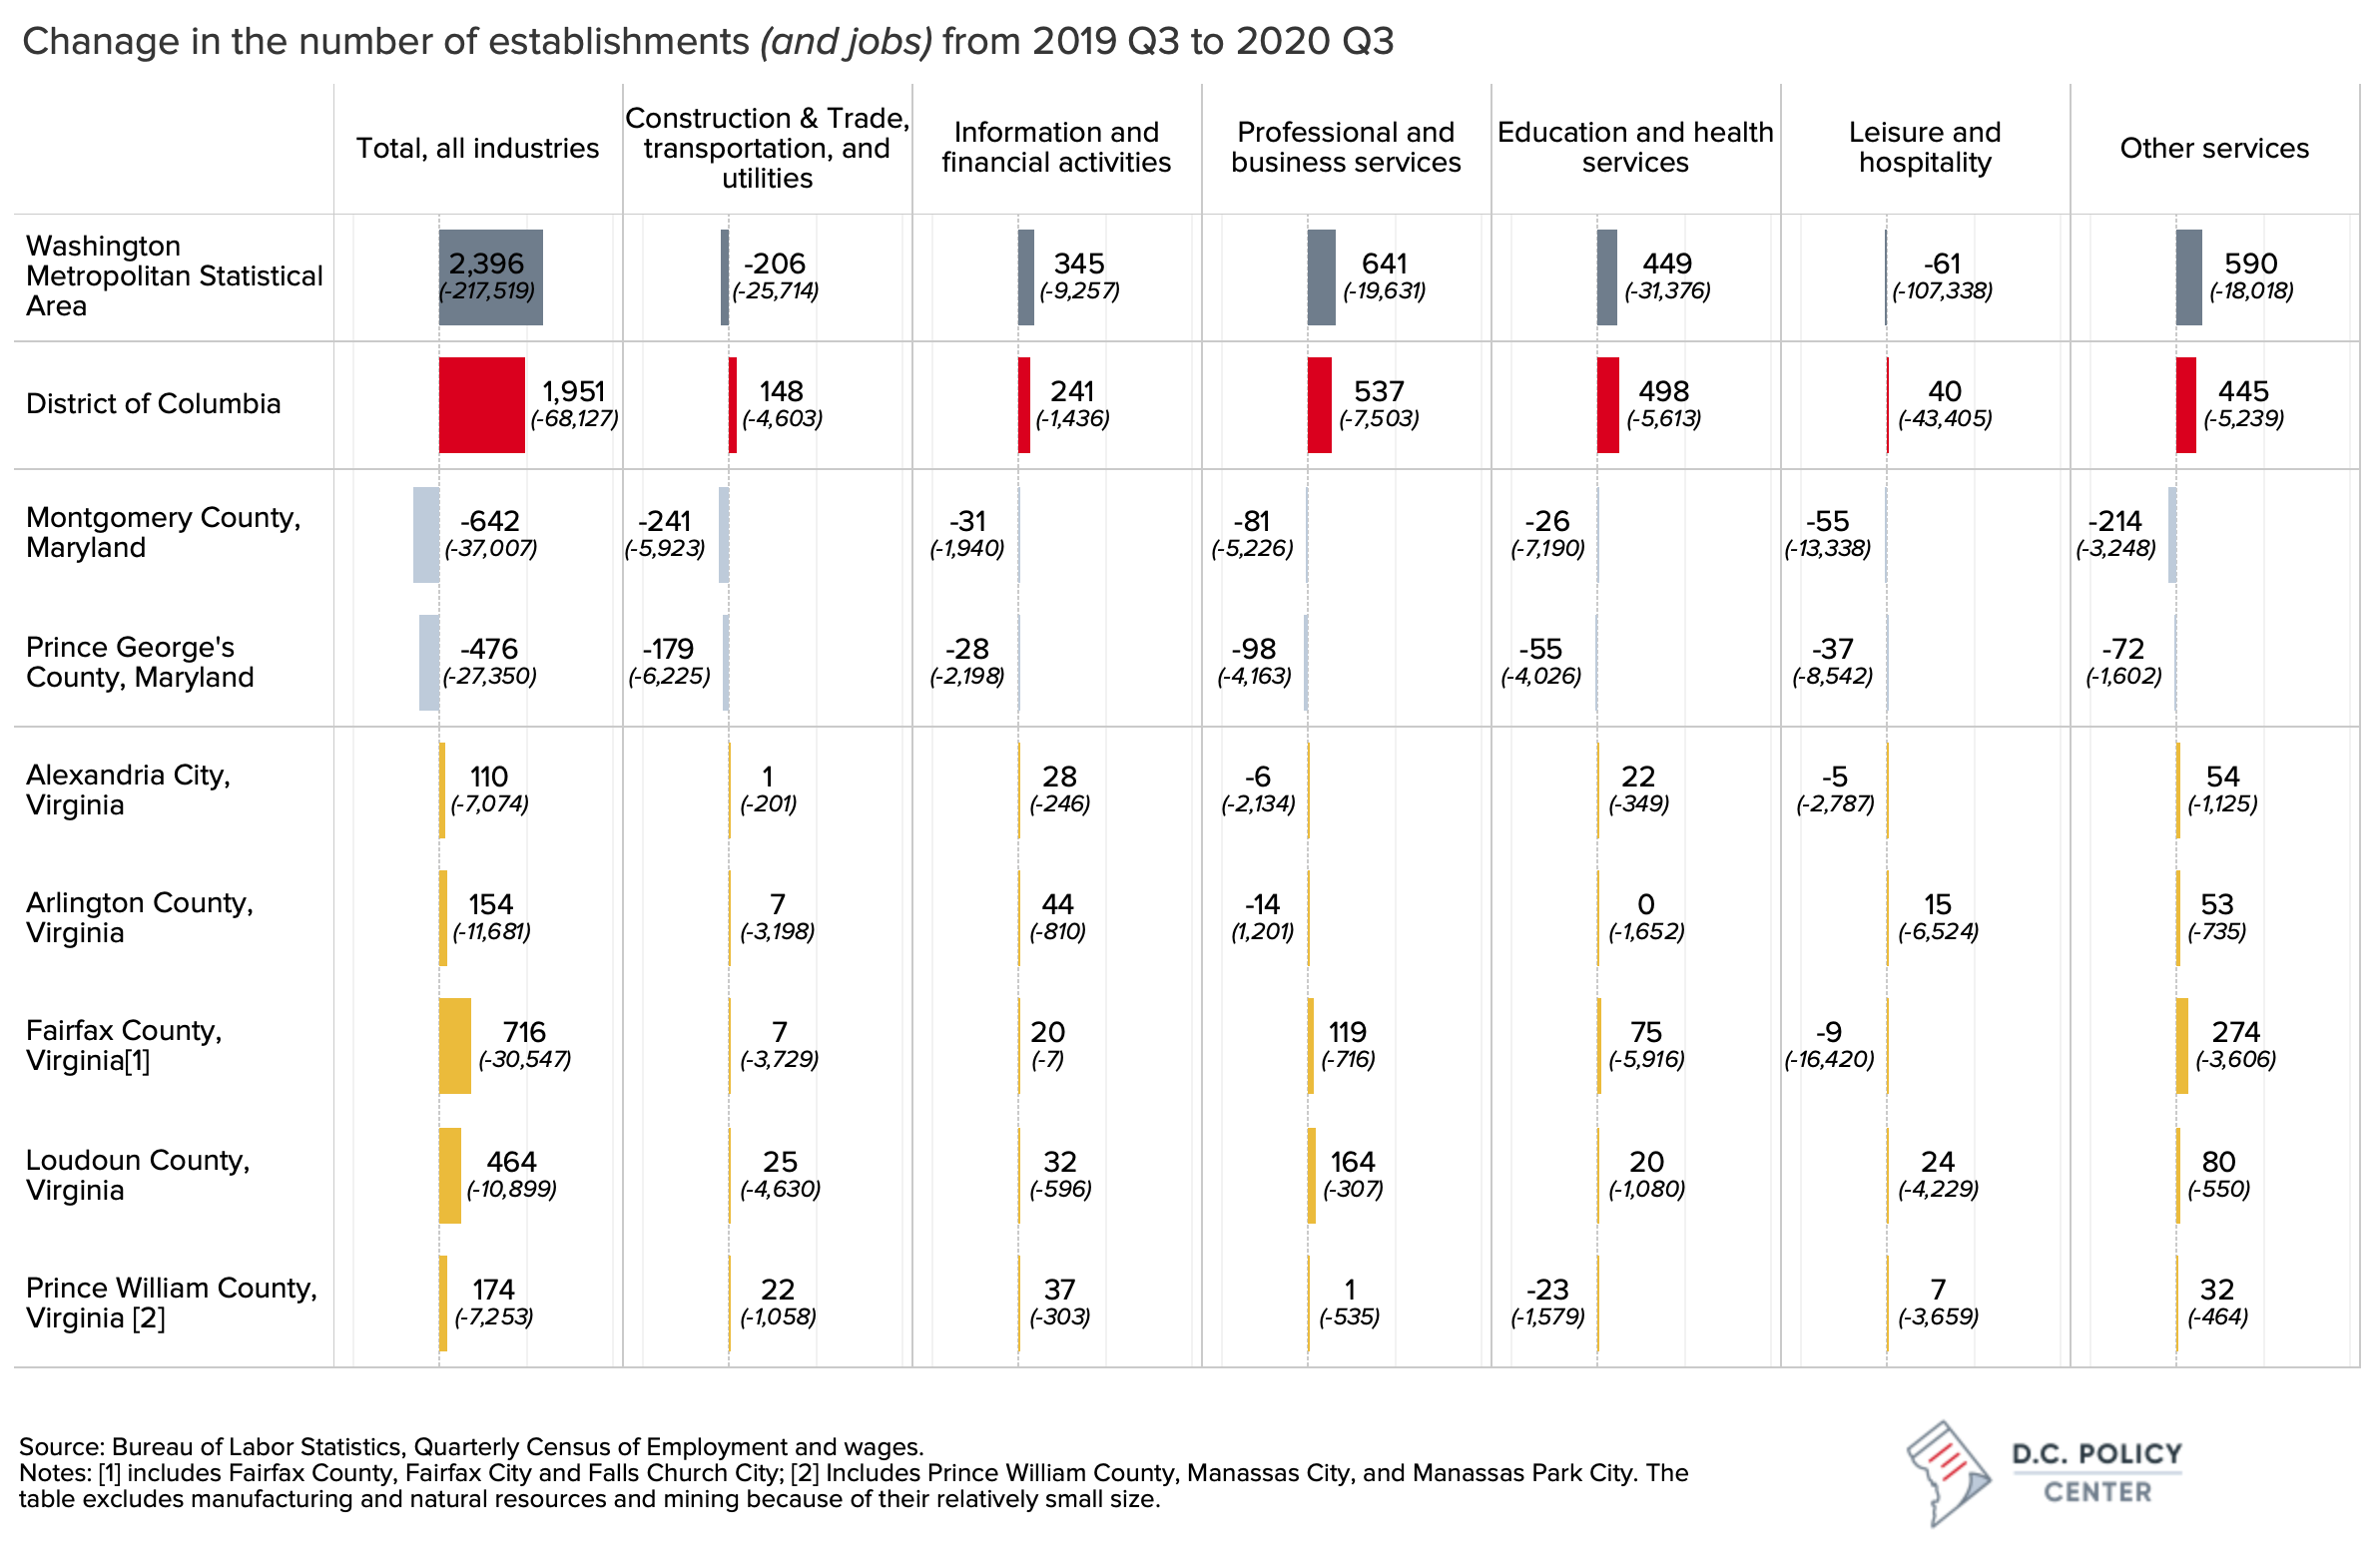
This single-year period shows a great degree of divergence in the trajectory of jobs and business establishments, specifically in the District. Between September 2019 and September 2020, the entire metropolitan area lost 217,519 jobs and among the jurisdictions that make up the region, the District of Columbia accounted for 31 percent of this loss. In contrast, the region added 2,396 net new establishments, and the District accounted for 81 percent of them. This divergence is even more stark for the city’s key industries: In professional and business services, the District lost 7,500 jobs according to unemployment records (38 percent of the loss in employment in this sector in the metro area) but added 537 net new establishments (83 percent of net new establishments in the metro region). In education and health, the District and Fairfax County[1] experienced similar levels of job losses (5,600 and 5,900 respectively), but the number of net new establishments in the District (498) exceeds that in Fairfax (70) by an order of magnitude. Even in leisure and hospitality sectors, where the District accounted for nearly 40 percent of total job losses in the entire metro area, the city reported 40 net new establishments.
This net new establishment data is simply a summary of all establishment counts; it is not tracking the individual establishments or linking them over time or across locations. Some of these establishments that appear in the QCEW reports for the first time are not new, but they are new to the city: either moving in from elsewhere or opening a branch in the city. Others are brand new, reporting employees for the very first time. And yet others could appear in the data even after laying off all their employees if they are still filing reports with the District’s Unemployment Insurance Program. To distinguish between establishments that are at different stages of their life cycles, we turn to the Business Employment Dynamics data which tracks establishments across the country to identify if which establishments are truly new (reporting hires for the very first time), which are expanding (adding new employees), which are contracting (reporting fewer employees), and which are closed (reporting no employees).
Even through the pandemic, new businesses are opening at pre-pandemic rates.
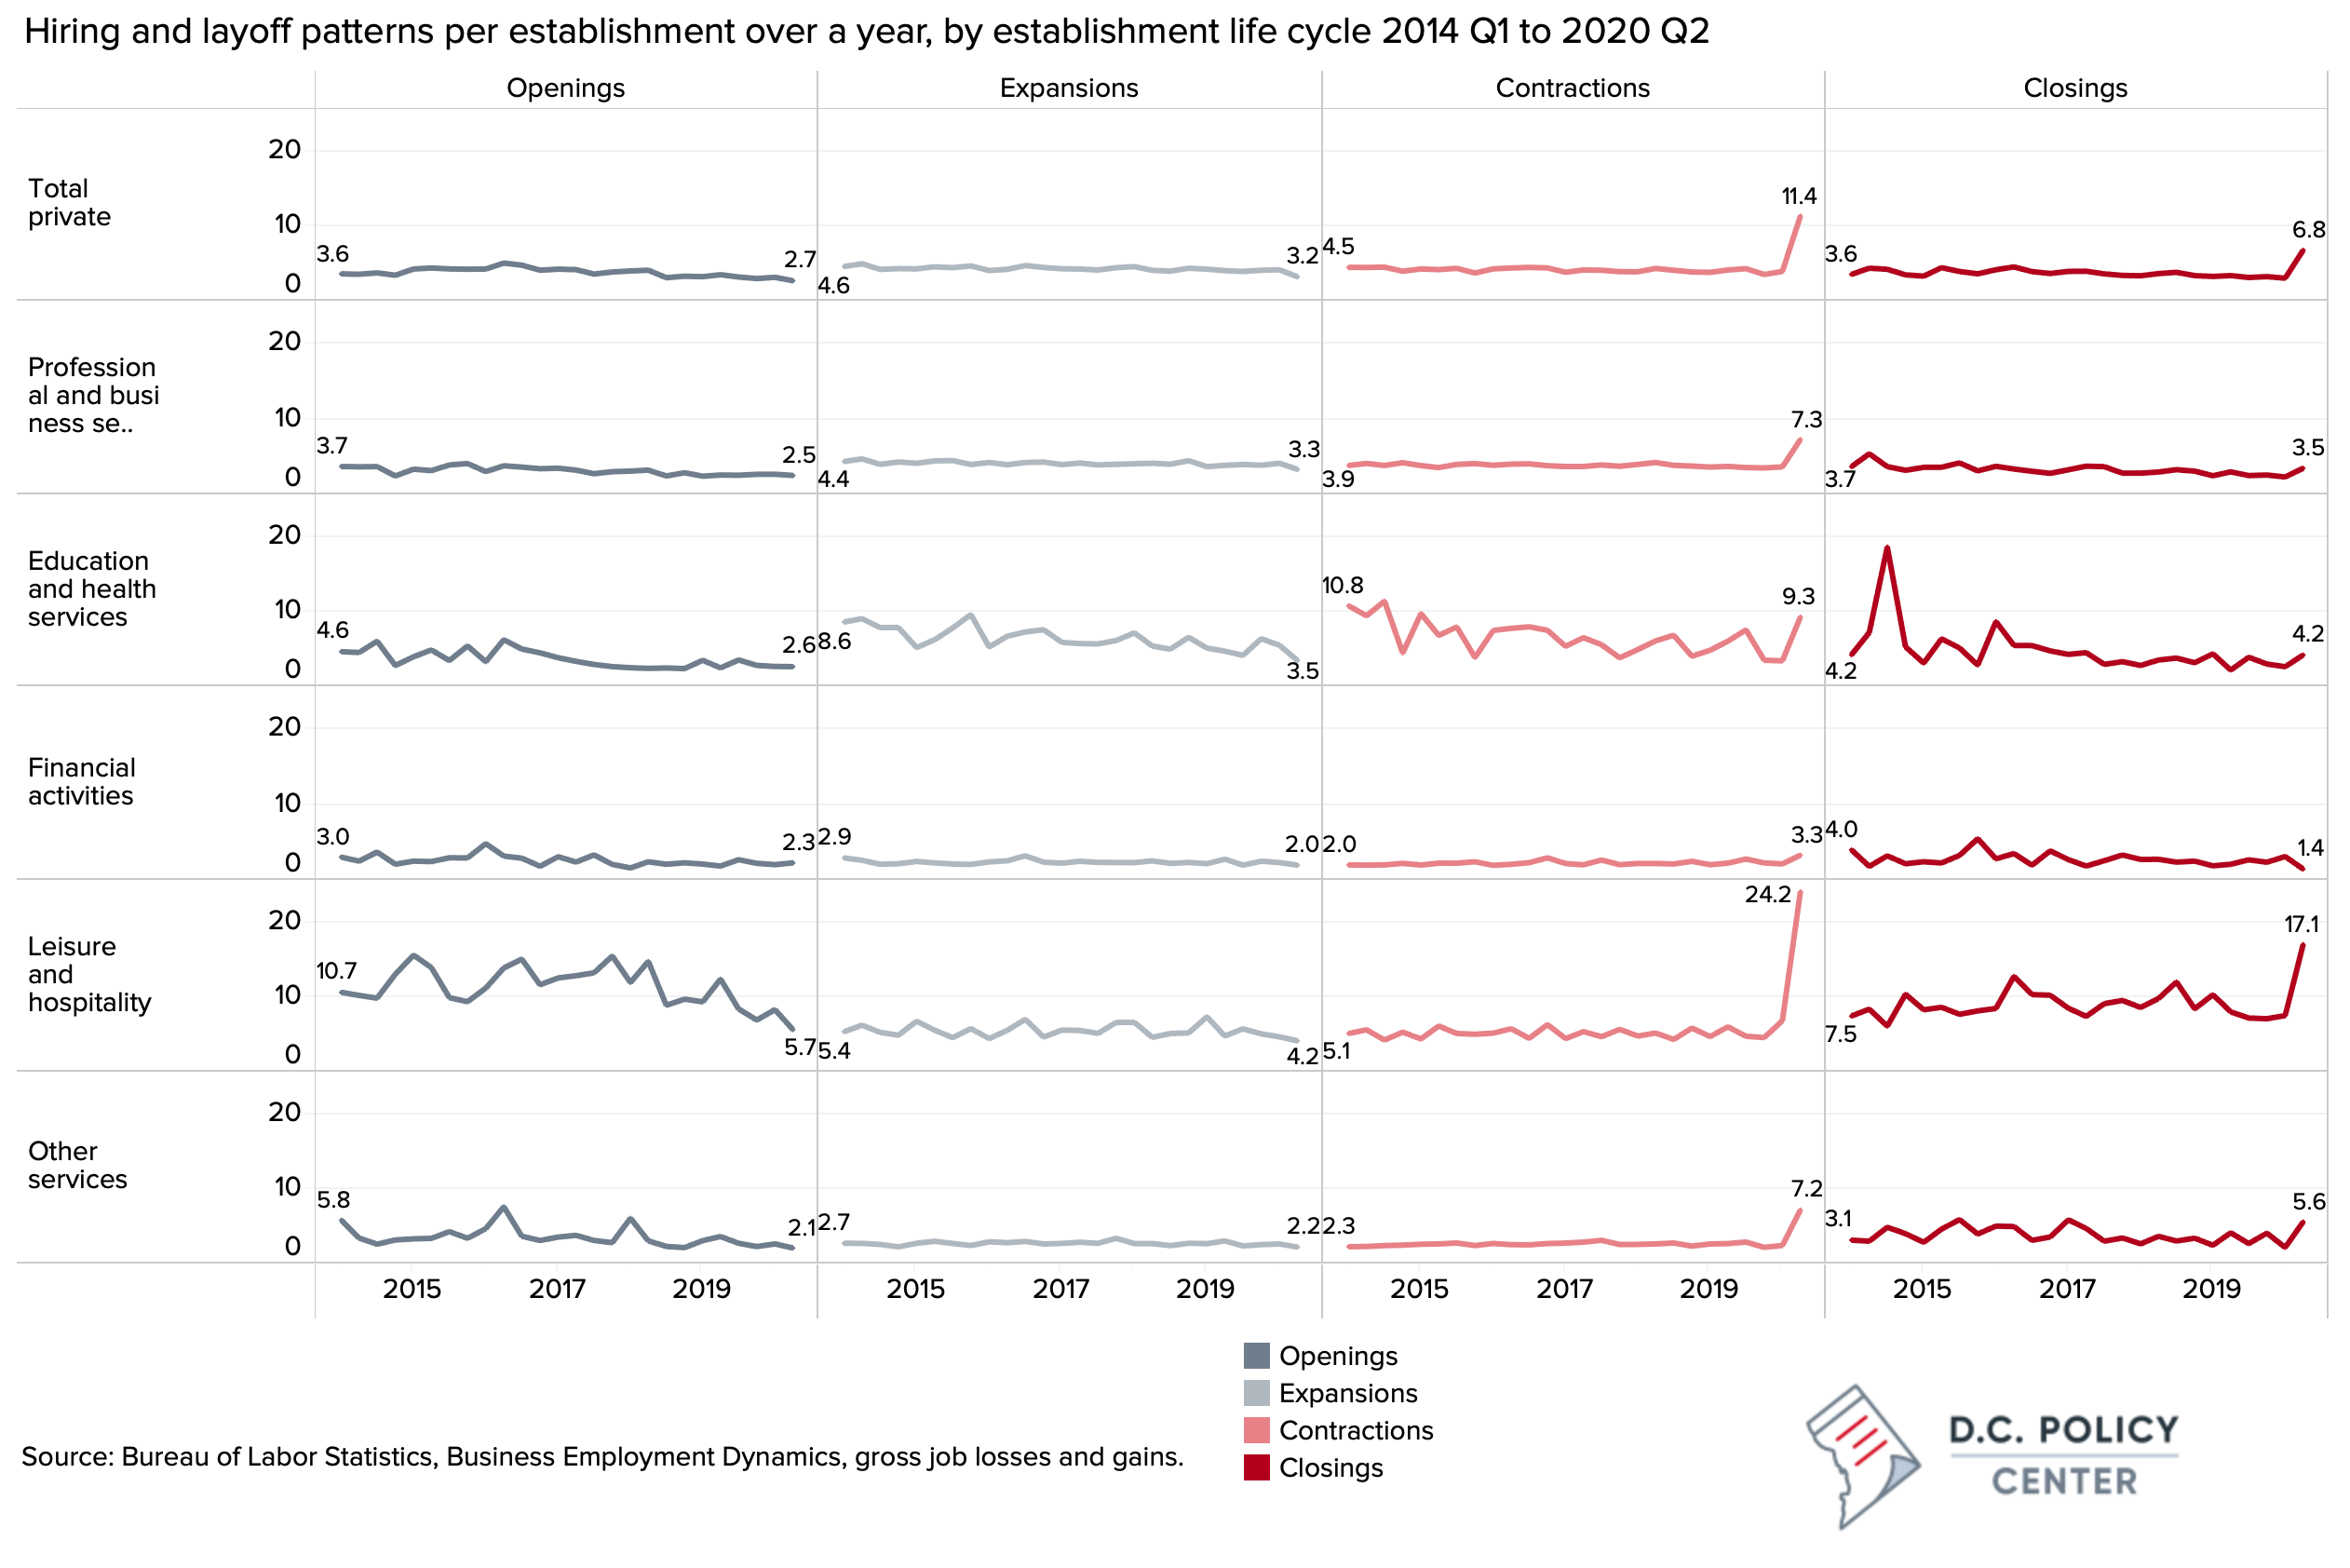
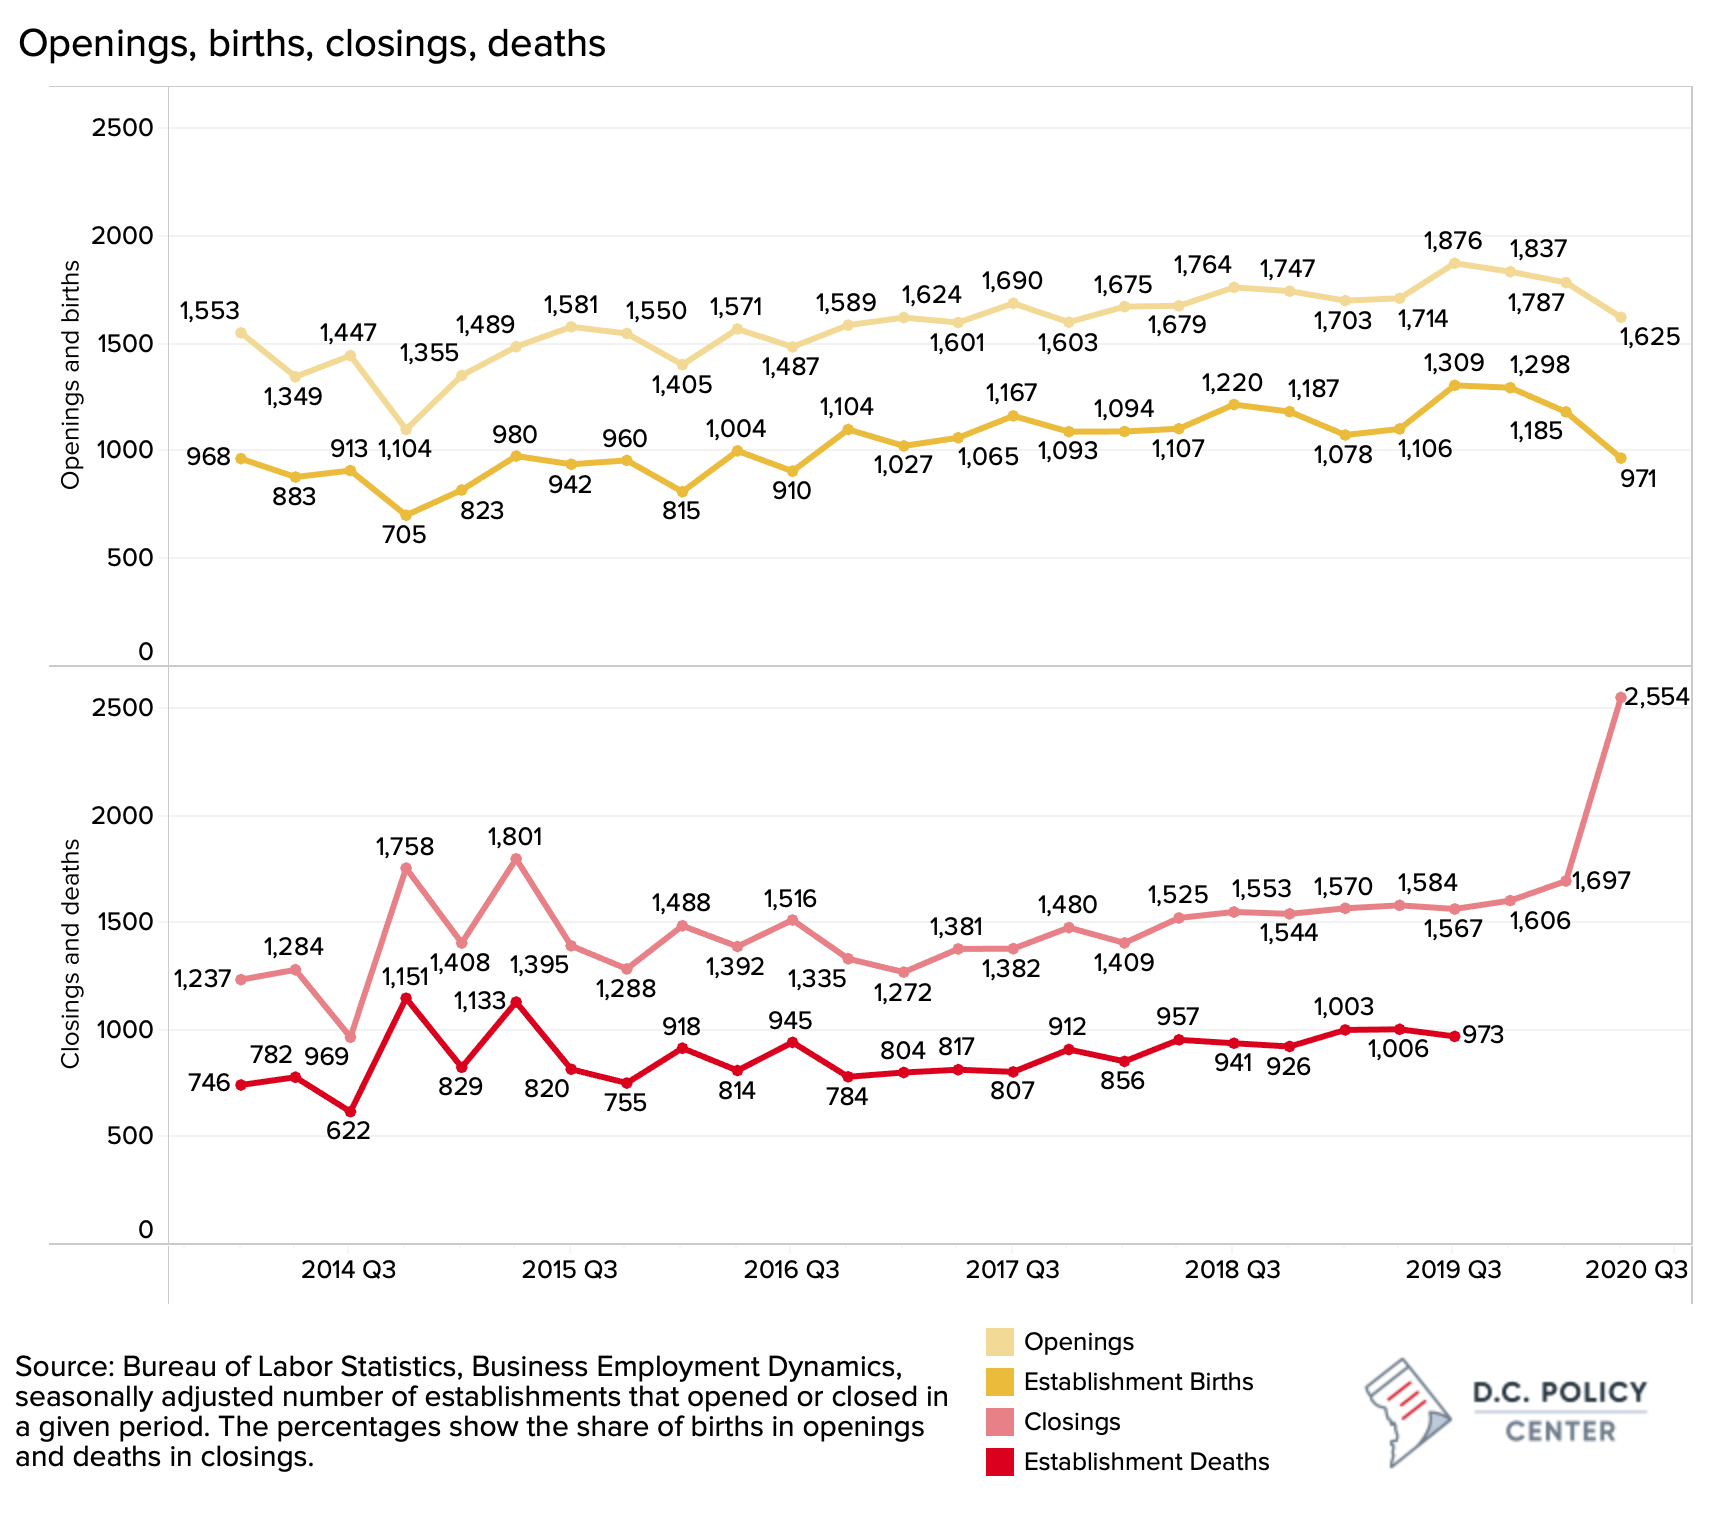
Data on business openings and closings in the District (which go only through the second quarter of 2020) show that while business closures have become more common, the pace of new business formation in the District has not slowed down. Across the entire private sector, by mid 2020, businesses were closing faster (19 percent increase in closures compared to previous year) but also opening faster (2 percent increase). [2]
In professional services, for example, every quarter since the third quarter of 2014, the number of new businesses that had opened in the past year has exceeded the number of businesses that closed (even though the gap has closed a bit in 2020). By June of 2020, business openings and closures were happening at the exact same rate (both 2 percent above the previous year’s levels). While more businesses in education and health care services closed compared to the past years (54 establishment closed), more businesses opened too (55 new establishments). Even in the hardest-hit leisure and hospitality sector, close to 1,000 hotels, restaurants or entertainment venues closed their doors between September of 2019 and September of 2020 (in a typical year, only about 500 close), but the pace of openings has held steady at about 110 new establishments per quarter.
Post-pandemic start-ups are similarly sized to pre-pandemic ones.
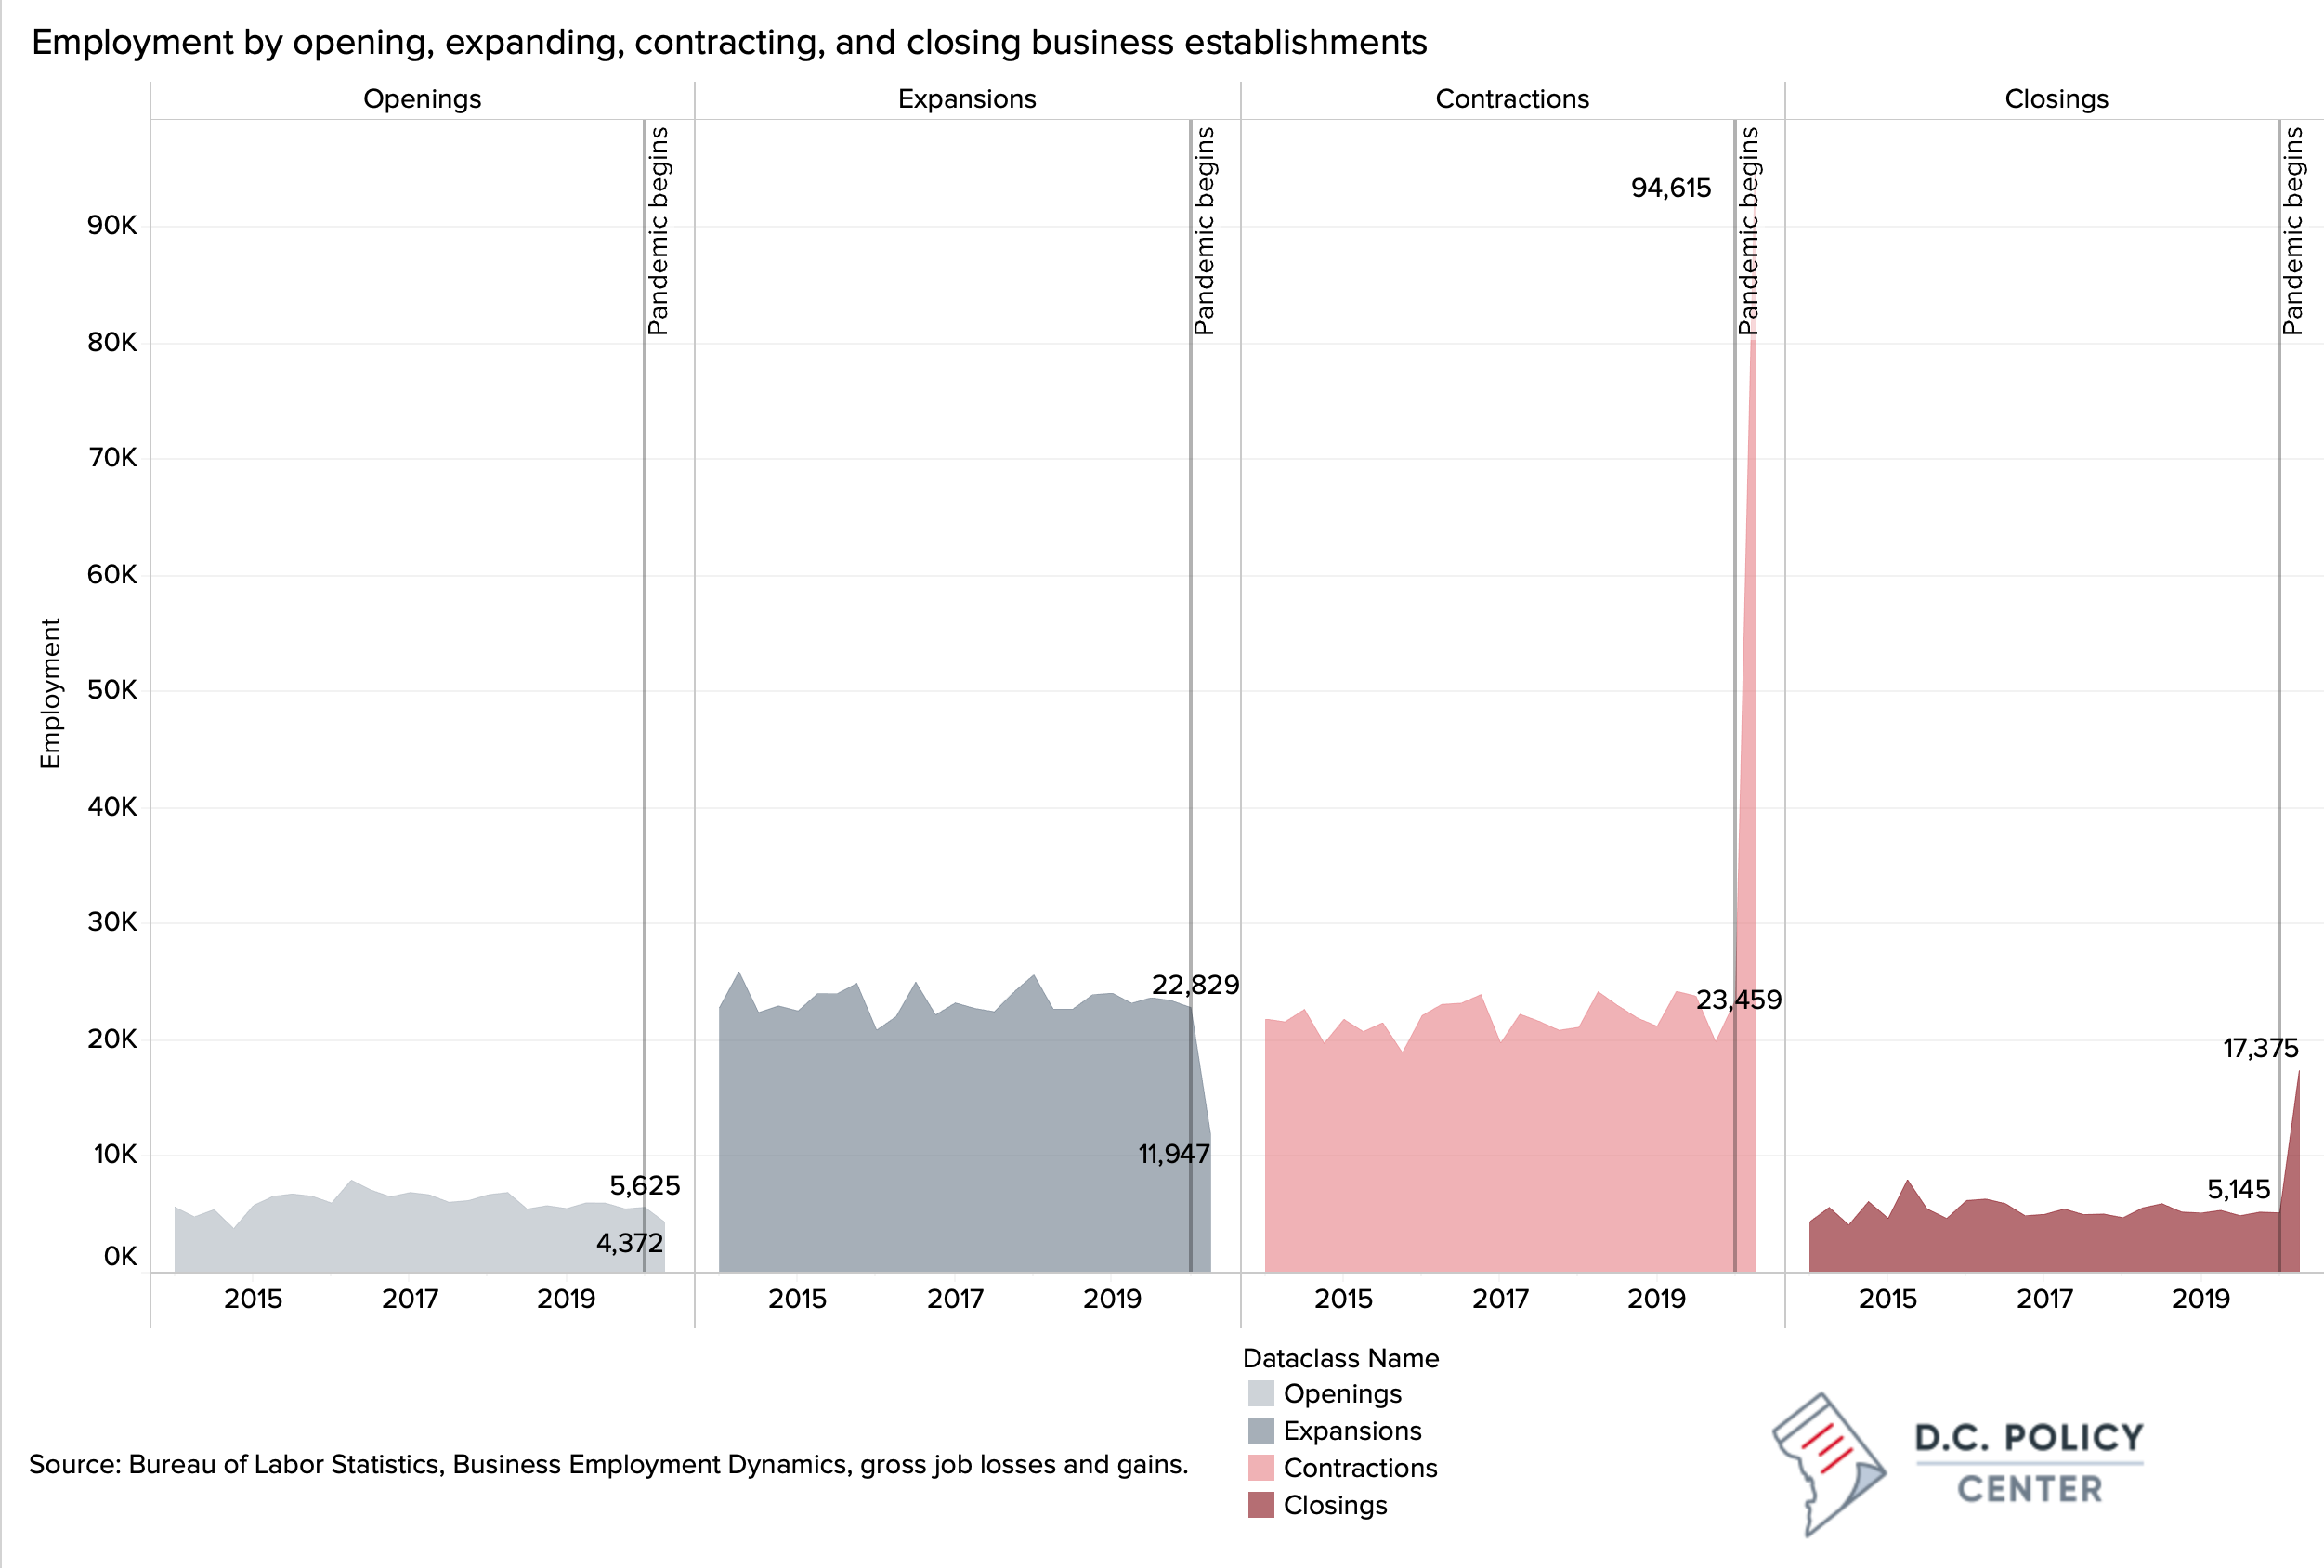
Prior to the pandemic, hiring at the “new or expanding” establishments typically exceeded layoffs at “contracting or closing” establishments, leading to overall job growth. Since January 2020, the main propellent of job losses has been significant layoffs in existing establishments. In a typical quarter, about 22,000 workers are laid off from businesses that are contracting in size. In the second quarter of 2020, that number jumped up to 95,000. While these are large numbers, they also provide hope that employment could bounce back quickly because the underlying establishments are surviving the pandemic. During the first half of 2020, hiring activity also slowed down in expanding establishments, and job losses from all businesses that closed were three times more than what we typically observed prior to the pandemic. At the same time, hiring by start-ups remains at historical levels. Hiring by start-ups in the first quarter of 2020 was at levels about similar to 2019 and fell only marginally in the second quarter of 2020.
Importantly, the size of start-ups remained stable through the pandemic. Across the entire private sector in the District, a brand-new establishment has typically opened with three employees (on average). This has not changed during the pandemic. Across sectors, however, there is some variation. A leisure and hospitality start-up (with an average of 6 employees since the beginning of the pandemic) is half the size of a typical start-up from the pre-pandemic period. In contrast, business establishments that have closed since the pandemic were larger compared to the pre-pandemic period. Since 2014, a typical establishment that closed its doors had about four employees. This number jumped up to seven in 2020. We see this trend across all sectors, but especially in leisure and hospitality, where the size of a closing establishment increased from about 8 employees to over 17.
New business applications have been on the rise.
What explains the growth in the number of establishments in the District through the pandemic? Is it possible that the swelling number of establishments could be a data fluke (for example some businesses continue filing reports with the Unemployment Insurance Program even after they lay off all their workers)? Or is this growth tied to various support programs established during the pandemic (such as the Payroll Protection Program and the District’s own Bridge Fund) which might have helped keep afloat some businesses that would have closed during normal times? While it is too soon to answer these questions, there is at least one piece of evidence that suggests that growth in establishments could be reflecting increased entrepreneurial activity.
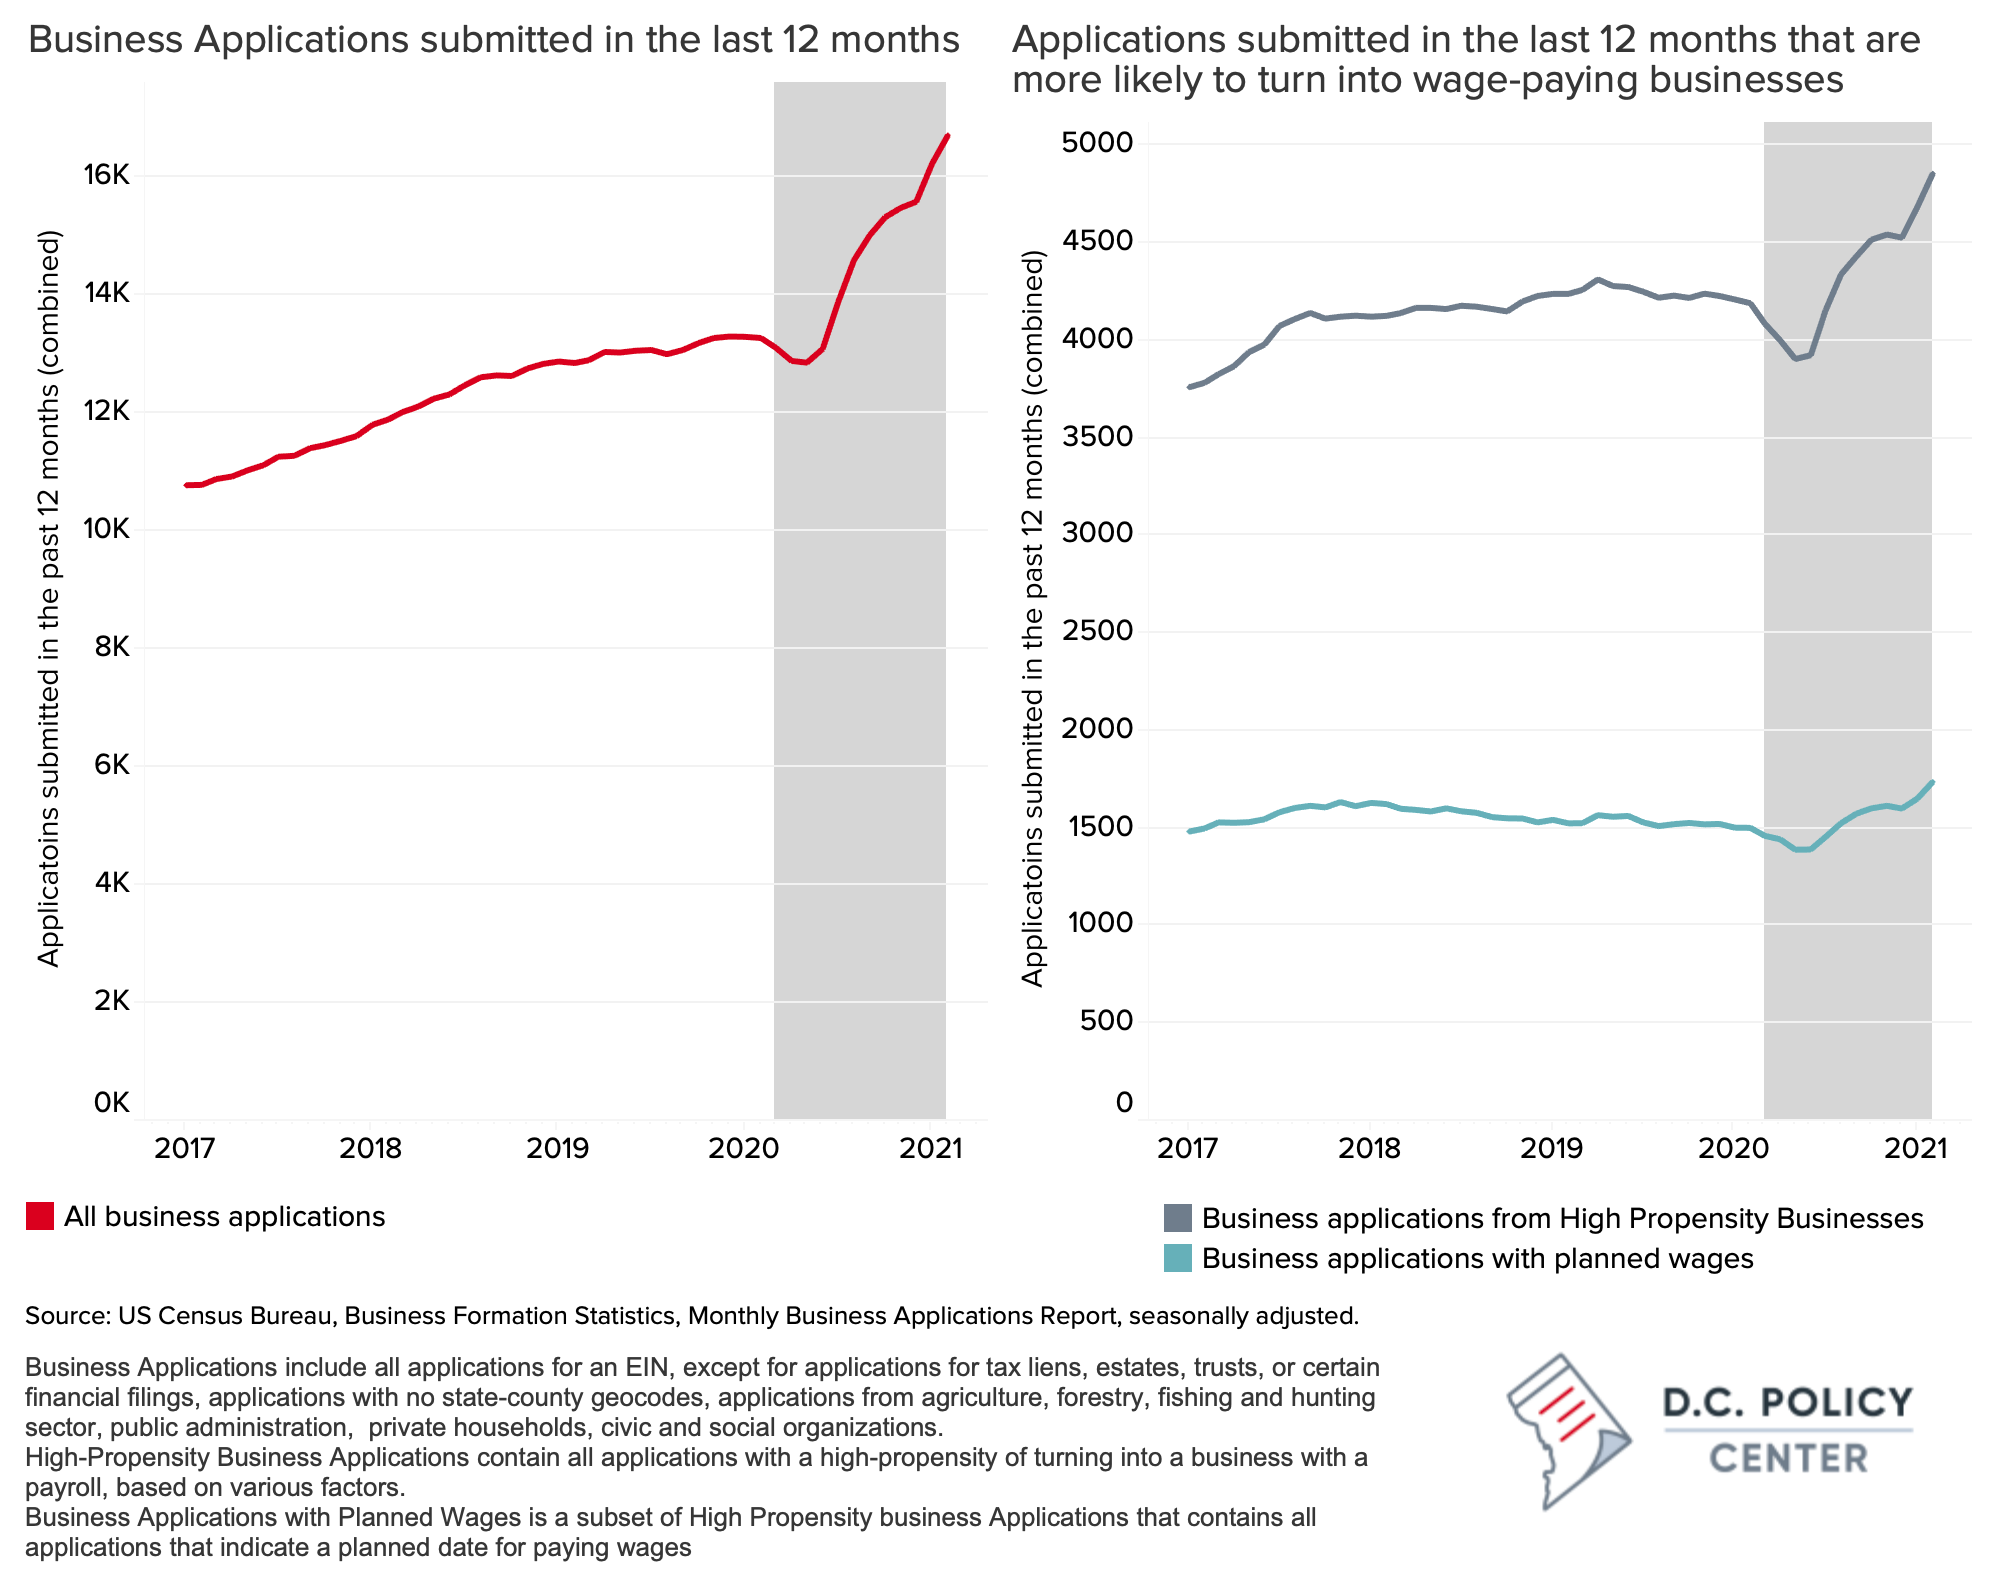
Since the beginning of the pandemic, there has been a significant uptick in the number of business applications in the District of Columbia. Throughout 2019, the number of business applications that were submitted in the previous 12 months have remained relatively stable, at about 13,000. By February of 2021, that number had jumped to over 16,000, showing an increase of 23 percent.
Obviously, not all businesses applications turn into wage-paying businesses. Some will not move beyond being just an application, and others will not be able to raise enough capital to begin operations. To help identify the underlying business formation trends, the Census Bureau also keeps track of applications that are more likely to turn into wage-paying businesses, called “high propensity businesses.”[3] A subset of this group is applications which indicate in their applications the date on which they will begin paying wages to employees. Both types of applications are increasing, showing about a 20 percent increase over their historically stable levels.
Opportunities in the post-COVID economy—and not increased unemployment—are driving business applications
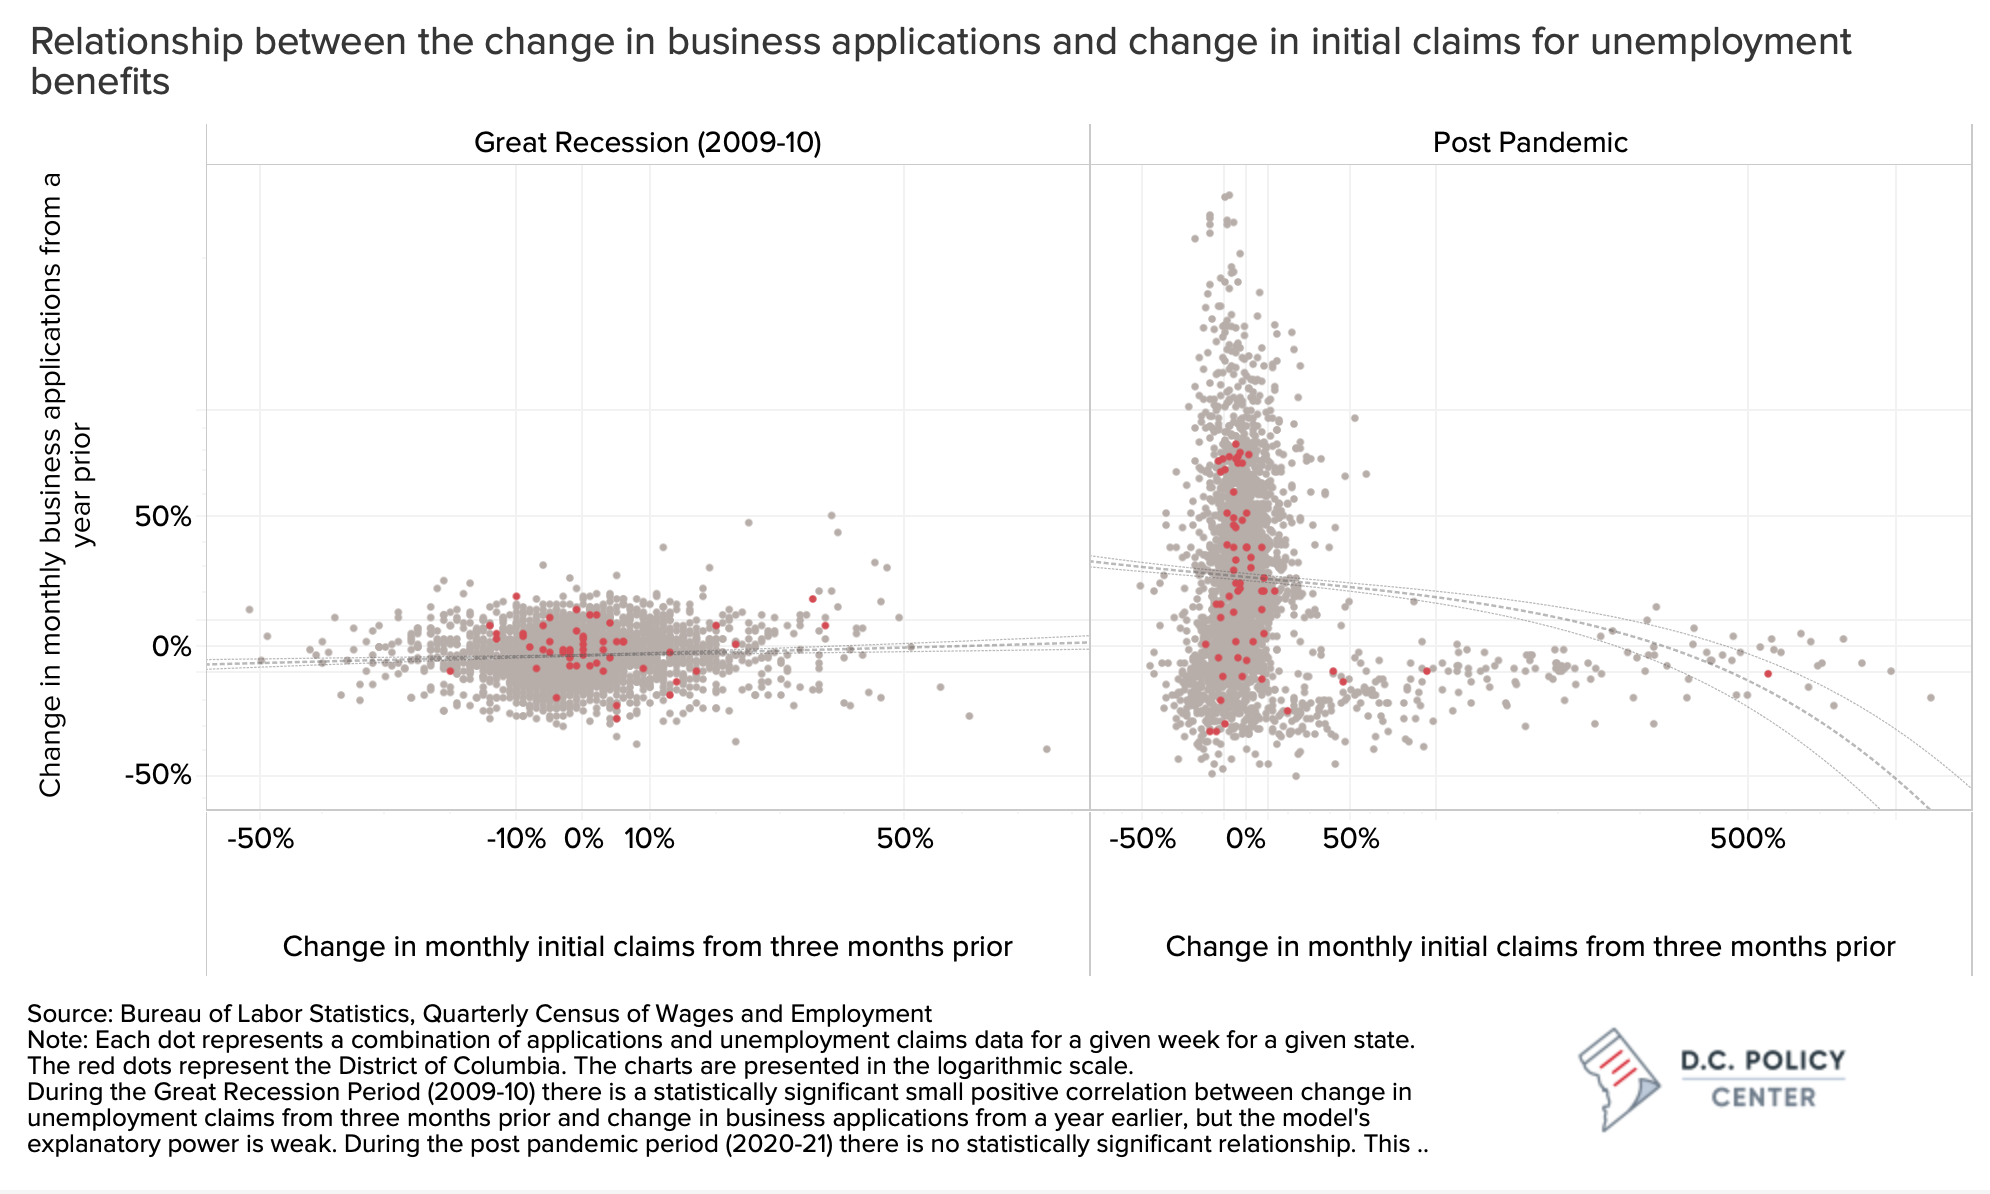
There is some historic evidence that business startups increase during periods of high unemployment as people who lost employment due to the pandemic and associated shutdowns may have tried to create their own opportunities by starting a business (here, here, and here).
But post-pandemic entrepreneurial activity appears to have less to do with lack of employment opportunities and more with new business opportunities that the pandemic has brought along. The chart below plots the change in the monthly number of business applications from the previous year against the change in the number of monthly initial unemployment claims from three months prior. Each dot represents a state and a week between the periods of 2006 and 2021 (red dots are the District of Columbia). We could not find a strong relationship between initial unemployment claims in the last six months and business applications in the last month (this holds true both for levels and changes although only changes are shown in the chart below). This analysis also highlights that business application and start-up patterns after the pandemic are going to look very different from the same in the aftermath of the Great Recession—an observation verified by other research. Others have found that business applications submitted since the beginning of the pandemic are neither correlated with the unemployment rate nor the share of “teleworkable jobs” in a state.
Perhaps the generous unemployment benefits have weakened the link between unemployment and business applications. At the same time, new business applications appear to be linked to opportunities in the COVID-19 economy: applications have been particularly strong in online retail as the pandemic increased demand for online shopping, but analysis of nationwide data shows an uptick in business applications across all industries.
Plenty of space (and a great need) for new businesses
In the District of Columbia, the economic (and the revenue) costs of the pandemic-induced recession have gone far beyond job losses. The District’s economy has largely been dependent on its “destination” status: commuters and tourists have helped create strong street-level activity; and office buildings, hotels, and restaurants that serve and house them have been among the most important sources of revenue growth in the city.
Since the beginning of the pandemic, tax revenues that are reliant on this “destination” status have taken the greatest hits: As tourists and commuters disappeared, the city lost nearly one third of its general sales tax revenue in fiscal year 2020, and the fiscal year 2021 revenue projections show an additional decline of 9 percent over fiscal year 2020, suggesting that a return to normal street-level activity will not come until late in the fiscal year. Parking taxes (which are dedicated to WMATA) have taken an estimated 56 percent hit.[4] Even traffic fines collected through automated enforcement have declined by an estimated $39 million, or 26 percent.[5]
The second-order revenue impacts from lack of vibrancy in the District’s employment centers are yet to be seen: As noted in the February revenue letter, lower demand for office space—whether because of changing commuting patterns or a potential flight from high-cost urban areas—would be a significant revenue hit to the city. This is because tax assessments for these buildings reflect their income generating capacity. While increased vacancy in a single office building will not change its assessed value, increased vacancies everywhere will collectively reduce the value of all buildings, even those that may be filled to capacity.
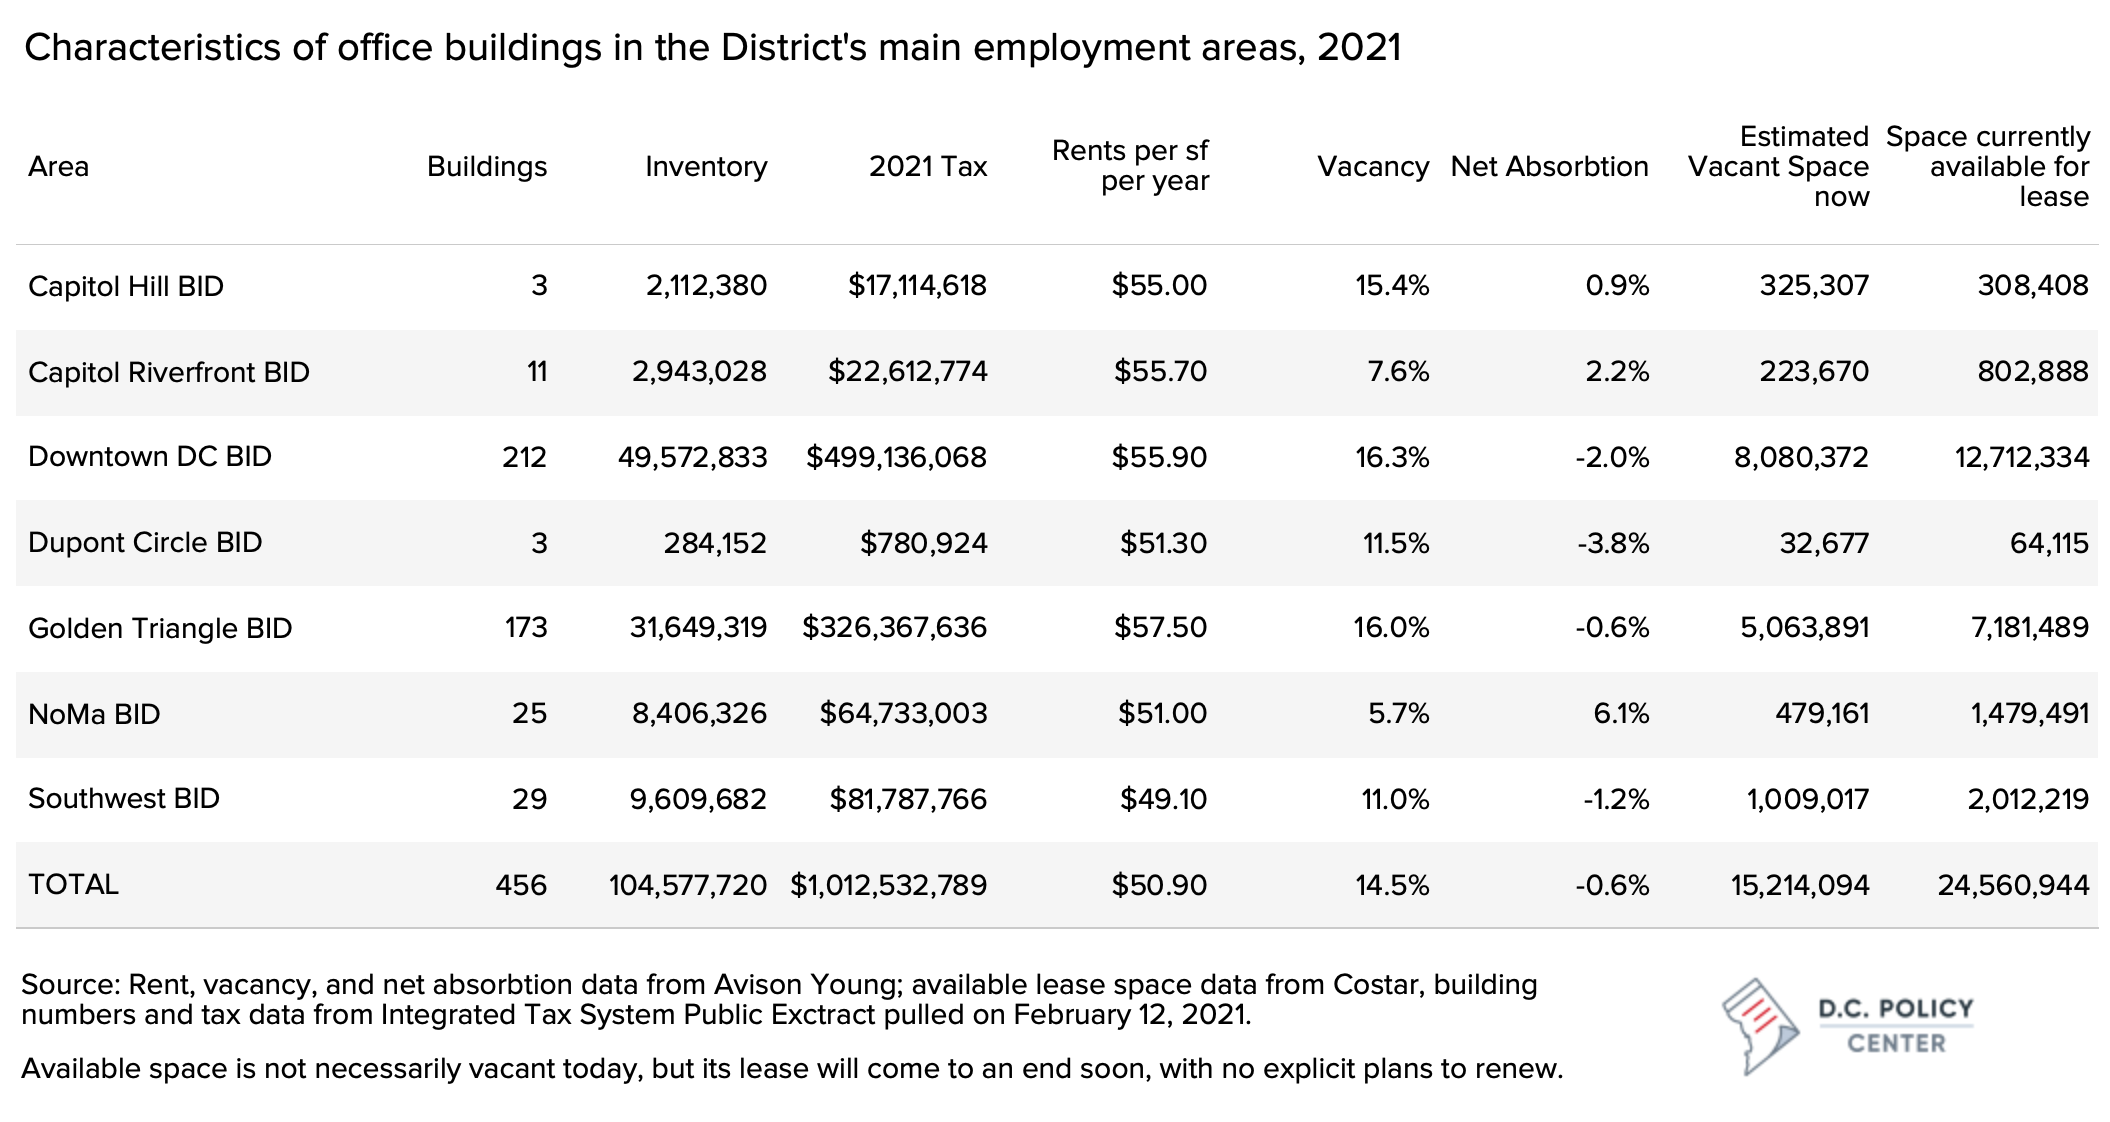
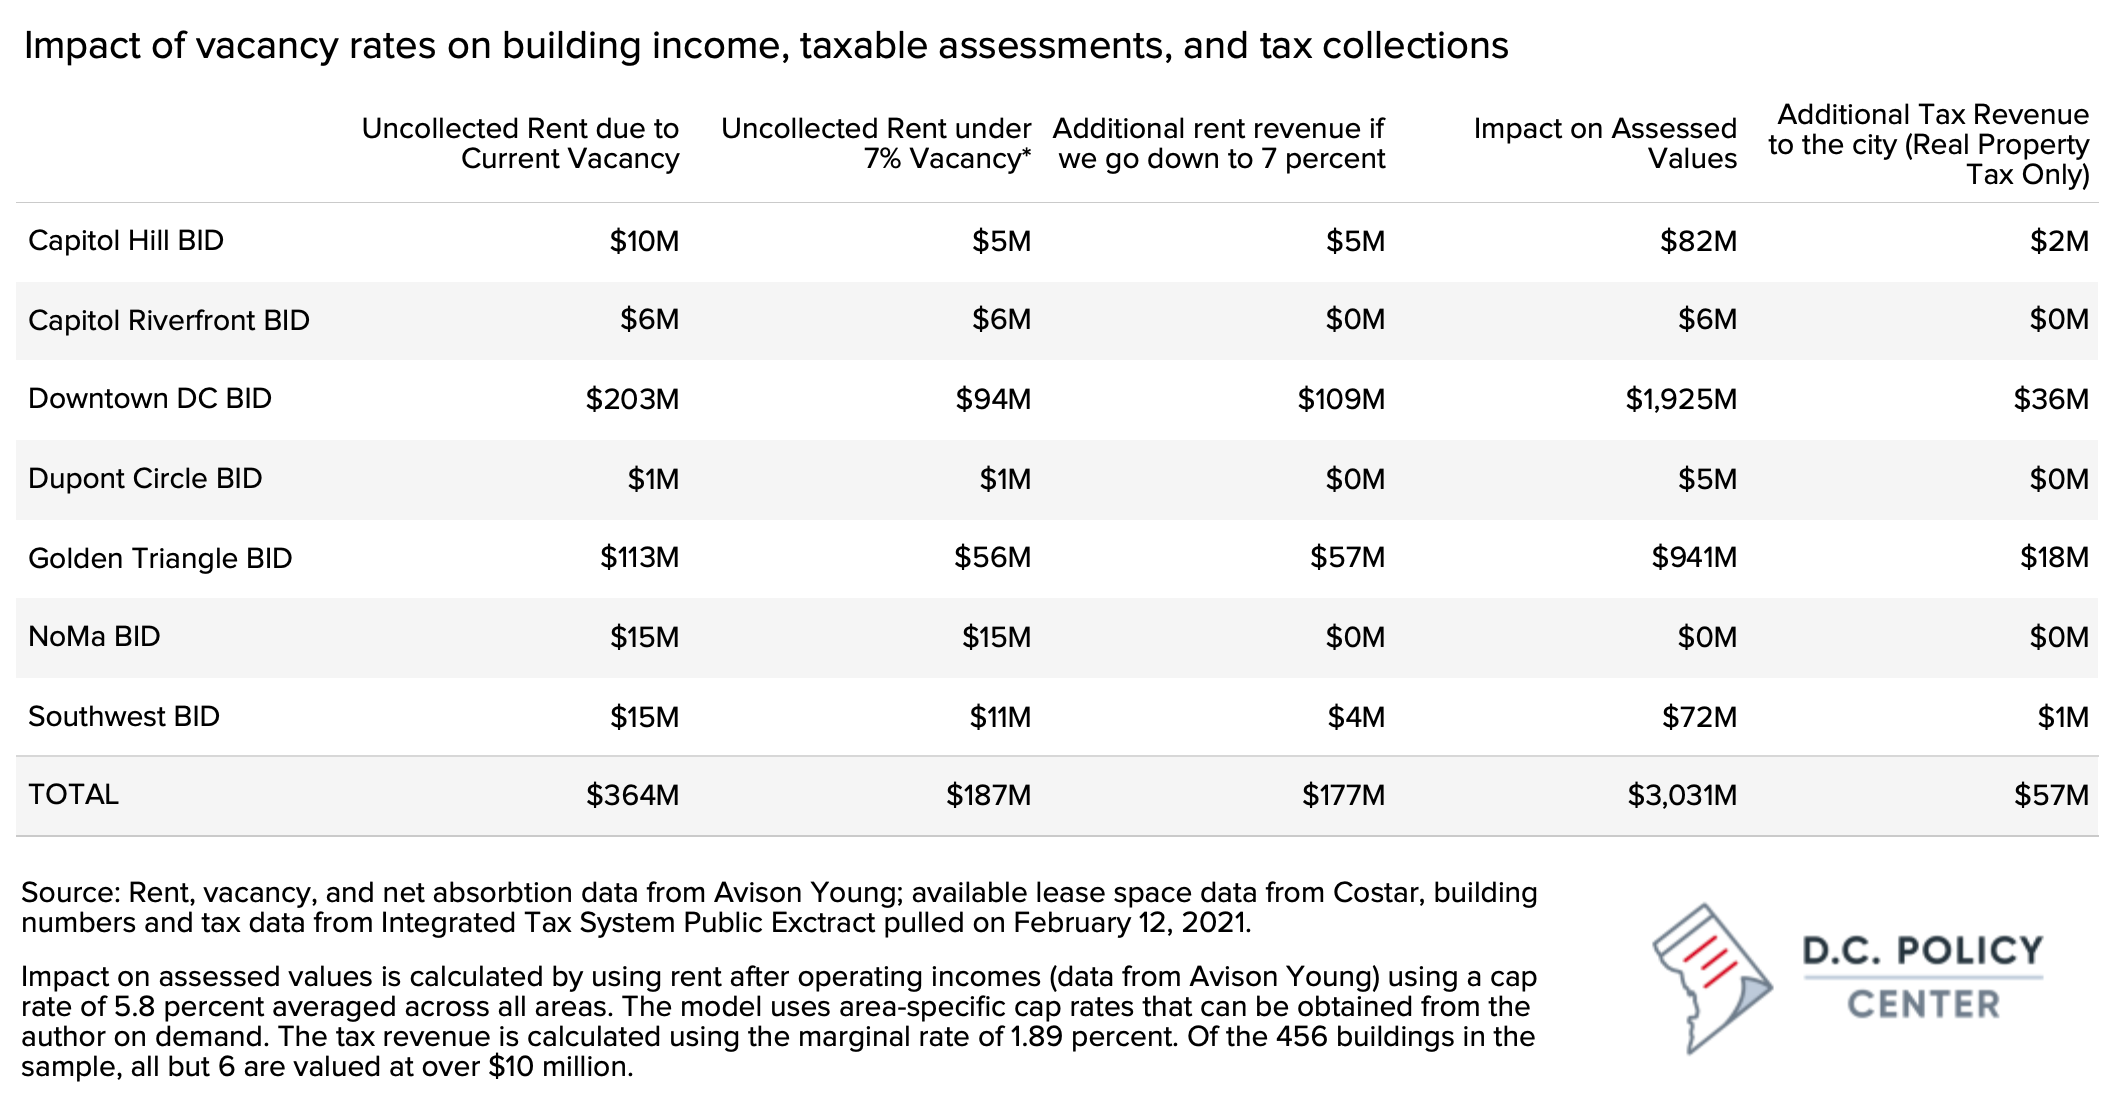
To examine this relationship, we examined commercial office buildings in the District’s central employment districts, beginning downtown and moving around the Capitol Hill, through Navy Yard and Capital Riverfront to the Southwest Waterfront. In this large arc around the federal district, tax rolls show 456 commercial buildings with 134 million square feet of office and retail space. And according to their 2021 tax bills, they will collectively pay $1 billion in real property taxes. That is more than a third of projected real property tax collections ($2.9 billion) including residential property and 12.5 percent of all local revenue ($8 billion) the city projects to collect in fiscal year 2021.
At present, the combined vacancy rate across all of these buildings is 14.5 percent. And overall, more space is being vacated than is being leased in the Downtown, Dupont Circle, Golden Triangle, and Southwest Business Improvement Areas, resulting in a negative net absorption rate across the entire area. Importantly, in the next few years, in addition to the current vacant space, an additional 9.3 million square feet of space will come up for lease renewals.[6] The signs about the future of leases and lease renewals are mixed. While many businesses in the region are planning to renew their leases and bring their employees at least a few days a week into the office, more businesses are negotiating for shorter leases, planning to reduce their footprints, or looking at less dense suburban office spaces.
If these trends take hold, barring lease activity from new tenants, they will put an upward pressure on the already-high vacancy rates. For example, if a quarter of the 9.3 million square feet of space up for renewal goes unleased, overall vacancy rates will increase to 16.5 percent. If half goes unleased, vacancy rates will increase to 18.5 percent.
The current 14.5 percent vacancy in these buildings means that each year, $364 million in rent revenue goes uncollected. Of course, no building will consistently have zero percent vacancy due to frictional vacancies. But if vacancy rates had stabilized around 7 percent by virtue of attracting new tenants, net operating incomes in these buildings (calculated using rents net of operating expenditures) would have been $177 million higher. That is the equivalent of $3 billion more in assessed values (using the current cap rates from the OCFO), and $57 million more in tax revenue.[7] This excludes additional economic activity from more commuters, such as more lunches purchased, and otherwise more money spent in D.C.
This estimate is, in fact, a conservative one because it does not incorporate the positive impact of a stronger economic environment on building valuations. If vacancies were down across the board, signaling better health in commercial buildings, cap rates—the rates at which we discount future earnings of office buildings—would also decline, boosting value (and tax collections).
The opposite is true too—and this is what the CFO’s revenue letter is warning us about. If vacancy rates were to increase across the board, building incomes would collectively decrease, putting a downward pressure on building valuations and tax collections. The worsened economic conditions would also result in higher cap rates (as they did this year for hotel properties), further dampening tax revenue.
To be clear, revitalizing a vacant downtown is not important because it would be good for the landlords’ bottom lines. First, it is important because the city’s tax revenues—which are then spent on schools, human services, and programs that support District residents—are overly dependent on the presence of a strong economic activity at employment centers. If this vibrancy is lost, the District would either be forced to cut its expenditures or shift tax collections from a base largely shouldered by the presence of commuters and tourists towards one shouldered by its residents. Second, it is important because these commercial buildings could offer a home for the city’s future businesses, creating both a more diversified business base for the District, and stronger ties to opportunities for its residents.
Riding the entrepreneurial wave
The increases in the number of establishments and business application filings are most welcome news for the District of Columbia. Turning business ideas created in the aftermath of the pandemic into wage-paying and eventually brick-and-mortar businesses would not only bring back vibrancy but could create opportunities for residents who find themselves excluded from opportunity.
Early research on the impact of the pandemic on small businesses found that closures were more common for businesses owned by entrepreneurs of color, and women- or immigrant-owned businesses. These outcomes are partly related to the findings that Black-, women-, and immigrant-owned businesses are more likely to have low profit margins, lack access to capital, and be in consumer-facing industries. These businesses are therefore more deeply impacted by the pandemic. There is now evidence that businesses located in low-income, non-white neighborhoods were less likely to benefit from the Paycheck Protection Program.
If past is prelude, many of the new business applications are by the District’s Black, Brown, women and immigrant residents. These entrepreneurs are less likely to borrow, and more likely to start their businesses with a smaller start-up capital funded by their own money. They will also be less likely to benefit from federal or local tax incentives available to businesses given their size and the structure of their businesses. To aid these entrepreneurs in successfully launching and growing their businesses, and turn them into brick-and-mortar establishments that can increase vibrancy across the city, the District could take a few simple steps that would come at relatively low costs, especially compared with the potential economic hits from a distressed downtown:
Make it simple to start a business
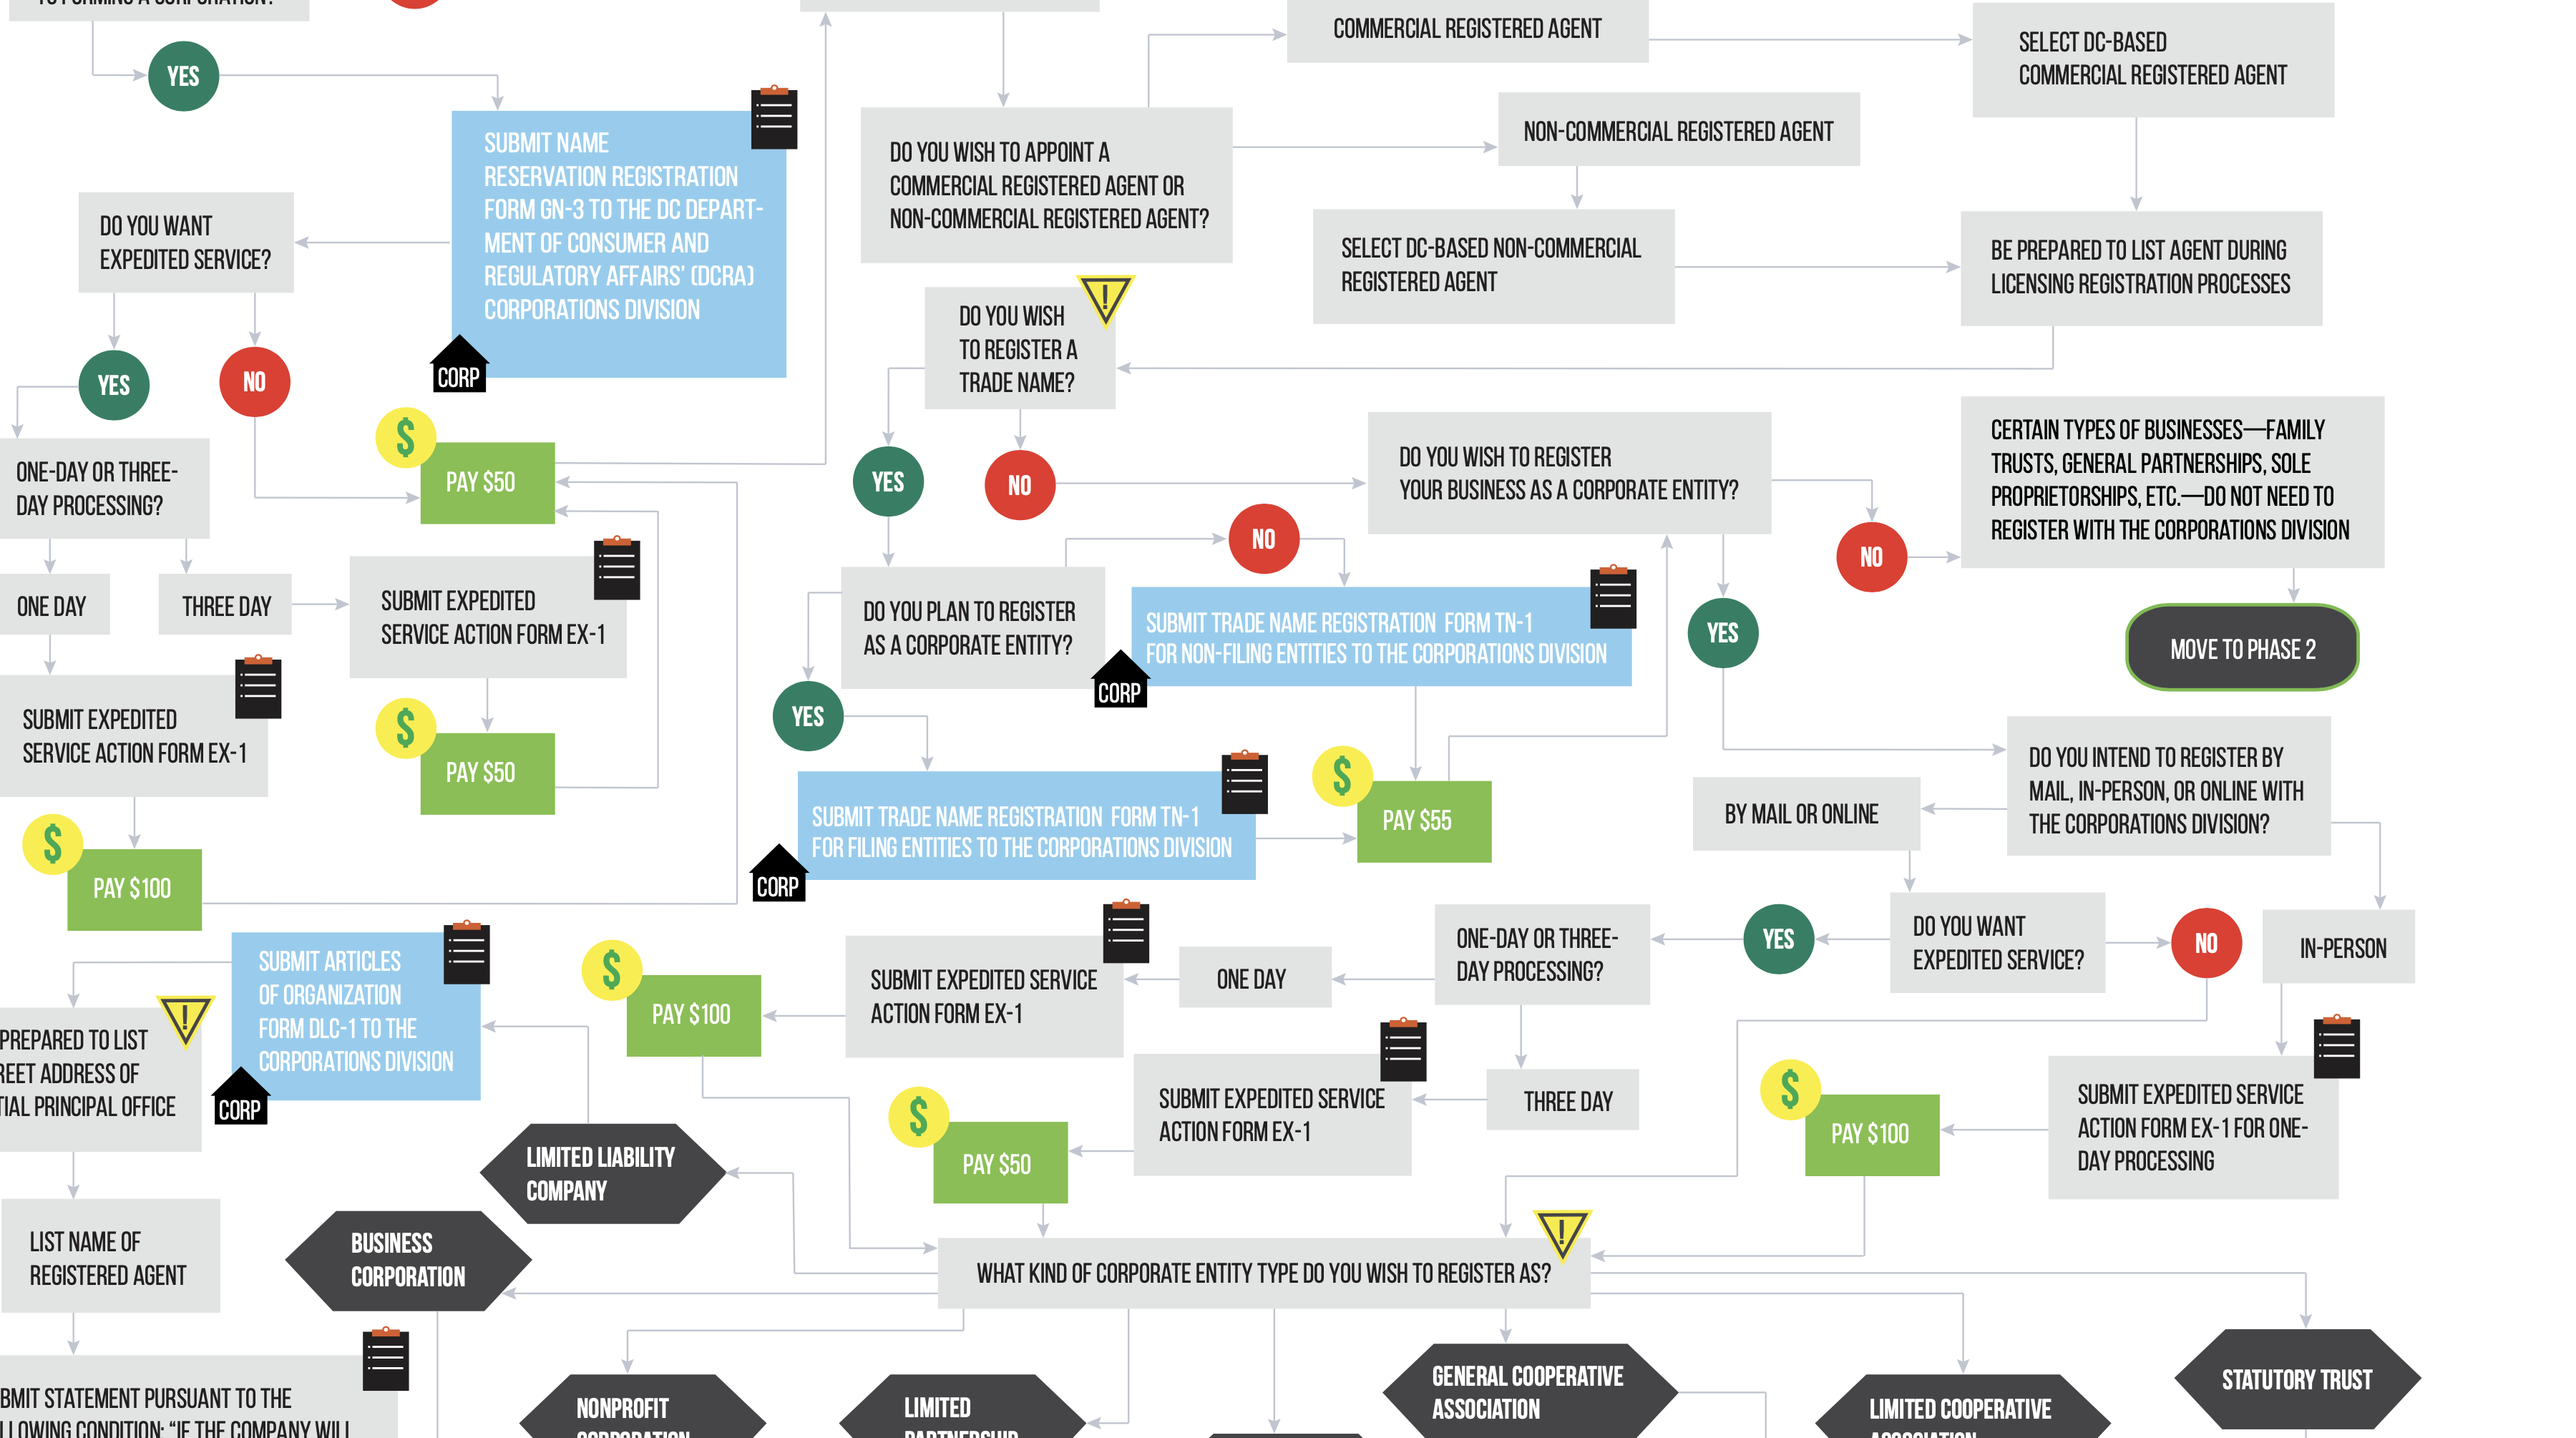
Last year, the Institute for Justice published a rather lengthy chart of all steps necessary to complete corporate registration and obtain a business license in the District of Columbia. According to the District’s Department of Consumer and Regulatory Affairs, there are eleven broad categories of business licenses with 65 different subcategories of business licenses, in addition to a separate category of regulated businesses. [8]
Research shows that business formation is stronger in places where the administrative process for starting a business is simplest. The District should take this finding to heart and create a temporary simplified business licensing system that eliminates categories by eliminating licensing categories. For most applications, the city could adopt a temporary regime where a basic business license is automatically issued when someone registers a business. In the long run, business licenses should be simplified into fewer categories, and should cost less.
Eliminate clean hands requirements
The city requires that business license applicants must sign an affidavit (known as clean hands) stating that they do not own more than $100 in fines, fees, or back taxes to the city. In practice, the city does not check applications against amounts owed to the city (other than taxes). But the requirement to sign such a statement could dissuade residents who own more than $100 in traffic fines, court fees, environmental fines, or other fees. Such burdens more heavily impact low-income residents and residents of color, and the threat of clean hands is more likely to dissuade enterprises of color from applying for a business license.
The city should increase the limit for the clean hands test from $100 to a much higher level and consider temporarily halting this requirement through the period of recovery.
Invest in information infrastructure across the entire city
By far, online retail has been the fastest growing component of new businesses and new business applications. On this front, the pandemic has operated as a leveler as it has reduced the dependence of retail on access to high-value storefronts. The success of such remote businesses depends on access to reliable and high capacity internet access, as we have observed how the digital divide amplified racial inequities when schools switched to online learning in the spring of 2020. Making high quality high-capacity internet available free or at low cost to every District resident who would otherwise not be able to pay for such access can greatly help business startups especially in less resourced parts of the city.
Support turning online businesses into brick-and-mortar businesses
With increased vacancies in the city’s key employment centers, there is an opportunity to provide cheaper office and retail space for a more diversified set of businesses. The District could offer incentives for new businesses to take space in vacant office buildings or encourage landlords to provide such space. This could be done in the form of rent subsidies, tax incentives, or even a program whereby the city chips in for a portion of the rent for startups that have a commitment to stay in the city.
The economic future of the District of Columbia depends upon the return of a strong demand for urban amenities. The increased entrepreneurial activity combined with the need to fill empty office buildings offer the District s a unique opportunity to create economic vibrancy with a more diversified business base. The District can either ride this current entrepreneurial wave by doing away with its burdensome regulatory regimes, or it could watch it crush with more residents finding it harder to survive in the city.
