
The Washington metropolitan area is one of the top regions in the country for entrepreneurship, but within the metropolitan area, jurisdictions experience different outcomes. The decisions they make affect the flow of businesses, workers, and residents across their borders, and these forces are constantly shifting: The District has seen significant economic and residential growth in recent years. At the same time, the dynamics of the metropolitan area—and D.C.’s place within it—have changed over time, moving jobs and people out beyond the core counties of the metropolitan area and altering the relative power of D.C. and its suburbs and exurbs.
The viability and longevity of business establishments depend heavily on broader economic conditions, but the regulatory and fiscal environment in a jurisdiction, which is shaped by that jurisdiction’s government institutions, can be of enormous significance for business performance. Government policy—both fiscal and regulatory—can make it easy or difficult to start a business, sustain a business, and grow a business. Comparing these factors across jurisdictions in the Washington metropolitan area shows that despite its relative success, the District has significant room for improvement.
Business growth
Among the jurisdictions that make up the region, the District of Columbia houses the greatest number of business establishments within the Washington metropolitan area. In 2018, D.C. had 39,399 establishments, ahead of other core business centers such as Fairfax County and Montgomery County.[1] This has been due to the District’s strong performance in increasing its number of net new establishments since 2010: During that period, the number of establishments grew by 5,012 (15 percent). D.C. was particularly strong in adding new establishments in professional and business services, the core strength of the region. The District was also strong in adding new establishments in education and health services, as well as in “other services,” a category which includes personal services and non-profits.
Figure 1 – Net new start-ups across Washington metropolitan area jurisdictions, 2010 to 2018
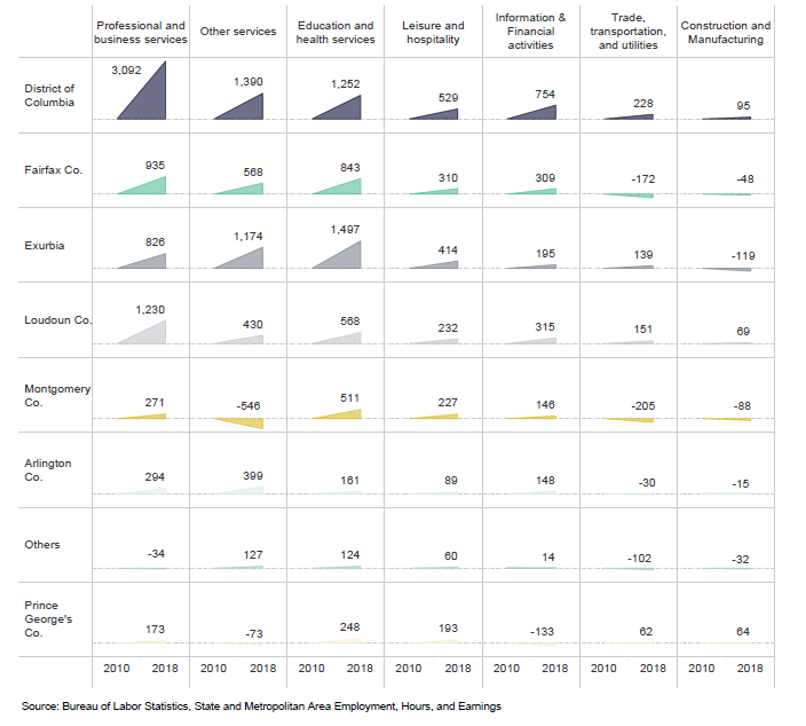
However, the District is not the strongest performer in the region when it comes to the rate of establishment growth. That distinction belongs to Loudoun County, which added 3,300 net new establishments during the same period—on par with the much larger Fairfax County. Given its low starting point, this meant a growth rate of over 36 percent, or more than twice the rate of the second-best performers, D.C. and Arlington.
Exurban counties showed strong growth, too, as most new establishments have been following the strong population growth in the outer jurisdictions of the metropolitan area. Both Loudoun and other parts of exurbia built their strength on net new start-ups in professional and business services, becoming important contenders for competing with the region’s core urban employment centers.
The weakest performer in overall establishment growth—including establishment births, deaths, and in-migration—was Montgomery County, which added just 323 net new establishments during the same nine-year period (1 percent growth), mostly due to its tepid establishment growth since 2015. The second-weakest performer, Prince George’s County, added 529 establishments on net (3.5 percent growth).
Survival rates
Many factors play a role in business survival, including the quality of the business plan, management capability and performance, the broader business cycle and economic conditions that shape demand, as well as access to credit and investments and tax and regulatory changes that can impact costs, productivity, and ultimately profitability.
Across the Washington metropolitan region, establishments operate under similar economic conditions. As such, survival rates[2] of establishments, when broken down by jurisdiction, are relatively close—within five to eight percentage points of each other over the first five years. Yet, jurisdictional differences persist—and, in some cases, increase over time.
In the District of Columbia, the five-year survival rate for establishments that first began their operations between 1990 and 1994 was 76 percent, on average, but improved over time. For the cohort that began operations after 2010, the average five-year survival rate was 81 percent.[3] Still, D.C. consistently has lagged behind Fairfax, Loudoun, and Arlington counties, and its performance was similar to that of Montgomery County (and better than Prince George’s County).
Taking the longer-term view, D.C.’s 10-year business survival rates have ranged from 58 percent for the cohort that started operations between 2000 and 2005 to 55 percent for the cohort that started operations between 2005 and 2009, when the Great Recession hit the economy. The District’s performance here has been slightly worse than Fairfax and Montgomery counties, except for establishments that hit their 10-year mark during the Great Recession. Loudoun County really begins to shine at the 10-year range, with survival rates that are more than 10 percentage points higher than other jurisdictions in the region. Prince George’s County, on the other hand, showed a much weaker performance in this range. These differences have compounded into a much higher establishment formation rate in Loudoun County, as shown elsewhere in this report.
Figure 2 – Business survival rates in key employment centers in the Washington metropolitan area
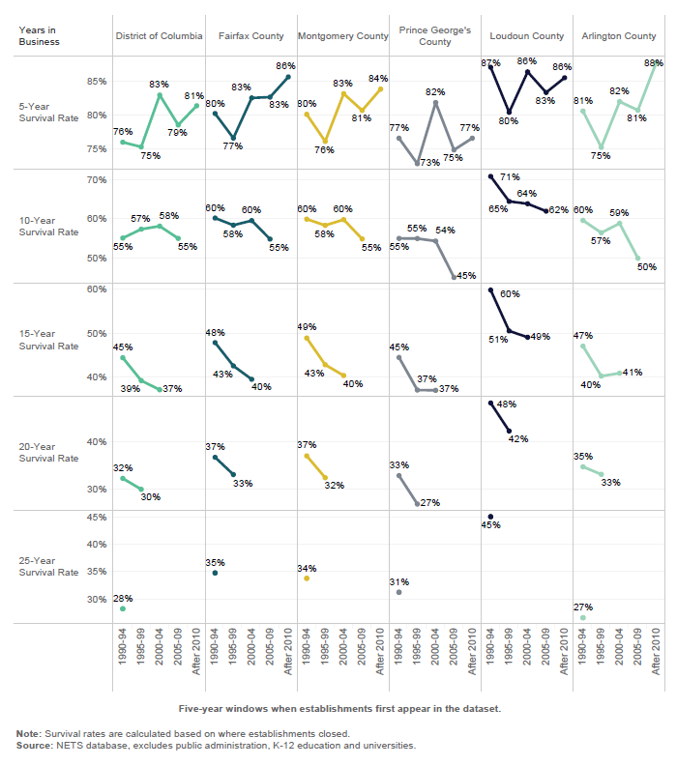
D.C. establishments’ survival rates after 15 and 20 years are consistently below regional rates, though not as low as Prince George’s County. For every 100 establishments that began their operations between 2000 and 2004 in the District of Columbia, 37 were still in operation after 15 years. The comparable numbers are 40 in Fairfax and Montgomery counties, 41 in Arlington, and 49 in Loudoun County. These gaps hold for 20-year survival rates as well.
Barriers to profitability
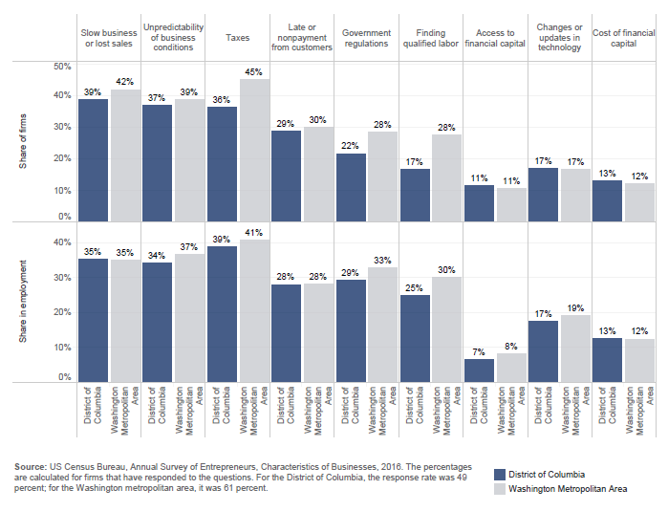
It is very difficult to measure how jurisdictional policies shape the entrepreneurial landscape since policy decisions are largely dependent on economic conditions. In these cases, the perceptions of business owners can be enlightening. The U.S. Census Bureau’s Annual Survey of Entrepreneurs asks firms about the factors that most negatively impact their profitability. The most recent data from 2016 show that the top factors that D.C. firms report as negatively affecting their profitability are taxes, slow business or lost sales, and unpredictability of business conditions.
Entrepreneurs’ responses to this question of barriers to profitability highlight the importance of economic conditions. The most frequently mentioned barrier among the District’s business owners is slow business or lost sales: 39 percent of all establishments that responded to this question in the District of Columbia mention broader economic conditions as a concern. This is followed by “unpredictability,” which can reflect both economic conditions and policy actions. Taxes are the third most frequent concern, mentioned by 37 percent of businesses that responded to the question.
Larger firms are more likely than small firms to cite regulations and finding qualified labor as harming profitability. Firms of all sizes say late payment or nonpayment from customers has negative effects. Small firms are more likely to say a lack of access to financial capital has harmed their profitability—about one in nine firms (11.4 percent) say this has had a negative impact, but these establishments collectively hire only one in 15 employees (6.6 percent).
Across the metropolitan area, businesses mention similar concerns, but more frequently. Some 45 percent of regional firms see taxes as a negative impact on profitability compared to 36 percent within the District. This is not necessarily an indication of the differential tax burdens on businesses, as it could also be a reflection of the types of firms that have responded to the survey questions: The average D.C. firm in this sample had 23 employees compared to 17 for the average metropolitan area firm, and D.C. firms paid higher average salaries ($78,000) than firms across the entire metropolitan area ($64,000).
Business climate unpredictability
As discussed above, unpredictability of business conditions is one of the most highly cited concerns for profitability among D.C. firms, with 37 percent of firms (representing 34 percent of D.C.’s private employment) reporting this has a negative impact. A slightly lower share of firms report the same in the rest of the metropolitan area (39 percent of firms, representing 37 percent of employment), although it is still a broadly-shared issue across jurisdictions. Business climate unpredictability can take the form of whether new taxes, regulations, or other requirements will be enacted, and whether and how they will be implemented.
Figure 3 – Negative impacts on profitability reported by establishments in D.C. and the rest of the Washington metropolitan area
Other types of unpredictability can also play larger roles in different industry sectors. In real estate, for instance, the combination of regulatory requirements, zoning restrictions, and legal challenges often leads to a high degree of uncertainty and delay, increasing the overall cost of new housing and other developments. The total impact of regulatory burdens represents roughly a quarter of the average price of newly built single-family homes, according to estimates by the National Association of Home Builders.
Taxes
Research generally finds that in explaining economic growth, overall economic conditions, federal tax policy, and the availability of strong public services play a much larger role than a jurisdiction’s tax regime, specifically when considering corporate taxes at the state level.[4]
Yet there is also increasing consensus that local tax regimes and regulatory environment play a stronger role in intra-jurisdictional competition. In other words, while broader economic conditions have a greater overall impact on a jurisdiction’s economic growth than changes to the local tax code, tax and regulatory differences between jurisdictions within a single metropolitan area—such as between D.C. and Fairfax, or between Arlington and Montgomery County—may have a noticeable effect on where businesses locate and the relative extent of their growth in those areas.
Taxes on businesses in the District of Columbia tend to be higher than taxes in surrounding jurisdictions. Tax differentials are especially large for commercial property taxes. Taxes the District of Columbia are 5.7 percent of total value added in the city, according to one report. Of this amount, property taxes account for the largest share at 2.21 percent of all value added. D.C. is the only jurisdiction in the region with a commercial property tax regime different from its residential property tax regime.[5]
Equally important is the frequency with which commercial property tax rates have been changed in recent years.[6] Since the beginning of 2018, the District has adjusted its commercial property tax regime multiple times.[7] As much of commercial space is leased through agreements that pass on any increases in property taxes to tenants, this has been a source of uncertainty (and cost) for business establishments of all sizes and kinds. At the same time, D.C. also enacted a variety of property tax breaks to selected entities through individual tax abatements. In fact, while many other business tax incentives have received much attention, the biggest source of incentives for businesses in the District of Columbia are individual tax abatements.
Figure 4 – How tax rates compare across the Washington region
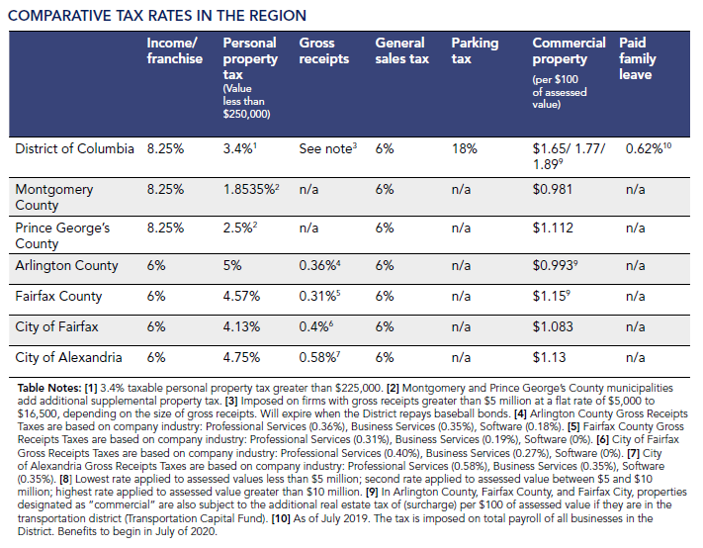
In the last two years, the city has also increased general sales taxes and sales taxes on hotel rooms, imposed a new gross receipts taxes on car-sharing companies, increased deed taxes on high-value transactions, added new surcharges on electricity and gas consumption, and enacted a 0.62 percent payroll tax for paid family leave.
This article is adapted from Building a competitive city: Strengths, weaknesses, and potential paths of growth for the District of Columbia.