Results from D.C.’s 2021-22 statewide PARCC assessment show declines in both English language arts (ELA) and math since the last time the test was administered in 2018-19. ELA proficiency declined from 37 percent to 31 percent (6 percentage points), and math proficiency declined from 31 percent to 19 percent (12 percentage points).
Two major factors have happened between 2022 and 2019 that could account for these losses. First, pandemic-related school closures and a year of virtual learning have had negative impacts on both learning and student well-being.1 During this same period, the system also saw significant enrollment shifts due to a combination of fewer births and lower demand for living in D.C. and attending its public schools. Enrollment in pre-kindergarten through grade 12 stopped growing for the first time in at least over a decade, with pre-kindergarten and elementary enrollment starting to decline.2
But how did learning outcomes change for a cohort of students as they moved from lower to upper grades? Generally, we would like to see an upward trend in learning outcomes, with more students meeting or exceeding expectations as they move to upper grades.
To take a closer look, we compared PARCC results and enrollment for elementary school students (grades 3, 4, and 5) to middle school students (grades 6, 7, and 8) three years later to answer two questions: First, have student cohorts experienced learning gains during the pandemic years (comparing school year 2018-19 to 2021-22) that were similar to pre-pandemic patterns (school years 2014-15 to 2017-18 and school years 2015-16 to 2018-19)? And what do we know about how enrollment in this cohort has changed over time?
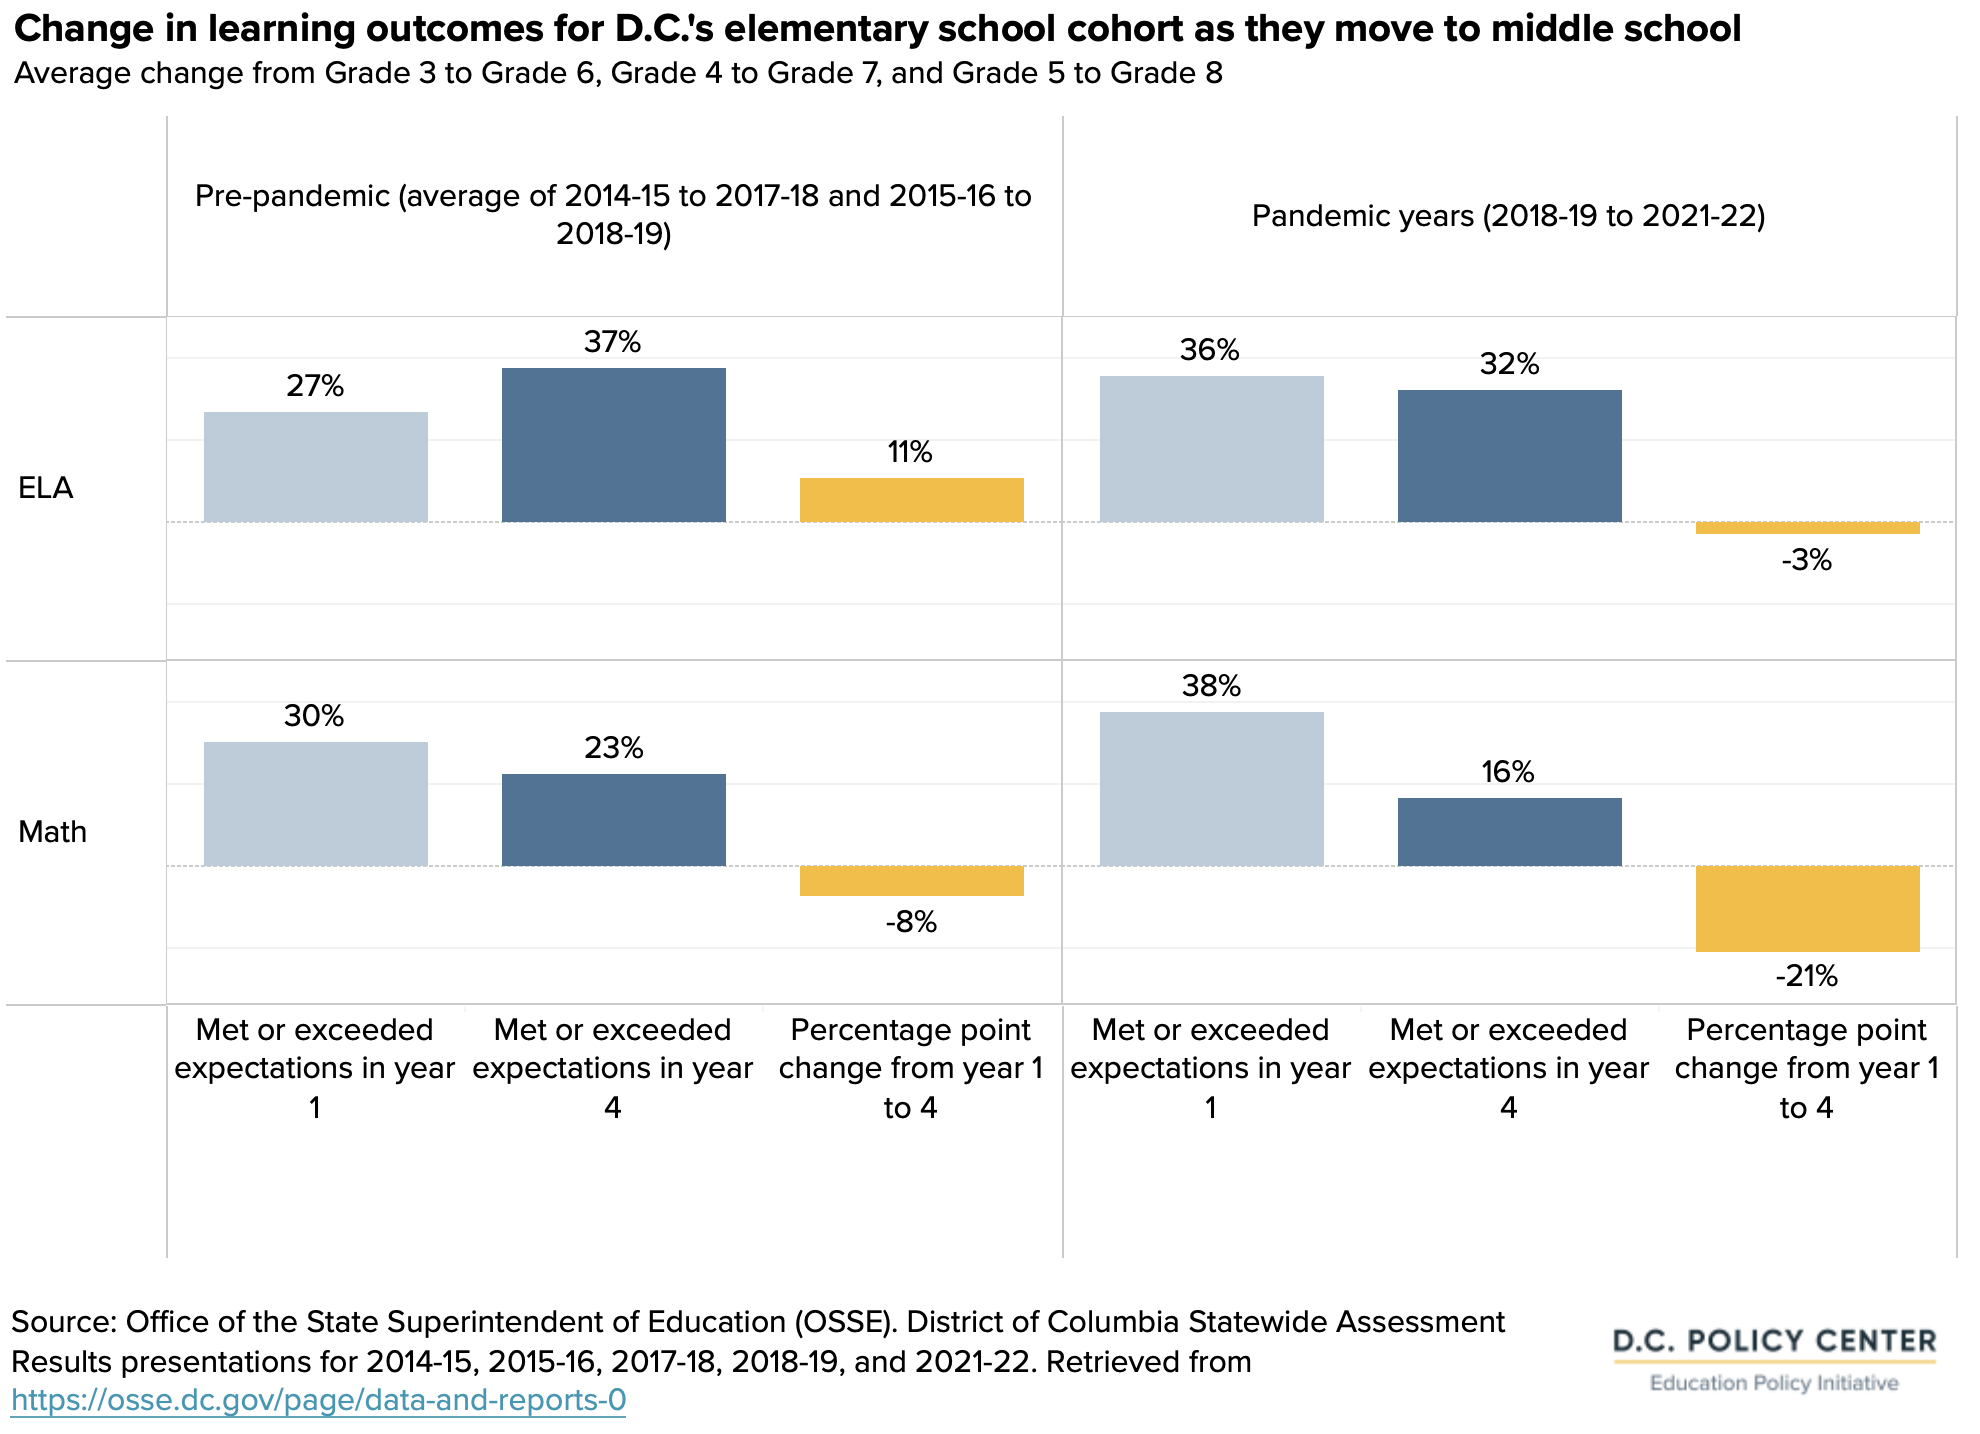
Changes from elementary to middle school
Before the pandemic, when students moved from elementary to middle school over a three-year period, their learning outcomes improved, on average, 11 percentage points in ELA, but declined on average 8 percentage points in math. After the pandemic, progress in both subjects weakened for the same cohort. The percentage of students meeting or exceeding expectations decreased by 3 percentage points in ELA (the opposite of the gains experienced by previous cohorts) and decreased by 21 percentage points in math (a steeper decrease than pre-pandemic).
Are these changes partly shaped by demographic shifts? We found that amidst this decline in learning outcomes, the student population has become smaller than usual, but not shifted that much at least by race and ethnicity. From school year 2018-19 to school year 2021-22, this student cohort shrank by 12 percent as the elementary school students (in tested grades 3, 4, and 5 only) became middle school students (in grades 6, 7, and 8). During this same transition before the pandemic, 8 percent of these elementary school students would leave before middle school, meaning it is a 4 percentage point increase in those who leave.3
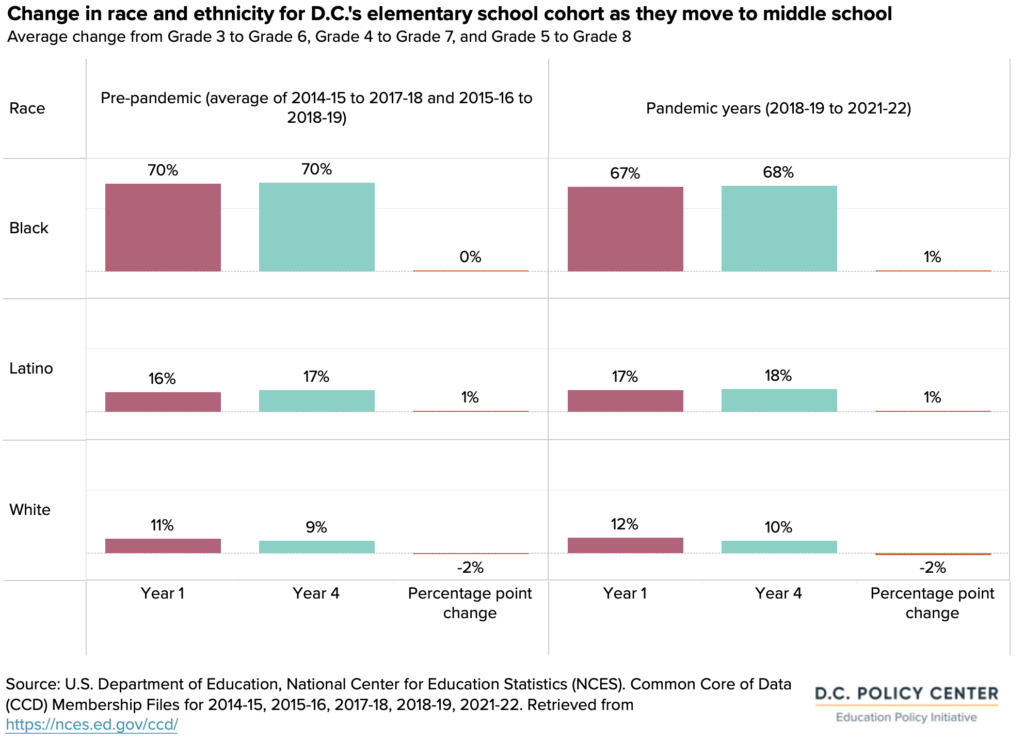
By race and ethnicity, the composition of elementary school students shifted by middle school during the pandemic to be 68 percent Black (1 percentage point increase), 18 percent Latino (1 percentage point increase) and 10 percent white (2 percentage point decrease. This is similar to shifts before the pandemic, meaning that there wasn’t a huge exodus of one race or ethnicity during the pandemic.
This is a look at the publicly available data. The Office of the State Superintendent of Education (OSSE) has looked at student-level data for those who were tested in both years, and found that students were less likely to remain or become proficient during the pandemic than in previous years in both ELA and math. 4
Endnotes
- D.C. Policy Center. 2022. State of D.C. Schools, 2021-22. D.C. Policy Center. Retrieved from https://www.dcpolicycenter.org/publications/state-of-dc-schools-20-21/
- Coffin, C. and Rubin, J. 2022. Declining births and lower demand: Charting the future of public school enrollment in D.C. D.C. Policy Center. Retrieved from https://www.dcpolicycenter.org/publications/enrollment-decline/
- U.S. Department of Education, National Center for Education Statistics (NCES). Common Core of Data (CCD) Membership Files for 2014-15, 2015-16, 2017-18, 2018-19, 2021-22. Retrieved from https://nces.ed.gov/ccd/
- Office of the State Superintendent of Education (OSSE). 2022. 2021-22 District of Columbia Statewide Assessment Results Presentation. Retrieved from https://osse.dc.gov/sites/default/files/dc/sites/osse/page_content/attachments/2021-22%20District%20of%20Columbia%20Statewide%20Assessment%20Results%20Presentation.pdf