
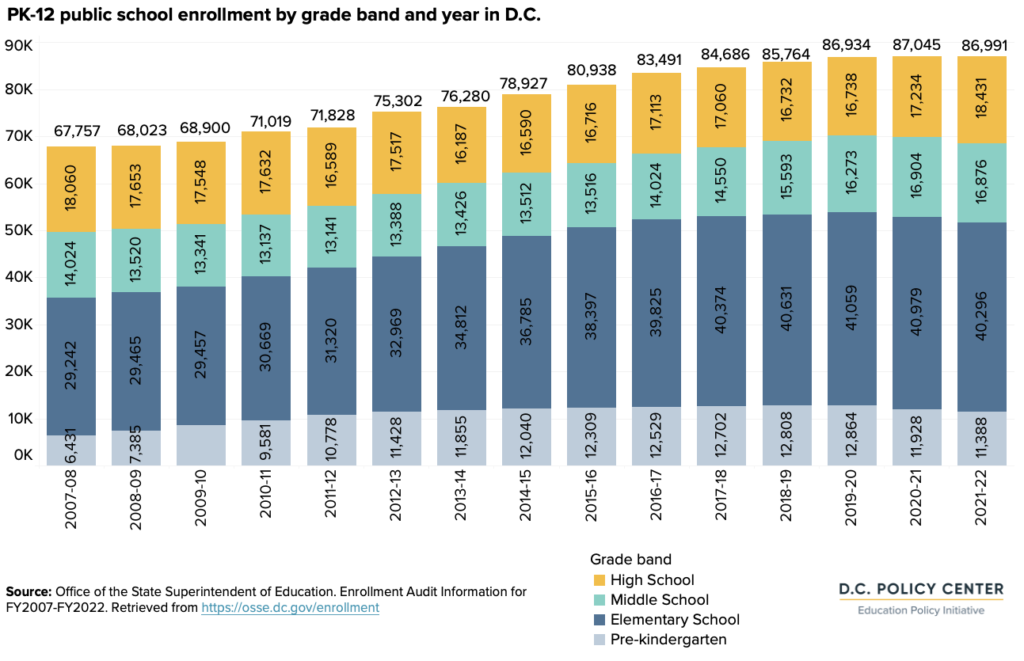
After years of increases, enrollment growth in D.C.’s public schools (DCPS and public charter) has stagnated, and in early grades, even declined. Between school years 2007-08 and 2019-20, D.C.’s public schools added an average of 1,598 students per year. In school years 2020-21 and 2021-22, enrollment increased by an average of just 29 students.
In this report, we look at the two main drivers of enrollment growth: (1) Births in D.C. and (2) The preference for families to live in D.C. and choose its public schools. The number of babies born to D.C. residents has been declining since 2016. This decline, together with a higher outmigration of adults of the most likely childbearing age (25-34) and a lower fertility rate for women in D.C., indicate that the District will have a smaller overall base of children who will later attend public schools. The second driver of enrollment, families’ preferences for living in D.C. and attending its public schools, has experienced shocks due to the pandemic. Fewer babies who were born in D.C. later enroll in pre-kindergarten and kindergarten compared to previous years, and the pandemic shifted families’ priorities when deciding on schooling options for their children.
The combination of these two drivers—pre-pandemic trends in lower births and pandemic-induced changes in demand for living in D.C. and attending its public schools—has contributed to lower enrollment growth in D.C.’s public schools. Initially, the decrease in enrollment will be felt most in younger grades as smaller birth cohorts age into elementary school, and the larger classes of years past move up to middle and high school. However, over time, D.C. can expect total enrollment levels that may remain close to pre-pandemic levels or be lower, instead of continuing to grow.
D.C.’s public schools are accustomed to growing enrollment. If enrollment growth remains tepid or reverses, there could be significant implications for school budgets, facilities planning, and school openings, for both District of Columbia Public Schools (DCPS) and public charter schools. It is therefore important to understand the drivers of this enrollment decline early, and what this might mean for the future of public school enrollment in the District of Columbia.
Other publications in this series:
Quick links
Executive summary
Two full school years have passed since the beginning of the COVID-19 pandemic. During this time, enrollment in D.C.’s public schools has remained flat. Between school years 2007-08 and 2019-20, D.C.’s public schools (DCPS and charters combined) added 19,177 students in pre-kindergarten through grade 12, an average of 1,598 students per year. In school years 2020-21 and 2021-22, enrollment growth weakened, with an average increase of just 29 students per year. During these two school years, enrollment continued to grow in middle and high school grades, mostly because of larger cohorts aging up. But enrollment decreased in pre-kindergarten and elementary grades. These smaller cohorts in early grades mean a weaker foundation for future enrollment growth.
What explains these shifts in enrollment trends? And how permanent are these shifts? To answer these questions, this report explores the two main drivers of enrollment growth:
- The number of births to D.C. residents, and
- Cohort retention ratios: how many students choose public school over time.
Multiple sources of data suggest that both drivers have weakened—due partly to decisions that D.C. residents made prior to the pandemic, and partly to decisions that can be tied to the pandemic. Many of these decisions—the decision to have a child, move in or out of the District of Columbia, or choose a D.C. public school over other options (private school, homeschooling, or a school outside of the city)—have persistent impacts on enrollment that cannot be easily undone. This means enrollment growth is not likely to return in the years immediately following the pandemic.
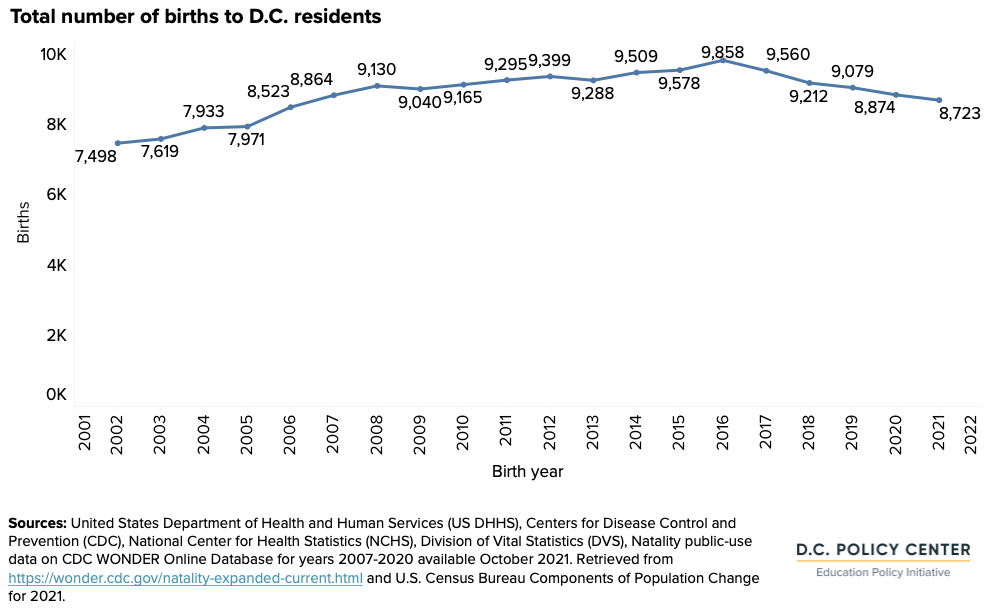
First, the number of births to D.C. residents, which serves as the foundation of the size of the District’s school-aged population, has been on the decline since 2017. This means that the cohorts now in pre-kindergarten are already smaller than the cohorts that preceded them. Births peaked in 2016 at 9,858 births per year, and have declined, on average, by 2.3 percent every year, falling to 8,723 births in 2021.
Births are declining because there are now fewer women in D.C. who are of the likely childbearing age, and because women of this age group are having fewer children than in the past. Since 2015, women aged 25 to 34 have been leaving the city in greater numbers than other age and gender cohorts. Likewise, since 2008, the fertility rate for those who have stayed has decreased by 23 percent. Even though this decline in births began before the COVID-19 pandemic, its impacts on enrollment have taken effect during the pandemic—the time when this youngest and smaller than usual cohort started schooling.
Second, cohort retention ratios have been on the decline, suggesting that demand for D.C.’s public schools has weakened. Retention ratios are higher when more children who were born in the District attend District’s public schools, or more families move to the District and send their children to public schools. Unfortunately, the opposite has been happening, largely driven by the impact the pandemic has had on families’ decisions.
Outflows, including students choosing other school options or moving out of D.C., have increased since school year 2019-20. Some students may have left public schools for private, homeschool, or other options if they preferred virtual instruction due to convenience or COVID-19 concerns (especially for younger learners). Others may have opted out of public schools because they preferred in-person schools during a time when all D.C. public schools were offering mainly virtual learning. Families who moved out of D.C. entirely were likely motivated by factors like the flexibility of telework or a search for bigger homes, among other reasons. Data suggest that these factors played a strong role in cohort retention ratios for early grades, which decreased for pre-kindergarteners and elementary schoolers by 4 or more percentage points during the pandemic.
If these trends continue, enrollment in school year 2026-27 could be as low as 81,000—that is, 6,000 fewer students than in school year 2021-22.
Half of this loss is driven by declining births—which will continue to depress pre-kindergarten and elementary enrollment in future years. This loss can largely be made up if retention returns to pre-pandemic levels (that is, if families who left return to D.C. and return to public schools). But to keep growing at historical rates and compensate for the 2.3 percent annual decrease in births, retention ratios must increase by 2.1 percentage points a year. D.C. has not seen such retention ratios for more than a decade.
Absent such a significant increase in cohort retention ratios, births would need to return to 2016 levels for enrollment trends to revert back to the pre-pandemic trend, a highly unlikely prospect given the District’s demographic profile.
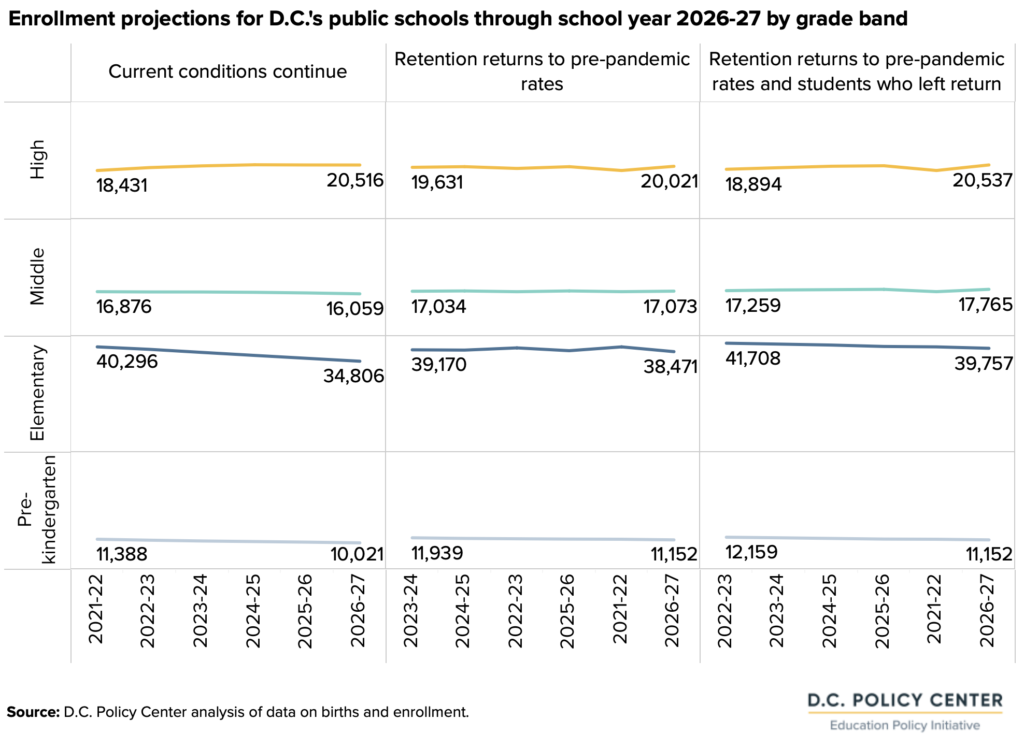
An enrollment decline of this magnitude would have significant implications for D.C.’s public schools. Enrollment of 6,000 fewer students over the next five years is equivalent to about 16 schools’ enrollment, based on the average size of all schools. If retention and births do not increase, smaller enrollments will first affect pre-kindergarten and elementary grades with a 13 percent decrease through school year 2026-27. During this time, decreased enrollments will not immediately have an impact on middle and high school grades, which will see an increase of 4 percent to enrollment.
Part 1: Motivation for this study
Before the COVID-19 pandemic, robust enrollment increases in the District of Columbia’s public schools[1]— driven by high birth rates and increased cohort retention—had been the norm.[2] Between school years 2007-08 and 2019-20, D.C.’s public schools added 19,177 students in pre-kindergarten through grade 12, or an average of 1,598 students per year.[3] Beginning in school year 2020-21, enrollment growth slowed dramatically, with an average increase of just 29 students per year.
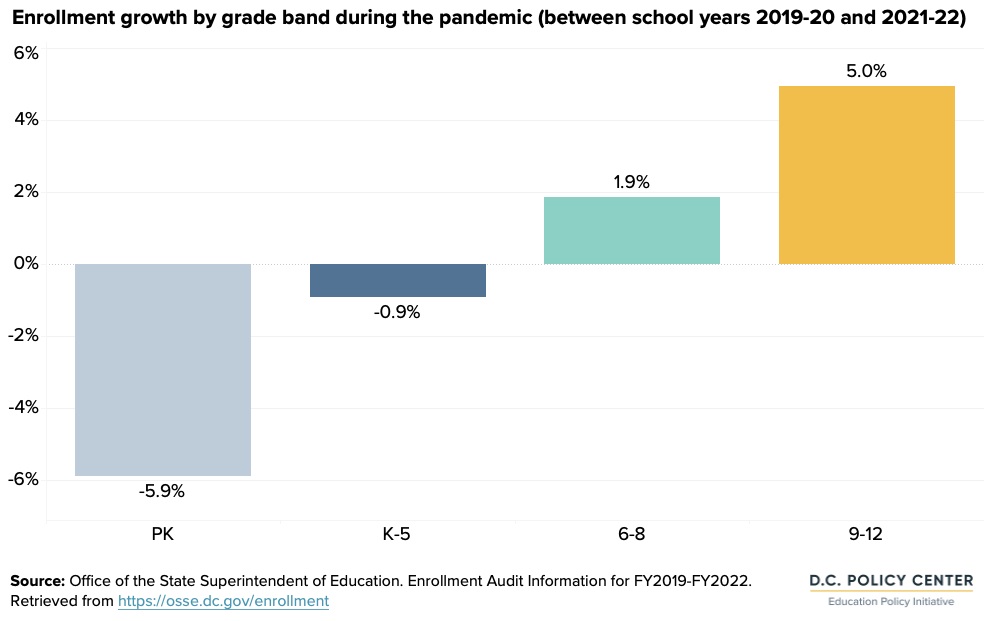
Since the onset of the COVID-19 pandemic, two full school years have passed. During this time, enrollment continued to grow in middle and high school grades (by 1.9 percent and 5 percent, respectively). This growth is partly a result of larger cohorts aging up, and partly because fewer students dropped out of school—a result of the relaxed high school requirements in necessary to match the realities of virtual learning, with academic and attendance requirements pushing fewer students out.[4] Enrollment in pre-kindergarten and elementary grades, on the other hand, decreased by 5.9 percent and 0.9 percent, respectively, due to the combination of declining births to D.C. residents and weaker preferences for living in D.C. and choosing its public schools.
Because declines in births started in 2017, in school year 2021-22, pre-kindergarten enrollment was the only level impacted by fewer births. But there were three other factors—largely pandemic-related—in play that likely put negative pressure on demand for public school in D.C. across all grades.
First, some families have moved out of D.C. due to economic shocks during the pandemic, the need to be closer to family members, the desire for a larger home with remote work, or other reasons.
Second, virtual, and in other cases, in-person offerings decreased demand for public schools at times. Some families, especially Black and Latino families, indicated a stronger preference for virtual learning given health concerns. This group may have sought other options when schools returned to in-person learning. Other families, predominantly families of white students, tended to prefer in-person learning over virtual. Likewise, this group may have looked for in-person alternatives when schools were virtual.[5] These decisions to move houses or change schools tend to be sticky, and may remain in place even after health or learning conditions had changed.
Third, demand may have been particularly low for noncompulsory pre-kindergarten grades. With virtual learning particularly challenging for some younger students, and in-person learning considered too risky for some, especially without a vaccine available, these youngest learners may have opted out of school entirely.
Long-term growth in public school enrollment generally goes hand in hand with faster growth in earlier grades, which later translates into future higher enrollment in later grades. Reversal of this trend—the decline in enrollment in early grades—likely signals a future general decline in enrollment.[6]
D.C.’s public schools are accustomed to growing enrollment, which has been shaping budgets and future plans for adding seats. If enrollment growth remains tepid or reverses, there could be significant implications for school budgets, facilities planning, and school openings, for both District of Columbia Public Schools (DCPS) and public charter schools. It is, therefore, important to understand the drivers of this enrollment decline early, and what it might mean for the future of public school enrollment in the District of Columbia.
This report examines the factors that may have contributed to stagnant enrollment, taking a close look at declining births as a result of decisions in the past, as well as changing migration and school preferences that were impacted more directly by the pandemic. It finds that the years of steady enrollment growth are unlikely to return to D.C. unless both births and retention increase.
Part 2: Drivers of enrollment
In any public school system, two key factors influencing enrollment are the size of the school-aged population and the preference for public schools. In a closed system with no migration and only public schools, births are the major determinant of future enrollment. In an open system like D.C., with migration in and out of the city and a wide array of private school options, flows of students to other jurisdictions and to private schools matter as well.
The strength of these influences can be measured by looking at two drivers:
- Number of births, which provides an idea of the enrollment base; and
- Retention, which shows how many children stay in public schools and D.C. over time.
Until recently in D.C., both of these indicators were strong, fueling significant enrollment growth. But these drivers now appear to be weakening significantly.
Base for enrollment: Births
Before the pandemic, births to D.C. residents had been increasing steadily, peaking in 2016 at 9,858 births per year, which provided a growing base for future enrollment. Since 2016, the number of births in D.C. has declined by an average of 227 babies every year (or 2.3 percent every year), falling to 8,723 births in 2021.[7] Most babies born in 2016 would have entered pre-kindergarten at age three in the fall of 2019, which was the last year of enrollment increases in D.C. The number of births to D.C. residents started declining as of 2017—the cohort who happened to be entering pre-kindergarten for age 3 in the fall of 2020, which was the first school year when enrollment was influenced by the pandemic, and which also saw lower enrollment than the prior year. The decline in births began before the pandemic, and therefore will not necessarily reverse as we move to a stage in the pandemic where its impacts are felt less. This means that a portion of lower enrollment is likely to be permanent.
Shifts in population and fertility
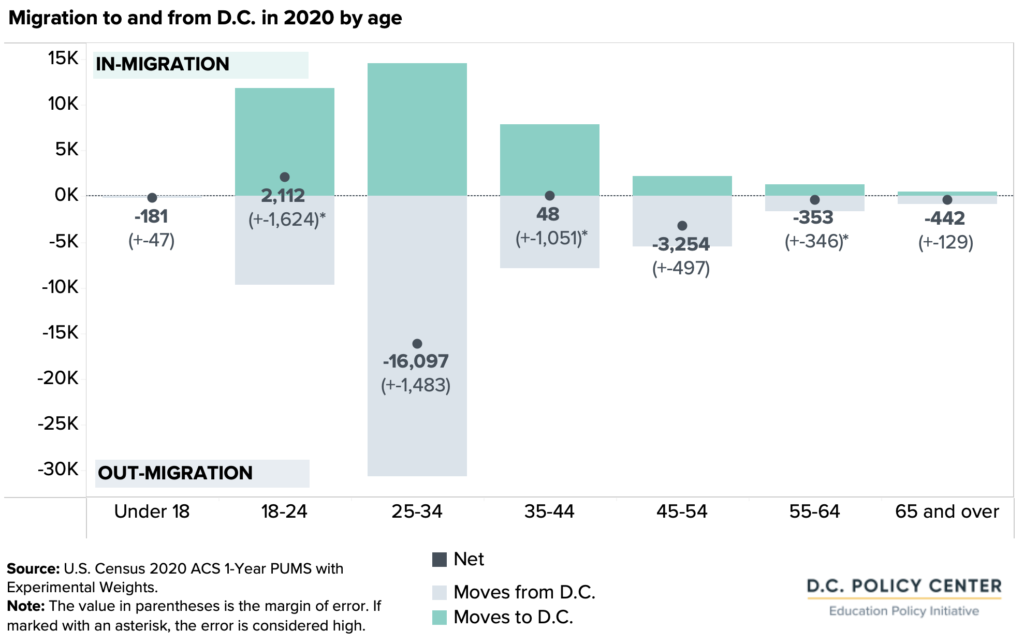
Births are declining because there is a smaller population of women who are childbearing age[8] living in D.C., and they have lower fertility rates than in the past. Data show that the population aged 25 to 34, when women are most likely to have children,[9] has not been growing as quickly as in previous years. This trend began to take hold before the pandemic. Between 2015 and 2019, the population aged 20 to 24 decreased by 7 percent, and the population aged 25 to 34 increased at 5 percent compared to 24 percent over the previous five years.[10] In 2020, this trend continued as 16,097 residents aged 25 to 34 years left D.C. on net, which is a larger outmigration than any other age group. Population by age is not available for 2021, but the overall population is estimated to have declined by 20,043 from 2020 to 2021,[11] making it unlikely that the 25- to 34-year-old population has increased in large numbers.
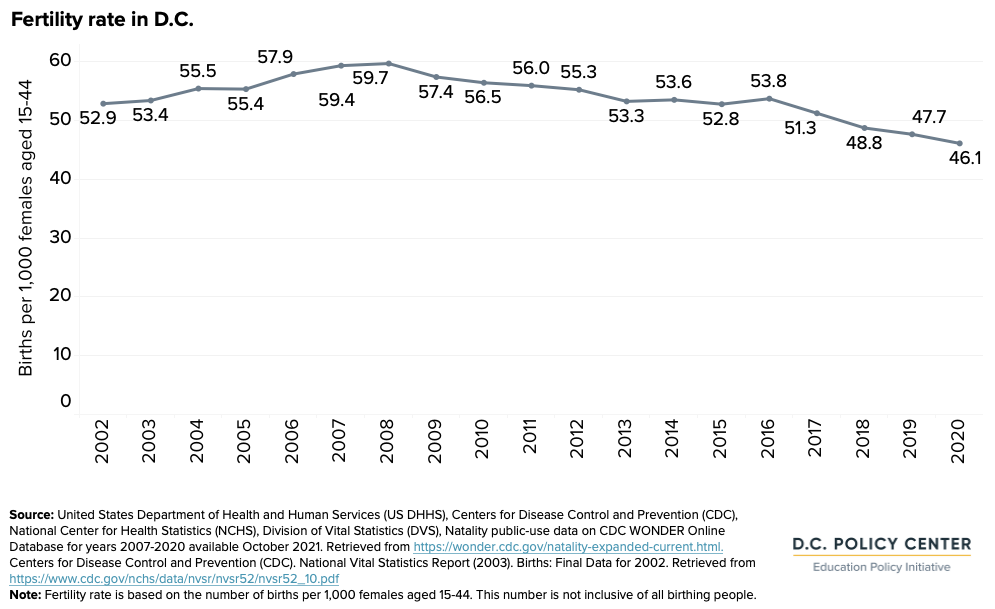
In addition to having fewer potential parents, the fertility rate, or number of babies born for every thousand females ages 15 to 44, peaked in 2008 at 59.7 before starting to decline in 2009. By 2020, the fertility rate was 46.1, a 23 percent decrease from 2008. Because births continued to increase until 2016, population growth countered the lower fertility rate. The number of births is likely to continue to decrease in future years, with women having fewer children on average (a trend that started before the pandemic and may continue in the years that follow), and a lower population of childbearing age living in D.C. as exacerbated by pandemic moves.
Flows affecting enrollment: Retention
The number of births establishes the foundation for future enrollment in D.C. The actual enrollment numbers are determined by flows in and out of D.C. and its public schools. One way to quantify these flows is through the measure called cohort retention ratio, which compares the number of students enrolled in a given grade to the number of babies born in D.C. in the birth year. The cohort retention ratio is useful because it incorporates, in a single metric, how births, migration dynamics, and preference for public schools collectively shape enrollment.
For example, for the cohort born in 2016, the number of students enrolled in kindergarten was 75 percent of the number of babies born in D.C. five years earlier.[12] That is, for every 100 babies born in the District in 2016, 75 students enrolled in kindergarten in school year 2021-22. That difference of 25 is the combined impact of net domestic migration (perhaps fewer children remained in the city, after accounting for those who left, as well as those who moved in), and preference for other schooling alternatives (some attending private schools or homeschooling).
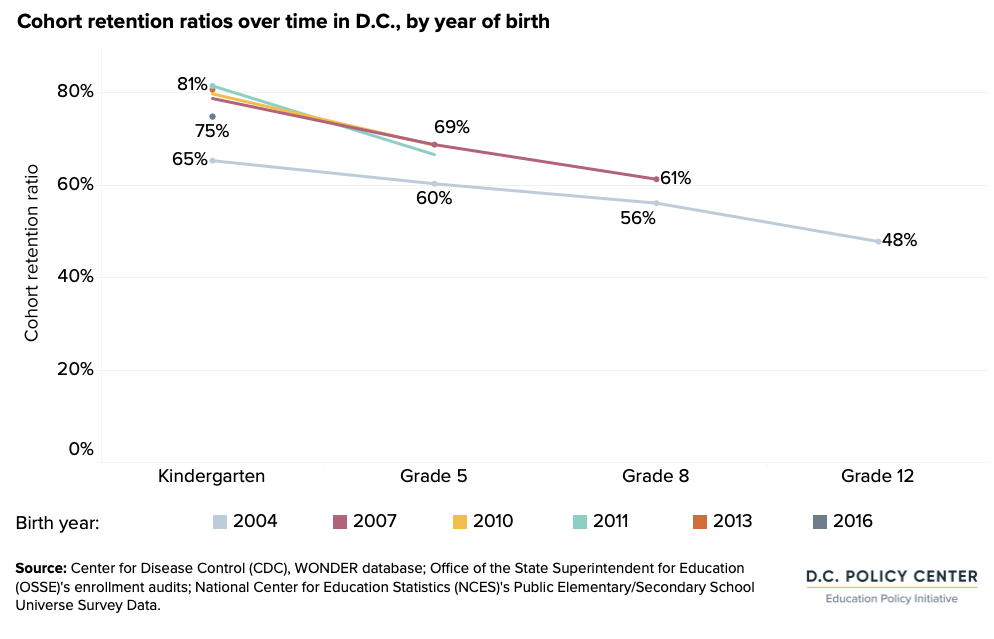
For the same school year, 2021-22, the cohort retention ratio was 61 percent for grade 8—that is, for every 100 babies born 13 years ago (likely age for grade 8), 61 were enrolled in D.C.’s public schools as 8th graders. This shows attrition over time for students moving out of D.C., attending private schools, or homeschooling, among other changes. The retention ratio for those in grade 12 was 48 percent, but this is a little more difficult to interpret given that by the end of high school, more students may have been repeated a year or disengaged compared to elementary and middle grades.
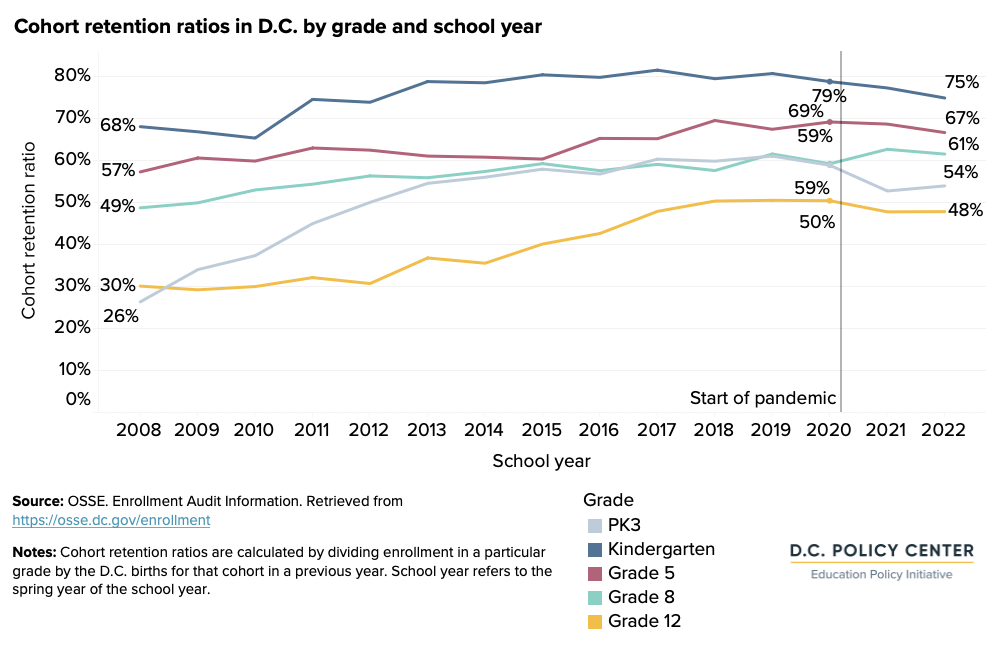
Importantly, before the pandemic, cohort retention ratios had been improving for older students in grades 5, 8, and 12, meaning that more students were staying in D.C., choosing its public schools, and persisting through elementary, middle, and high school. For grade 5, ratios improved from 57 percent in school year 2007-08 to 67 percent in school year 2021-22, and grade 8 increased from 49 percent in school year 2007-08 to 61 percent in school year 2021-22. Cohort retention ratios also improved for kindergarten, by 7 percentage points. The implementation of universal pre-kindergarten in 2009[13] drastically expanded coverage for PK3, leading to a doubling of the cohort retention ratio for this non-compulsory grade.
During the pandemic, these trends shifted. Cohort retention ratios declined the most for early learners in pre-kindergarten and kindergarten by at least four percentage points between school years 2019-20 and 2021-22. Pre-kindergarten is important to consider, as it is usually a leading indicator of the strength of elementary enrollment,[14] and kindergarten is noteworthy as the first compulsory grade—and a grade where lower retention rates dampened the enrollment increase that would be expected from increasing births in 2015 and 2016. Lower cohort retention indicates weaker demand among families with younger children for living in D.C. and attending D.C.’s public schools. It could also mean lower demand for upper grades in the future. Unlike younger children, the impact was smaller for upper grades, with cohort retention actually increasing for grade 8, for example.
Unlike birth trends, which are experiencing a national decline,[15] cohort retention is shaped by D.C. factors, and likely experienced a pandemic-induced shock. Therefore, it may have a better chance of rebounding in the coming years. A closer examination of migration dynamics, especially for families, and the preference for public schools in D.C. reveals why these retention rates may have changed during the pandemic and where they may be headed.
Migration for families
The U.S. Census Bureau recently released population data for 2021, showing that D.C.’s population fell by around 3 percent, or a loss of 20,043 residents. This was mostly caused by domestic outmigration, which was at the highest level the city has experienced since the early 1990s.[16] With the advent of remote work for some, residential choices may be less influenced by commute time,[17] and having more space may be more important—making moves out of D.C. more appealing.
Census data are not available on population shifts by age for 2021, but United States Postal Service (USPS) change of address forms[18] suggest that more families left D.C. in 2020 than usual, and that so far, there has not been a rebound of families moving back to D.C. in 2021. In 2020, 12,267 families moved into D.C. (decrease of 1,148 from 2019) and 17,066 families moved out of D.C. (increase of 1,644 from 2019). This indicates that on net, 4,799 families moved out of D.C. in 2020, which is more than double the net number of families moving out of D.C. in 2019.[19]
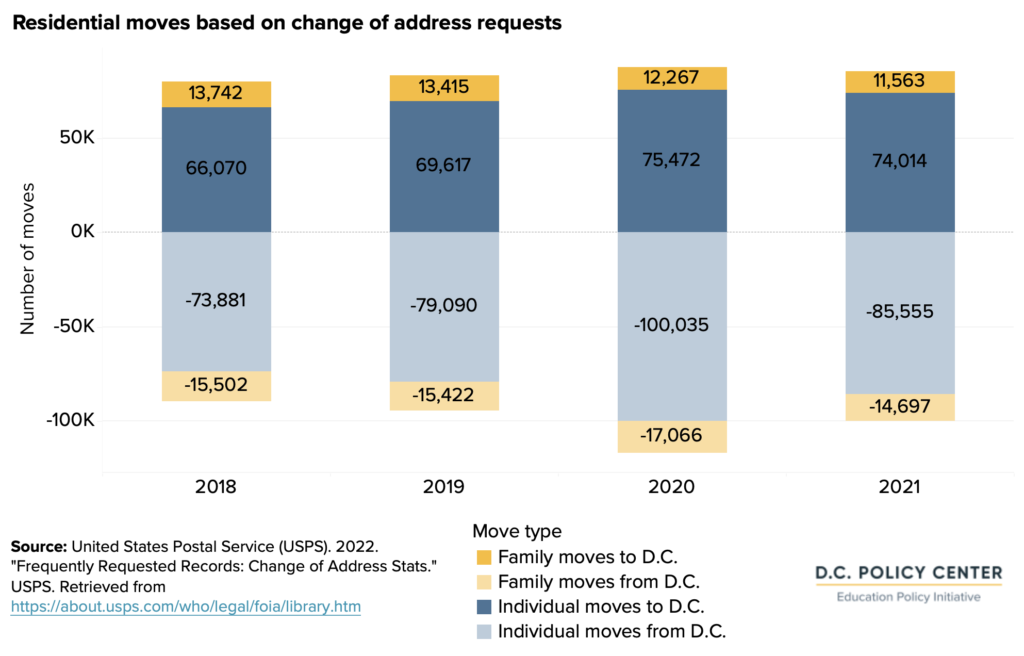
An analysis by the Office of Revenue Analysis’ District, Measured blog estimated that about 48 percent of residential moves were temporary in 2019 and 2020.[20] However, at 11,563 families, recorded moves into D.C. for families for 2021 were lower than pre-pandemic levels, which indicates that even though individuals may have returned, families are not moving back in large numbers.[21]
Population of babies and toddlers
Data show that during the pandemic, more families left D.C., fewer children were born, and enrollment for younger students declined. Understanding population trends for children under age five who have not yet entered compulsory years of education, but will, in a few years, shape public school enrollment, is extremely important for enrollment projections, but this remains difficult given the lack of data.
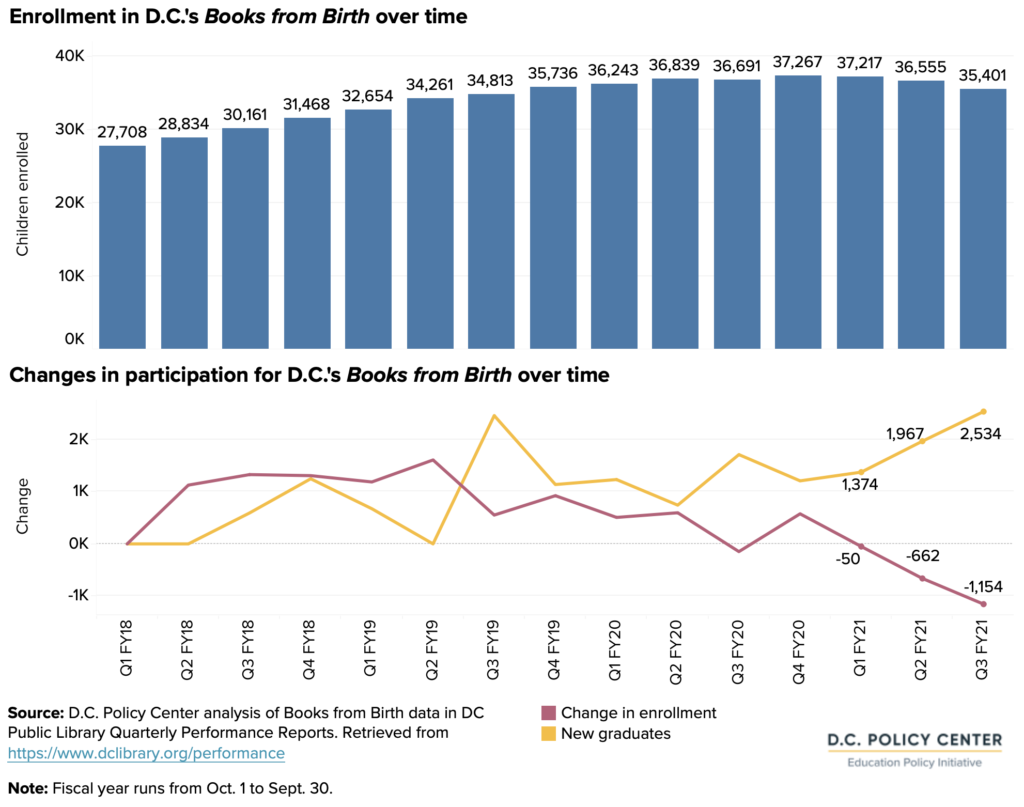
One potential source of information for this group is the DC Public Library’s Books from Birth program, which mails a free book every month to children until they turn five. Children enter the program whey they are born, and leave it either when they turn five and age out of the program, or if they leave the city, and therefore are removed from the program. Program participation data suggest that there are now fewer young children living in D.C. than in previous years. Participation peaked with 37,267 children receiving books in the summer of 2020 (the last quarter of FY2020),[22] and by the spring of 2021 (third quarter of FY2021), enrollment had declined by 1,866 children to 35,401 children. This decline was due to more children graduating from the program after age five and presumably fewer new enrollments at birth or older ages.
Preliminary U.S. Census Bureau birth data from components of population change for 2021 show 8,723 births,[23] which is a small decrease from 8,874 births in 2020 and is not enough to explain the declining enrollments in Books from Birth. Instead, more families moving out of D.C. may be contributing to lower participation. It is possible that the decline in enrollment is reflective of lower awareness of the program due to fewer in-person community activities, but these data give us pause regarding the future of enrollment in early grades.
Interest in D.C.’s public schools and other options
While the number of school-aged children living in D.C. is the foundation for enrollment, parents’ and caregivers’ interest in D.C.’s public schools determine the actual enrollment levels—and this interest seems to be declining.
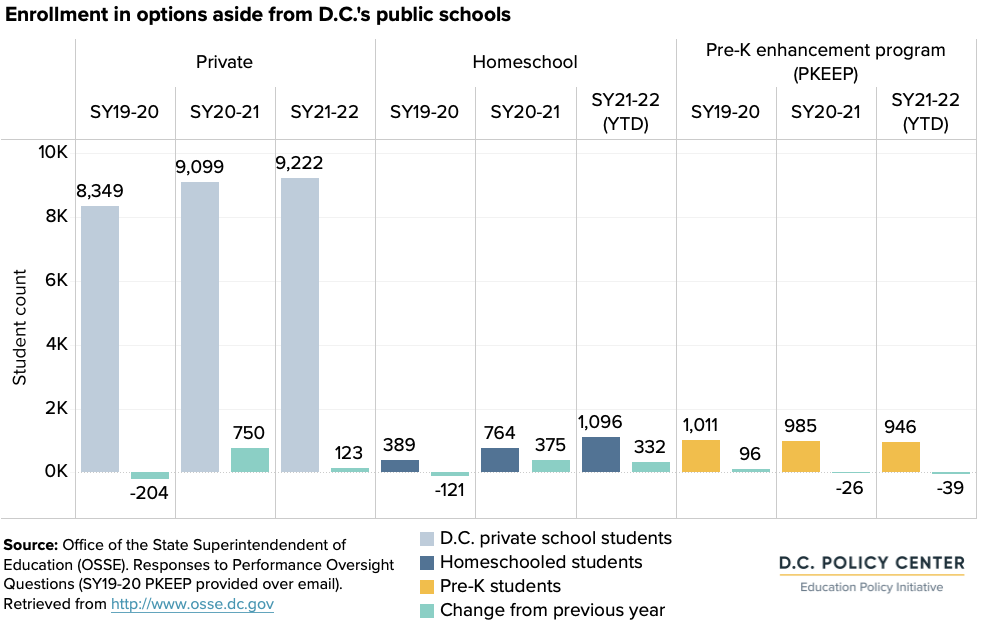
School year 2020-21 saw an increase of 750 D.C. residents enrolled in private schools in D.C. This excludes D.C. residents attending private schools in Maryland and Virginia, but it provides a sense that enrollment in private schools likely increased during this time. Homeschooling (only for compulsory grades) also increased by 375 students in school year 2020-21 and another 332 students in school year 2021-22 as of January 2022. Pre-K enhancement program (PKEEP) enrollment at community-based organizations gives a sense that there was not a huge shift from public schools to publicly-funded spots at child development centers—and there are no data on all early childhood programs.
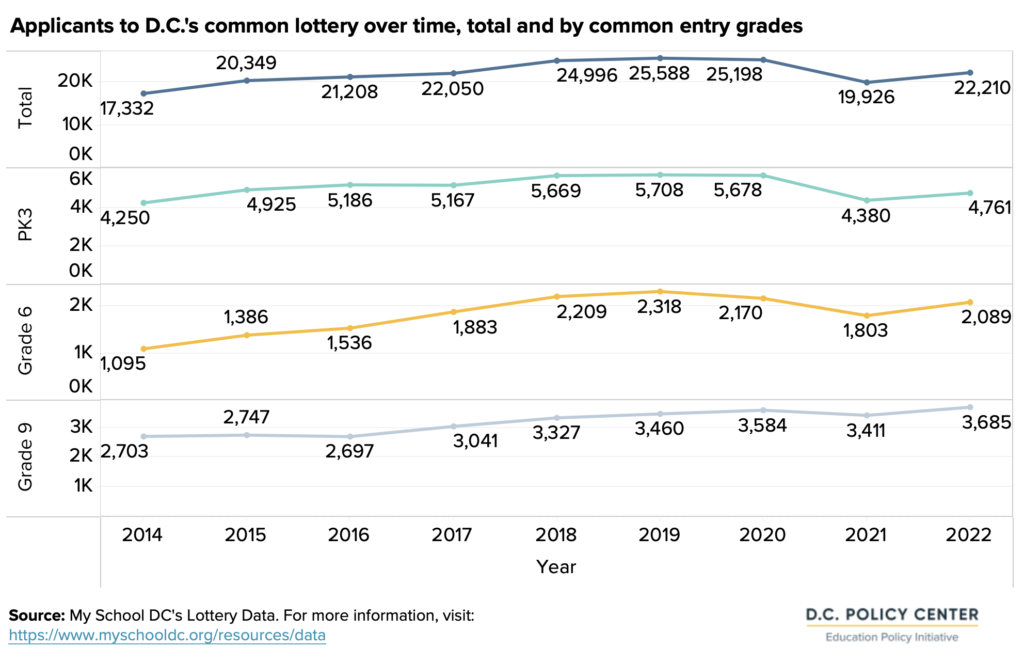
Data on homeschooling and private school enrollment by grade is not available, but we can look to applications to D.C.’s common lottery, which assigns pre-kindergarten spots or seats at a school aside from the neighborhood option, to get a sense of which grades have lower demand for public schools. Comparing 2020 to 2022, the overall number of applicants is down by 12 percent. Looking at common entry grades,[24] demand for non-compulsory pre-kindergarten for age three (PK3) has decreased the most during the pandemic.
In 2021, the first lottery with applications submitted during the pandemic, the total number of applicants decreased by 21 percent and applicants to PK3 decreased by 23 percent, close to the number in the very first year of the common lottery. In 2022, the total number of applicants increased by 11 percent and the number of PK3 applicants increased by nine percent, but both remain below the years immediately before the pandemic while the number of middle and high school applicants have largely rebounded.
Part 3: What do changes to births and retention mean for future enrollment?
Fewer births and lower cohort retention ratios—unless reversed—will result in declining enrollment in D.C.’s public schools. To quantify the impact of lower births and retention on pandemic enrollment, and to project enrollment for the next five years, this analysis looks in more detail at the transition ratios from grade to grade in order to elaborate on what lower enrollments in early grades might mean for future enrollment in higher grade bands.
Transition ratios from grade to grade are calculated as the number of students in a grade divided by the number of students in the previous grade in the previous year (PK3 enrollment is the exception, compared to births). First, we use average pre-pandemic transition ratios between school years 2017-18, 2018-19, and 2019-20 to examine the impact of births and retention on enrollment during the pandemic school years of 2020-21 and 2021-22. [25]Second, we use these average pre-pandemic transition ratios, as well as the average pandemic transition ratios between school years 2019-20, 2020-21, and 2021-22 to project future enrollment through school year 2026-27.
Impact of lower births and retention during the pandemic
How much of the current stagnation in enrollment can be explained by fewer births? And how much is due to lower demand for public schools as measured by retention? To isolate the impacts of these two drivers, we developed a counterfactual estimate—the enrollment that the District’s public schools could have had if two things had been different: (i) if students stayed in D.C.’s public schools at similar rates to pre-pandemic; and (ii) if births had continued to increase as they had from 2007 through 2016.
This analysis shows that lower retention, caused by families moving out of D.C. or choosing other school options in higher numbers during the pandemic, likely contributed to more of the enrollment stagnation: an estimated 2,000 fewer students over two years. Lower births in 2017 and 2018 before the pandemic likely meant an estimated enrollment decrease of 1,000 students over two years. It is important to note that while retention impacts are twice as large as birth impacts, they are spread across more grades. Birth impacts are concentrated in pre-kindergarten, and therefore will be felt more in future years.
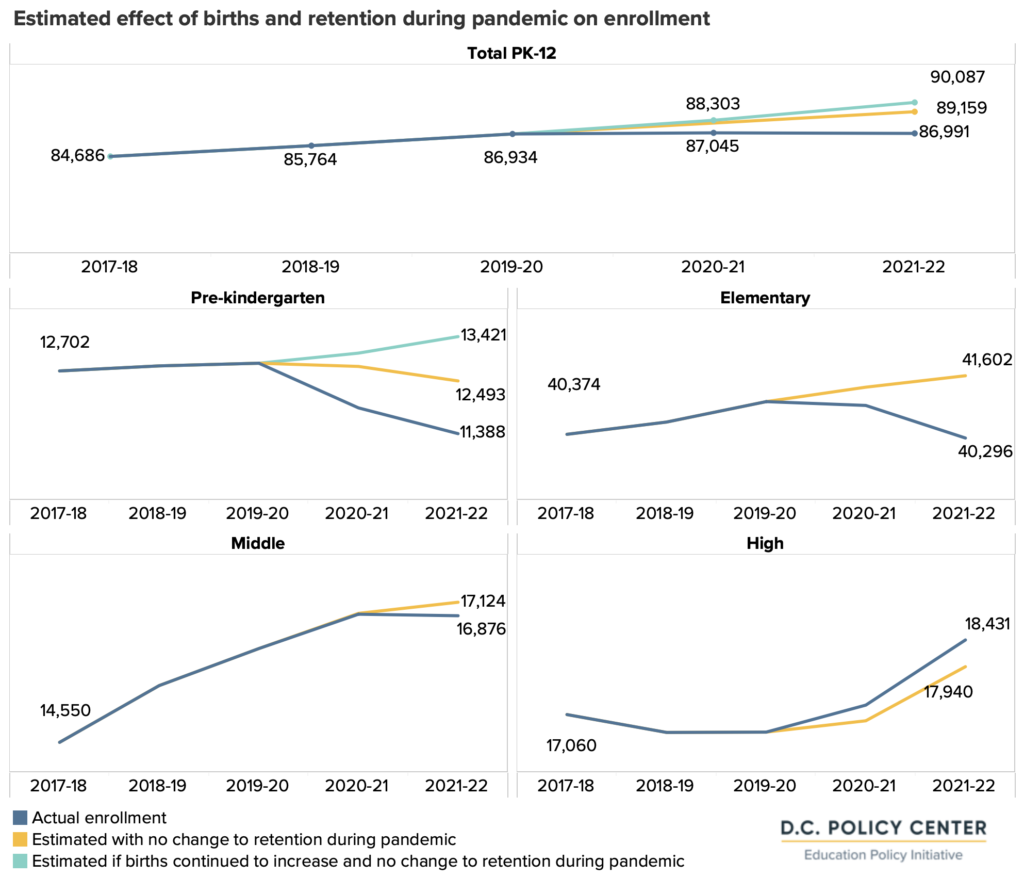
These estimated enrollment losses due to fewer births and lower retention were experienced differently across grade bands. Pre-kindergarten is the only grade band so far that has been affected by changes to both drivers, with births and retention each leading to an estimated 1,000 fewer students over two years (about 2,000 fewer in total). Elementary school grades missed out on growth of about 1,300 students due to retention, and middle school grades missed out on just 248 students. High school grades, on the other hand, gained about 500 students during the pandemic due to higher retention rates, which could be due in part to relaxed attendance and grading policies during the pandemic.[26]
Potential future enrollment
Larger enrollment losses in earlier grades, where lower births are likely to persist in the coming years, indicate that overall future enrollment is likely to be lower as these students grow older. But these impacts could be blunted if retention rates rebound. Next, we provide three scenarios for enrollment through 2026-27. Each scenario assumes different changes to retention, while births continue to decline in all three.[27] With UPSFF-audited enrollment in school year 2021-22 as a starting point, these projections, based on changes to transition ratios and births, are just estimates but provide a range to consider when planning for future enrollments.
Assumption governing birth rates (same for all scenarios)
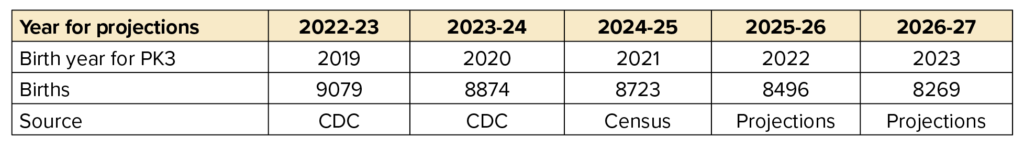
Babies have already been born who will join the next three PK3 cohorts through school year 2024-25. For the next two cohorts through school year 2026-27, births can be assumed to decline by 227 per year (based on the previous five-year average) given lower fertility rates and a smaller childbearing population in D.C. (see Appendix for births used in projections).[28]
Assumptions governing retention ratio
- Scenario 1, current conditions continue: Births continue to decline, and retention remains at pandemic levels. This will yield pre-kindergarten to grade 12 enrollment of 81,402 students in school year 2026-27.
- Scenario 2, retention returns to pre-pandemic rates: Births continue to decline, and retention returns to pre-pandemic levels, with an increase to pre-kindergarten, elementary, and middle grades but a decrease to high school grades. This will mean 86,717 students enrolled in school year 2026-27.
- Scenario 3, retention returns to pre-pandemic and students who left return: Births continue to decline, retention returns to pre-pandemic levels, and students who left come back (one-time boost of enrollment in 2022-23). This will mean 89,212 students in school year 2026-27.
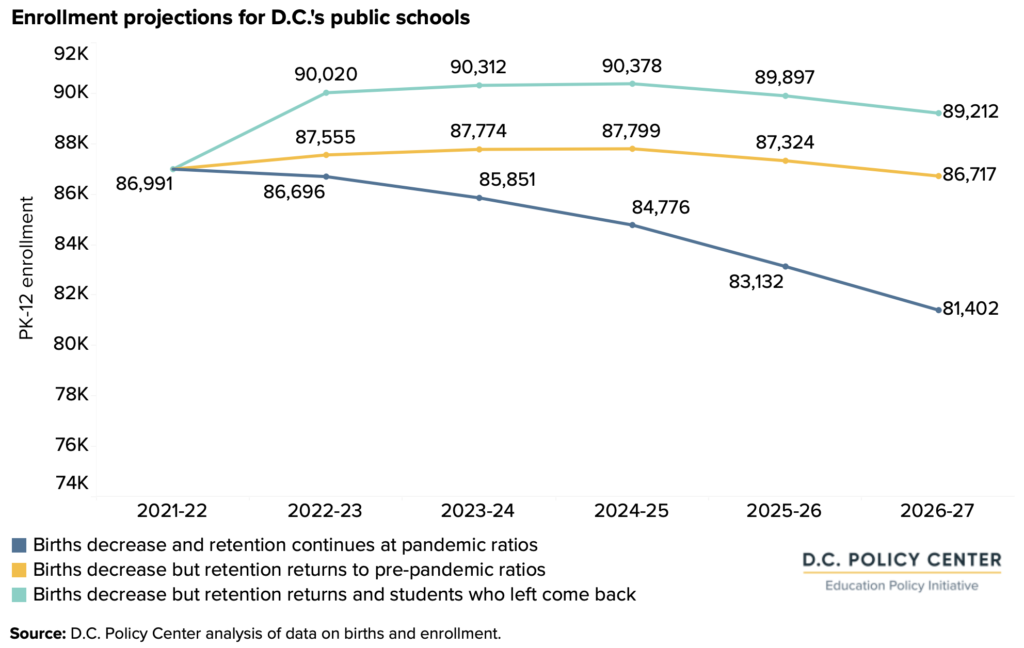
In all scenarios, enrollment is projected to decline year-over-year by school year 2026-27, even if total enrollment has increased from school year 2021-22 levels. This is due to changes that are happening differently for each grade band. High school enrollment continues to increase by at least 1,500 students by school year 2026-27, and middle school enrollment is stable. Elementary school enrollment could see a decrease between 500 and 5,500 students. Pre-kindergarten is also likely to decrease by between 200 and 1,000 students, depending on what happens with retention.[29] As a separate note only relevant for pre-kindergarten, if births stay flat at 2021 levels, enrollment in pre-kindergarten could increase instead by up to 200 students.
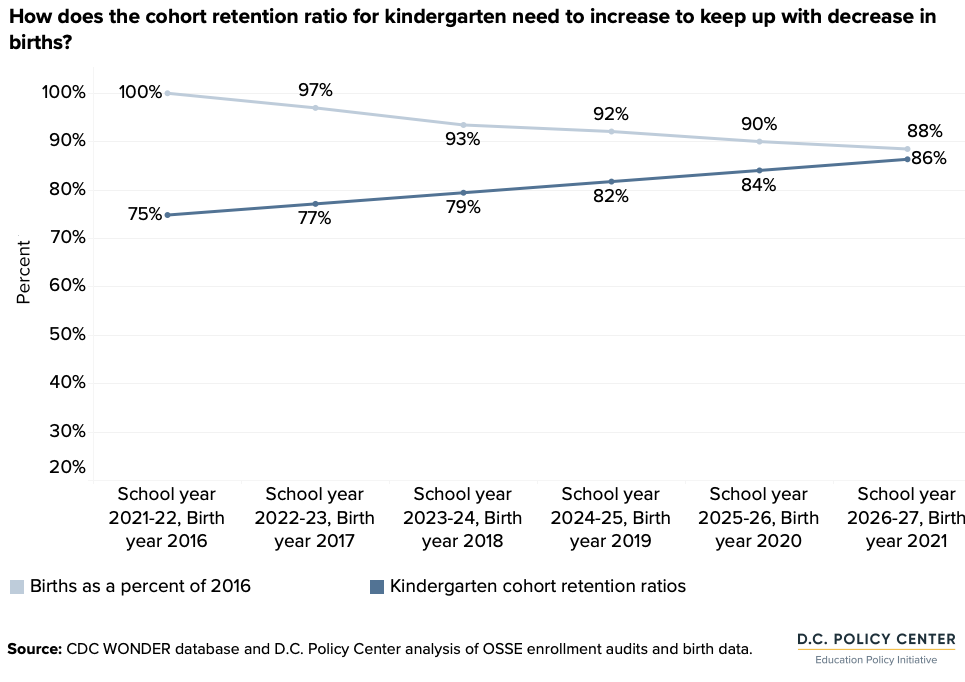
If births keep declining as these scenarios predict, the flows of migration into D.C. and preferences to attend D.C.’s public schools need to increase in order to compensate for these decreases in births and create enrollment growth. In detail, births from 2016 through 2021 decreased by 227 babies per year, or 2.3 percent, meaning 2021 births are 88 percent of the 2016 total. This means that flows, measured by cohort retention ratios, would need to increase by 2.1 percentage points annually just to maintain enrollment. In school year 2021-22, the kindergarten cohort retention ratio was 75 percent, so increasing by 2.1 percentage points annually to maintain enrollment would mean it would need to be 86 percent by school year 2026-27—this is higher than it has been since at least school year 2008-09.
Given how unlikely it would be for retention to increase to this magnitude, births would need to increase in order to return to the years of pre-pandemic enrollment growth. By the numbers, this would look like an immediate return to the 2016 high water mark for births of 9,858 per year—an increase of more than 1,000 births per year for 2022 and following years—in addition to a return to pre-pandemic retention. It is difficult to foresee strong reversals of these trends in both the base and the flows, or a dramatic increase in births that were on the decline pre-pandemic accompanied by strong in-migration and preference for public schools.
It is possible that retention may improve, and students choose public schools at higher rates than during the first two years of the pandemic. If this is the case, D.C. could have a steady enrollment closer to 87,000 in pre-kindergarten to grade 12, with lower enrollments starting in early grades and moving up in future years. The school system should start anticipating these changes and keep a close eye on population changes in the coming years.
Conclusion
The District of Columbia saw strong enrollment growth year after year for over a decade through 2019. Growing enrollment created an environment where the focus was on hiring more teachers, creating more seats, and planning for more schools. Enrollment growth also meant growing budgets, which allowed schools to expand their program offerings and create additional supports for students and their families. Growth has been the norm, and that has shaped everything.
With fewer births, increased out-migration, and a weaker preference for the District’s public schools, it is likely that school enrollment is going to be smaller for at least the next several years. If this happens, the pressures on the city’s public school system will be very different; in fact, they will be the opposite. Smaller budgets, staffing reductions, and program cuts might become inescapable. School planning may have to be readjusted to reconcile with the realities of lower enrollment. The school system should start anticipating these changes and prepare for hard decisions, especially if enrollment does not show signs of a rebound in 2022-23.
Appendix. Calculated values used in enrollment projections
Transition ratios from grade to grade
Births for projections