

Out-of-school time programs, such as afterschool and summer programs, are important to many families the District of Columbia. This report examines, for school year 2021-22, the subsidized OST seats that exist across the District, including how many are available versus needed, based on four different policy metrics. The greatest OST capacity, in raw numbers, is in wards where most students live and go to school. However, the number of students is still proportionally higher than the number of seats.
This report is commissioned by the District of Columbia Deputy Mayor for Education (DME). It serves as the basis of a series. Other publications include:
- Chart of the week: D.C. children face unequal access to out-of-school time programs
- Demand for out-of-school time programming shifts, depending on where students live versus where they go to school
- How many out-of-school time seats D.C. has, and where they’re located
- How many more out-of-school time seats does the District of Columbia need?
- How close are out-of-school time programs to where students live?
- Who provides of out-of-school time programs in the District of Columbia?
- Out-of-school time programs in the District of Columbia: Parent and guardian experiences
- Recommendations for out-of-school time programs in the District of Columbia
Access the report in printable PDF format here.
Quick links
Introduction
Out-of-school time (OST) programs are important to parents of younger students and youth in the District of Columbia.
Out of school time programs include those offered before or after school, over the summer, on weekends, and during school breaks or long weekends when school is not in session. These programs can be focused on sports, arts, STEM, or creative development, and may teach new skills, or offer academic support.
OST programs serve multiple roles, ranging from providing quality supervision for younger children during traditional work hours, to offering first steps into workforce for older youth. Quality programs may provide children and youth with academic support and enrichment,1 supportive social environments,2 or simply serve as a safe space for children and youth to spend their out-of-school time.3 Programming can support the learning and development of children, foster social connections and development, provide childcare, or supplement academic learning. Research has suggested that high-quality4 OST programming is associated with improved academic performance and attendance, increased engagement, and development of career skills.
The availability and quality of afterschool or summer programs matter for many reasons5 and are especially important for children and youth facing barriers to academic success.6 As such, it is imperative that we understand the existing landscape of OST programs in the District, as well as whether those programs are available to D.C. students and meet their needs.
However, access to programs and programming content is not equal across the District. Low-income families are more likely to report dissatisfaction in afterschool options and are less likely to be enrolled in out of school time programs. At the same time, low-income families report greater interest in out-of-school time programming than wealthier households.7 Additional concerns are also often raised about access to programs and appropriate programming content for English learners and students with disabilities. Addressing these needs can be challenging, as barriers stem from transportation, scheduling, lack of information or communication about programs, and affordability of programs.
In 2017, the D.C. Policy Center published a landscape analysis of out-of-school programs in D.C. that focused on the existing programs by ward and whether those programs were adequate to meet the needs of students based on various policy goals. The study found that at that time, there were an estimated 33,400 children and youth attending subsidized afterschool programming in the District of Columbia, including an estimated 28,700 D.C. children between pre-K and 8th grade, and an estimated 4,700 youth in grades 9 through 12.
The study also compared these capacity figures to different metrics of needs. For example, offering a seat to all students in D.C. public schools and public charter schools would have required 83,400 seats—nearly 2.5 times the capacity at the time. Alternatively, ensuring that every student with the statutory “at-risk” designation had a space in OST programs would have required an additional 6,500 seats (assuming these students are given priority for attending OST programs).
The 2017 report also found that there were not enough affordable or free programs, that funding was not sufficient to cover provider’s needs, and that parents and caregivers needed to piece together multiple forms of care to ensure activities for children outside of school hours.
Goals of this report
This report reexamines the need for and the capacity of out-of-school time programs in the District of Columbia. The report focuses on the 2021-2022 school year—the first year of in-person learning since the beginning of the COVID-19 pandemic. The report examines the potential need for out-of-school time programs, the capacity of existing programs, and whether the capacity can meet needs across the entire city and for special student populations (such as students who are designated as at-risk, students with special education needs and English learners).
It also brings forward qualitative data on the changes brought on (or amplified) by the COVID-19 pandemic, and challenges faced by providers, families and youth attending programs. The analysis largely focuses on afterschool and summer programs, which are the most prevalent and often integral in a student’s daily activities and learning development.
National context
While this report focuses on D.C., it is important to provide some national context on the availability of and access to OST programs, and how the city performs relative to the rest of the country. Unfortunately, no comprehensive administrative data exist on seat counts at the state, local, or school district level. The only nationally comprehensive data on OST programs are produced by the Afterschool Alliance. These data extrapolate participation and exclusion metrics based on household surveys. The data are released at the state level, except for a handful of metro areas. The comparison of D.C.—a city—to other states is problematic since access to OST programming in rural parts of the country is limited.
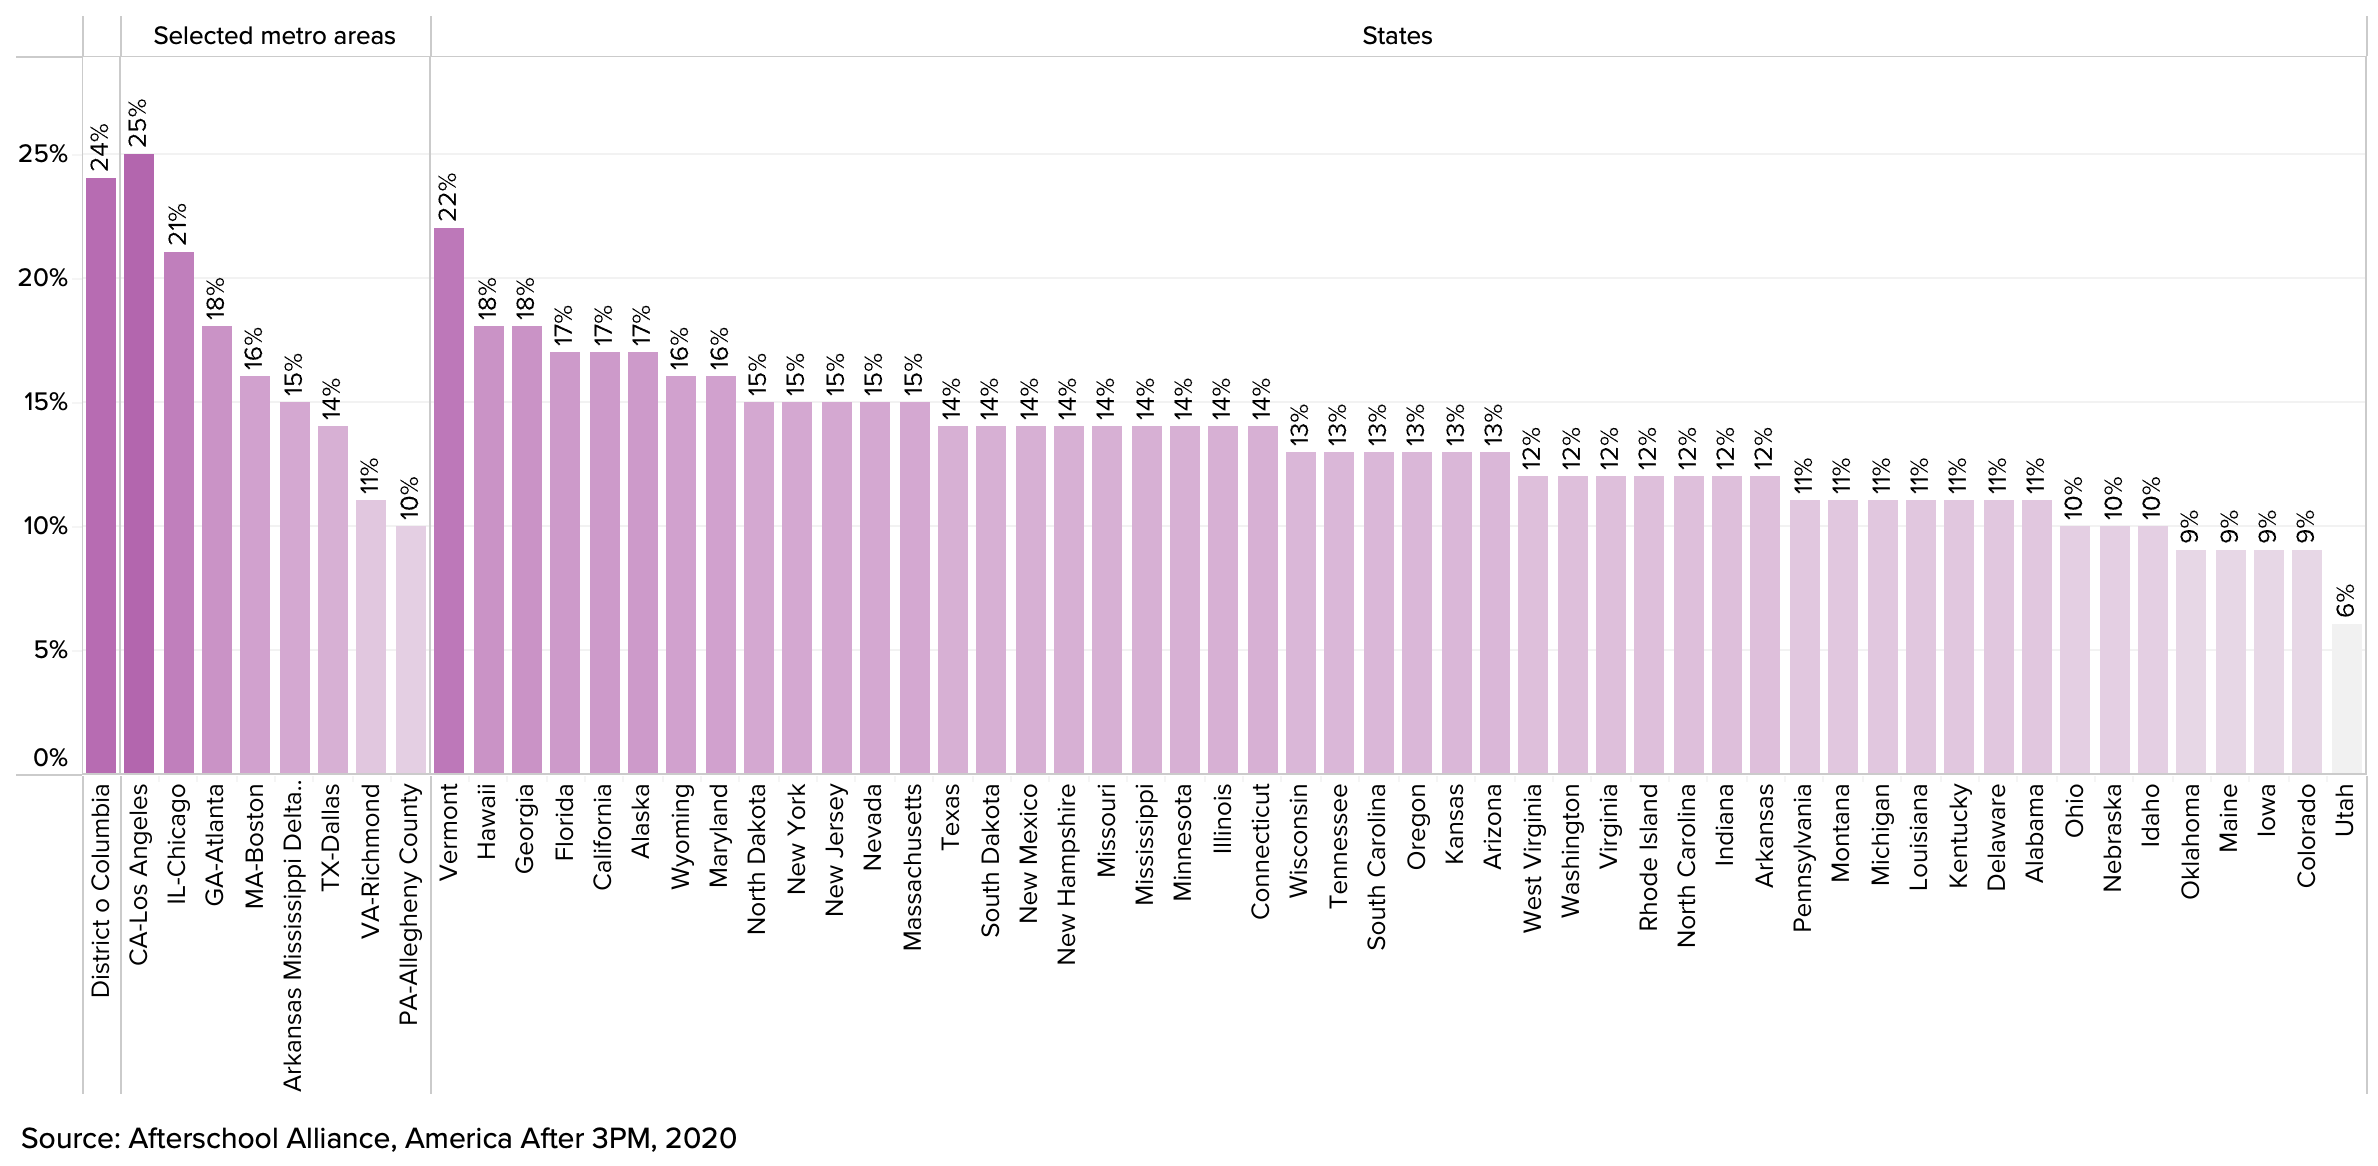
Notwithstanding these limitations, data from the 2020 Afterschool Alliance report (which collected information both before and after the pandemic began) shows that OST (and specifically afterschool) participation among children and youth in the District of Columbia was 24 percent that year.8 This participation rate ranks at the top of all states and is only second the Los Angeles (25 percent) when measured at the metropolitan area level.
The report finds that in 2020, 13 percent of District’s children and youth were unsupervised between the hours of 3PM and 6PM (same as the national share). The District particularly outperforms the rest of the country on inclusion: according to the report, at the national level, for every child enrolled in OST programs, there are three others who are excluded and would have attended a program if available. In the District of Columbia, this number is one.
The timing of the 2020 report, which was issued after the beginning of the pandemic, could be dampening participation rates. According to this report, the participation rate in D.C. declined from 35 percent in 2014 to 24 percent in 2020. This could be due largely the impact of the pandemic. As will be shown in this report, during the 2021-22 school year, there were approximately 36,460 seats in afterschool programs serving 88,482 public school students. This brings the participation rate in OST programs to slightly above 41 percent (Figure 1).
Figure 1. Participation in afterschool programs, by state, and selected metropolitan areas, 2020
Data sources
This report relies on multiple data sources. The assessment of needs uses student level data obtained from the Office of the Deputy Mayor for Education (DME), which have been geocoded for both student residence and school location at the census block, block group, and track levels and have also been matched with neighborhood clusters defined by the Office of Planning and city wards adopted in 2022 based on the 2020 Decennial Census. Data received from DME are audited enrollment data for school year 2021-2022, as of October 5, 2021. Students are grouped into grade bands by using grade level information provided in this dataset, which corresponds to grade levels identified for each student for Uniform Per Student Funding Formula (UPSFF) purposes. The data exclude students identified as adult, alternative, or special education (for grade level purposes). They also exclude one charter school that is not coded as an adult or alternative school but serves older students who are typically in the labor force.
The capacity data have been compiled through:
- A survey of Community Based Organizations (CBOs), charter schools and non-Title I schools about the programs they offer;
- Supporting data from the DME on CBOs that receive OST grants;
- Administrative data from DCPS for programs offered at Title I schools;
- Summary seat data obtained from Department of Parks and Recreation on summer programs, afterschool programs, and seasonal sports programs;
- Summary seat and participant data from the Department of Employment Services on the Marion Barry Summer Youth Employment Program; and
- Other data directly collected from CBOs and providers through interviews.
In addition, the two surveys administered by the D.C. Policy Center with program providers and two parent surveys conducted by DC PAVE (one in English, on in Spanish) provide qualitative information on challenges faced by the CBOs, parent and youth preferences, and bottlenecks, including those that might have been amplified by the COVID-19 pandemic.
Limitations and omissions
It is important to note that the analysis presented in this report is subject to certain limitations and omissions:
- On the supply side, the total count of seats reported is the summation of what is reported by providers and is therefore likely an undercount because it is likely that there are providers that did not receive the D.C. Policy Center questionnaire (we do not know the full universe of providers) and there are providers that did receive the questionnaire but did not respond. While non-response rates are known,
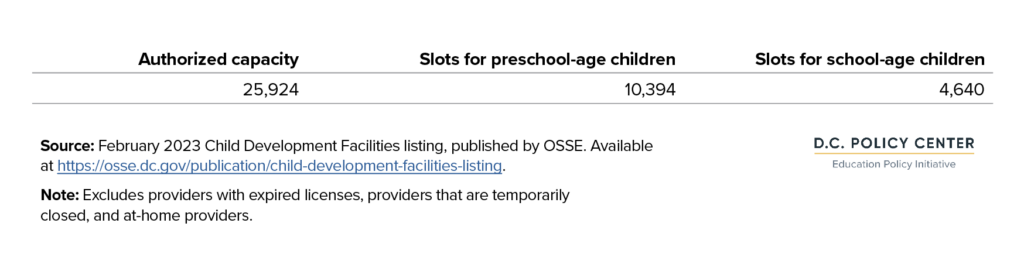
- The seat counts do not include all programs offered at child development facilities that are licensed by OSSE. Some afterschool program providers are also licensed as child development centers with OSSE and can offer before- and afterschool or summer programs to school-age public school students. According to the February 2023 Child Development Facility report published by OSSE, facilities licensed by OSSE have capacity to serve 4,640 school-aged children. Some, but not all of these slots are captured in this report. In addition, OSSE licensees serve pre-school age children, including in some cases children who are enrolled in the noncompulsory PK3 and PK4 grades at a DCPS or charter school and attend a licensed child development facility for out-of-school time care. These slots are also excluded from the overall seat count because we cannot reliably determine how many licensed preschool slots are serving students enrolled in DCPS or public charter schools. Some children attending afterschool programs in OSSE-licensed facilities may be eligible for childcare subsidies to cover the costs of their attendance (Table 1).
Table 1. Seat capacity at licensed child development facilities, 2023
Organization of this report
This report begins, in Chapter 2, with an analysis of where public school students live and attend school, and how this changes at the ward and neighborhood cluster level by different student characteristics. This section also provides various estimates of need based on different priorities the city may adopt given what we know about public school students.
Chapter 3 focuses on capacity of programs separately for elementary and middle school students and high school students. This section examines program capacity by type (afterschool and summer), location, proximity to students, and different types of offerings.
Chapter 4 introduces four metrics of need and identifies gaps in seat availability and how these gaps change for different student groups. This section provides coverage rates at the ward level, comparing the number of seats in each ward to the number of students living in and attending school in those wards.
Chapter 5 develops coverage maps at the ward level which compare the number of seats available in each ward to the number of students who live there, and alternatively attend school there. This section also presents a proximity analysis (and maps), counting seats that are within a certain distance of students’ homes at the census block level.
Chapter 6 provides characteristics of providers who responded to the D.C. Policy Center surveys including information on frequency of program offerings, information about the providers themselves, and challenges faced by providers.
Chapter 7 brings in qualitative information from parents collected through surveys, one parent listening session, including information on family expectations, how families and youth find OST programs, and barriers faced by parents and students in attending OST programs.
Chapter 8 concludes with recommendations.
The Appendix provides additional data and a detailed methodology.
Continue reading the full report »
Endnotes
- Cosden M., Morrison, G., Albanese, A.L., & Macias S. (2001). When Homework is not Home Work: After-School Programs for Homework Assistance. Educational Psychologist 36 (3).
- See, for example, National Institute of Child Health and Human Development Early Child Care Research Network, (2004). Are Child Developmental Outcomes Related to Before- and After-School Care Arrangements? Results from the NICHD Study of Early Child Care. Child Development, 75: 280–295. doi:10.1111/j.1467-8624.2004.00669; Durlak, J. A., Weissberg, R. P., & Pachan, M. (2010). “A meta-analysis of after-school programs that seek to promote personal and social skills in children and adolescents.” American Journal of Community Psychology, 45(3-4), 294-309. Retrieved from https://dx.doi.org.prox- ygw.wrlc.org/10.1007/s10464-010-9300-6; or Durlak, J. A., & Weissberg, R. P. (2007). The impact of after-school programs that promote personal and social skills. Chicago, IL: Collaborative for Academic, Social, and Emotional Learning.
- See, for example, Gottfredson, D. C., Gerstenblith, S. A., Soule, D. A., Womer, S. C. & Lu, S. (2004). Do After School Programs Reduce Delinquency? Prevention Science 5, (4) (12): 253-66. Retrieved from https://prox- ygw.wrlc.org/login?url=https://search-proquest-com.proxygw.wrlc.org/docview/222774823?ac- countid=11243 or Taheri, S. A., Welsh, B. C. (2015) After-School Programs for Delinquency Prevention: A Systematic Review and Meta-Analysis. Youth Violence and Juvenile Justice, Vol. 14(3) 272-290. Retrieved from https://journals.sagepub.com.proxygw.wrlc.org/doi/pdf /10.1177/1541204014567542.
- High quality programming is often defined as having small group settings, trained staff, structured activities, clear goals, and strong relationships with communities, families, and schools. Zakai et al, 2002; Grossman et al, 2009; Little et al, 2008.
- Love, J. M., Harrison, L., Sagi-Schwartz, A., van IJzendoorn, M. H., Ross, C., Ungerer, J. A., Raikes, H., Brady-Smith, C., Boller, K., Brooks-Gunn, J., Constantine, J., Kisker, E. E., Paulsell, D. and Chazan- Cohen, R. (2003), Child Care Quality Matters: How Conclusions May Vary with Context. Child Development, 74: 1021–1033. doi:10.1111/1467-8624.00584
- Bodilly, S., & Beckett, M. K. (2005); Cooper, H., Charlton, K., Valentine, J. C., & Muhlenbruck, L. (2000); Little, P. M. D., Wimer, C., & Weiss, H. (2008).
- Weitzman et al, 2008; Afterschool Alliance, 2014.
- It is important to note that this is different from the findings of this report, which uses survey data from both program providers and administrative data from the D.C. Government to show that coverage was at 43 percent for elementary and middle school students, combined, and 33 percent for high school students.