Out-of-school time (OST) programs, such as afterschool and summer programming, provide childcare, academic support, and social and emotional development to students and families in D.C. But, access to these programs is not equal across the District.
Low-income families are both more likely to report dissatisfaction in afterschool options, and less likely to be enrolled in OST programs. They also report greater interest in OST programming than wealthier households.1 Yet, data suggest that families living in Ward 7 and 8 face higher competition for the seats that do exist.
OST seats close to student’s homes
There are 30,360 subsidized afterschool for elementary and middle school students in the District. Comparing these seats to students,2 there are more afterschool seats per student in Wards 1, 2, and 4 than the rest of the city.
In raw numbers, Wards 7 and 8 have the most seats, but they also have the highest number of students, as well as lower housing density. Together, these factors result lower-than-city-average seats near students’ homes. This lower average translates into much higher competition for seats in OST programs, and thus more difficulty enrolling.
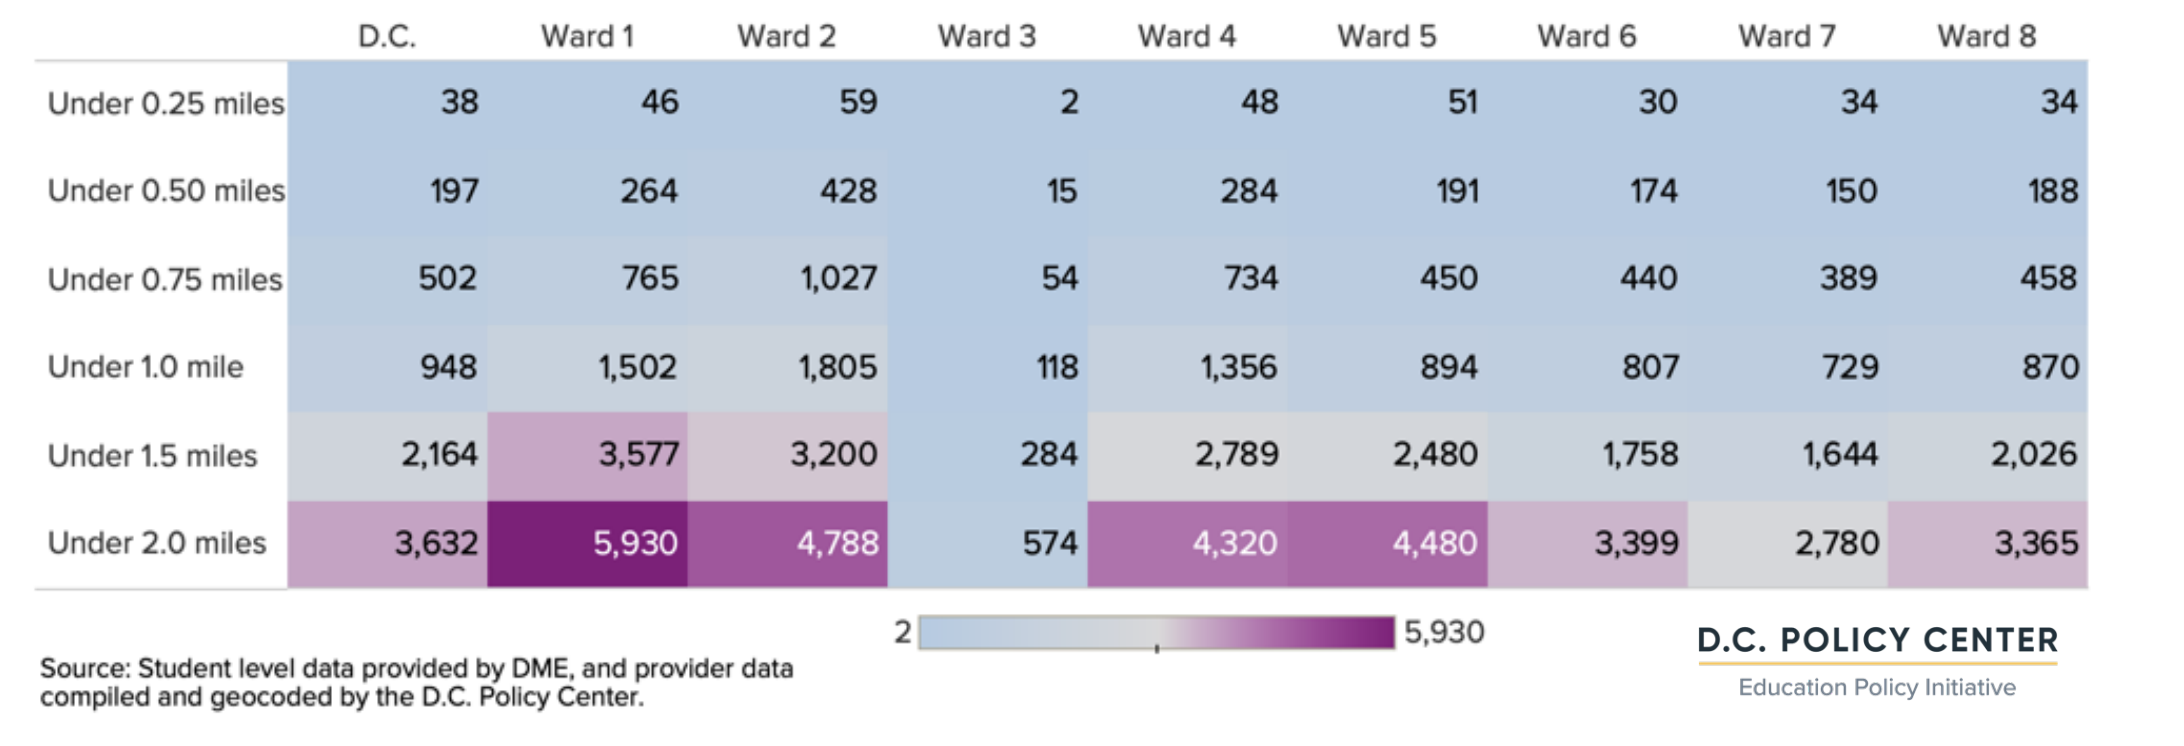
Across the city, there are an average of 38 afterschool seats within a quarter mile of each student’s home, and an average of 948 afterschool seats within one mile of each elementary and middle school student. Ward 2 has the highest number of seats as compared to students, with an average of 59 seats within a quarter of a mile of each student’s home. At every distance, Wards 1, 2, and 4 consistently outperform the city average. Conversely, Ward 3 has the lowest number of seats compared to students.
Cumulative count of afterschool seats by distance to student residence for PK3 to grade 8 (average by ward)
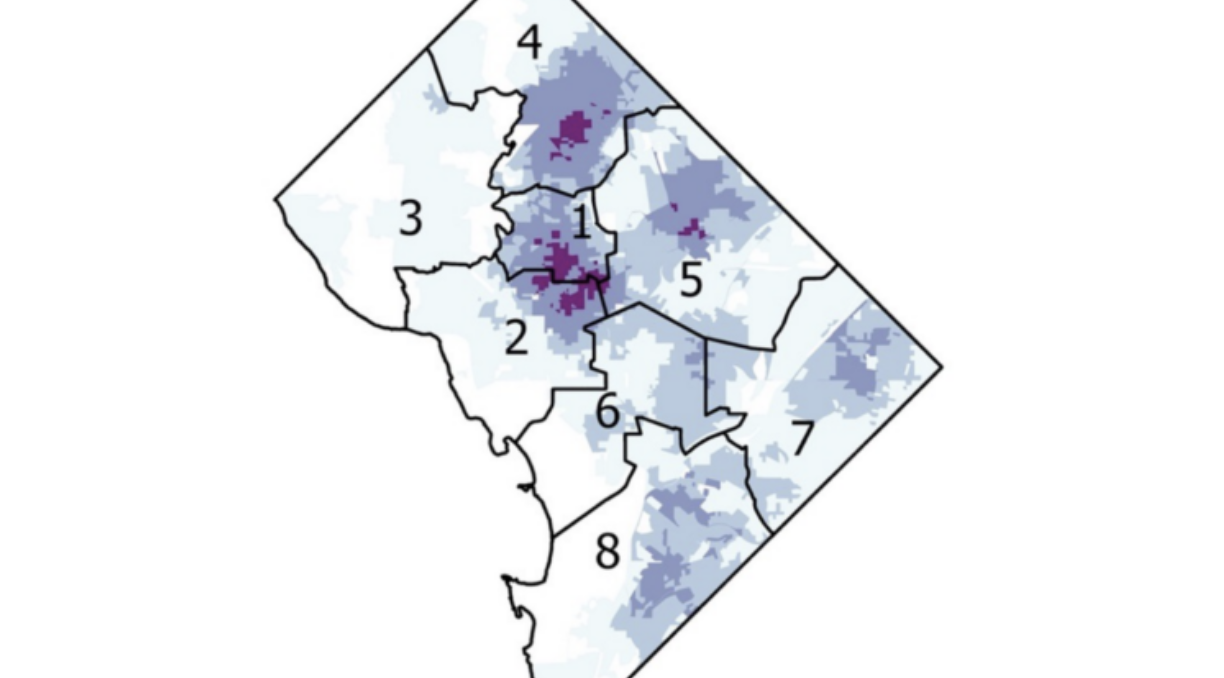
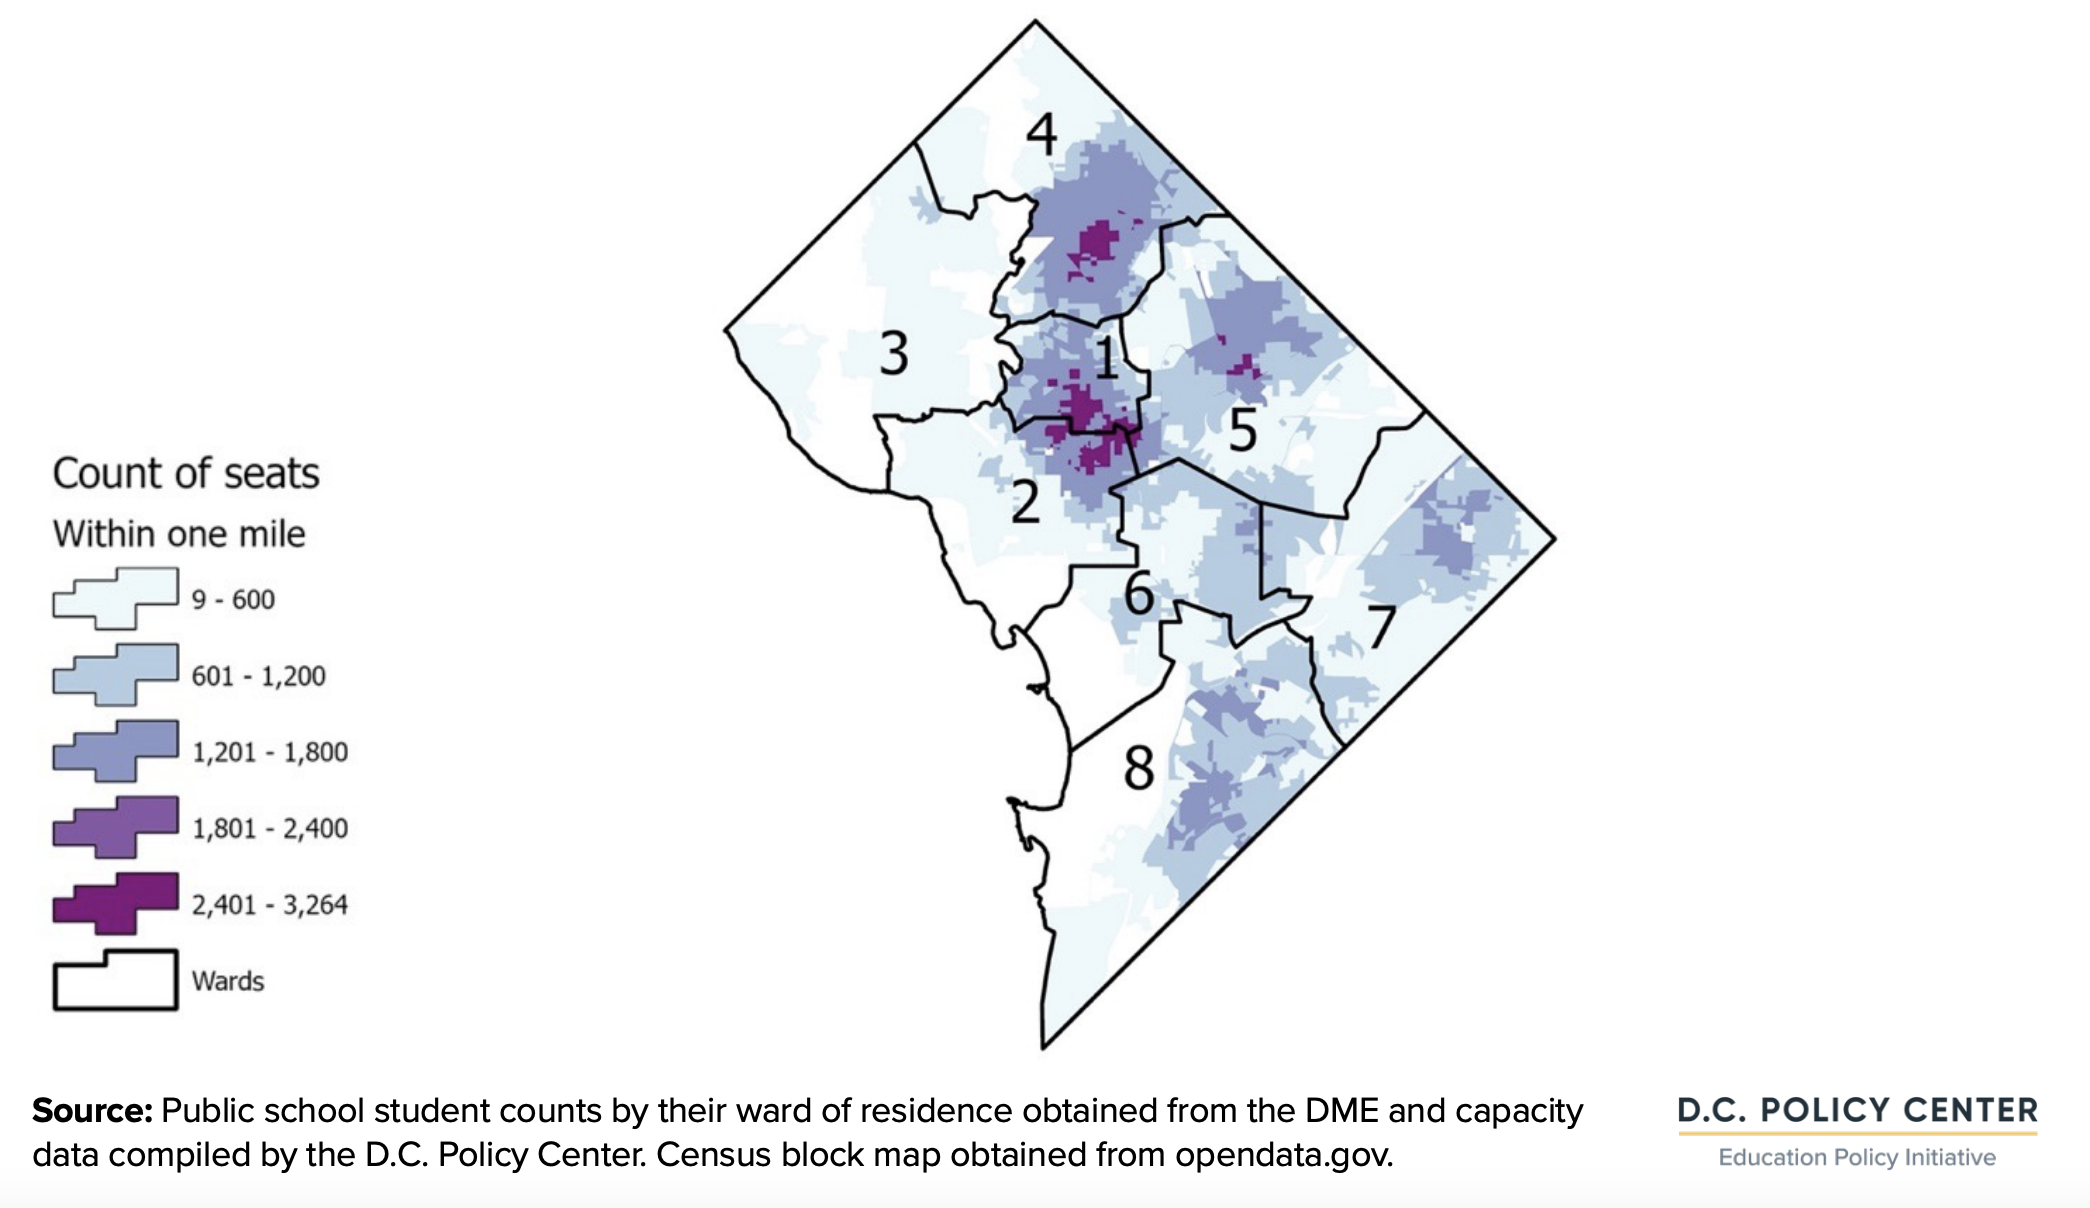
The darkest purple areas shown in the map have over 2,500 seats within a mile per student. Ward 3 and large swaths of Wards 6, 7, and 8 stand out in this map for their relative dearth of seats as compared to the number of students living in those areas.
PK3 to grade 8 afterschool seats within one mile of students’ homes
Distance-weighted modeling: What if families are willing to travel for OST programs?
While finding an OST seat close to home is important to many families, many students attend a school other than their by-right school, and if they attend afterschool programs at their schools, then families must travel the longer distance from school to home. To capture this, we built a distance-weighted supply and demand model, which assumes that every seat is potentially open to every student, but families attach greater weight to nearby seats and a lower weight to seats that are further away.
Our model assumes that programs closest to where children live are most accessible, and that in areas where there are large amounts of students, there will be greater competition for OST seats.
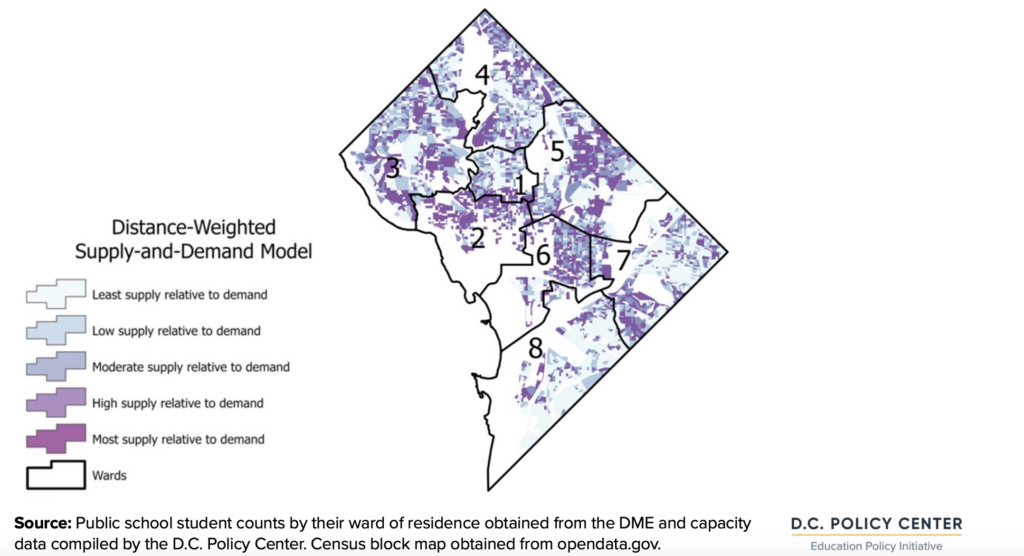
Under this distance-weighted model, Wards 2 and 3 light up, because there are more seats that are closer to the relatively fewer children living there. However, like in the map of seats within a mile of each student, Wards 7 and 8 have very few afterschool seats serving students attending PK3 through grade 8 as compared to the number of students living there.
Distance-weighted supply and demand model for afterschool seats, PK3 to grade 8, school year 21-22
More information on where D.C. public school students live and go to school, capacity of OST programs and locations, estimated gaps across the city and at the neighborhood level, and the experience of providers and families are included in our report, Needs assessment of out-of-school time programs in the District of Columbia.