Previously: How the D.C. area’s population density has changed since 1970; How household incomes in the D.C. area have changed since 1980; How the region’s racial and ethnic demographics have changed since 1970
In November, I found that the spatial distribution of wealth in the D.C. area has remained relatively constant over the past 40 years. The spatial distribution of education levels among adults over the past 50 years has been similar to the distribution of wealth, but there have been some notable changes over the past half-century.
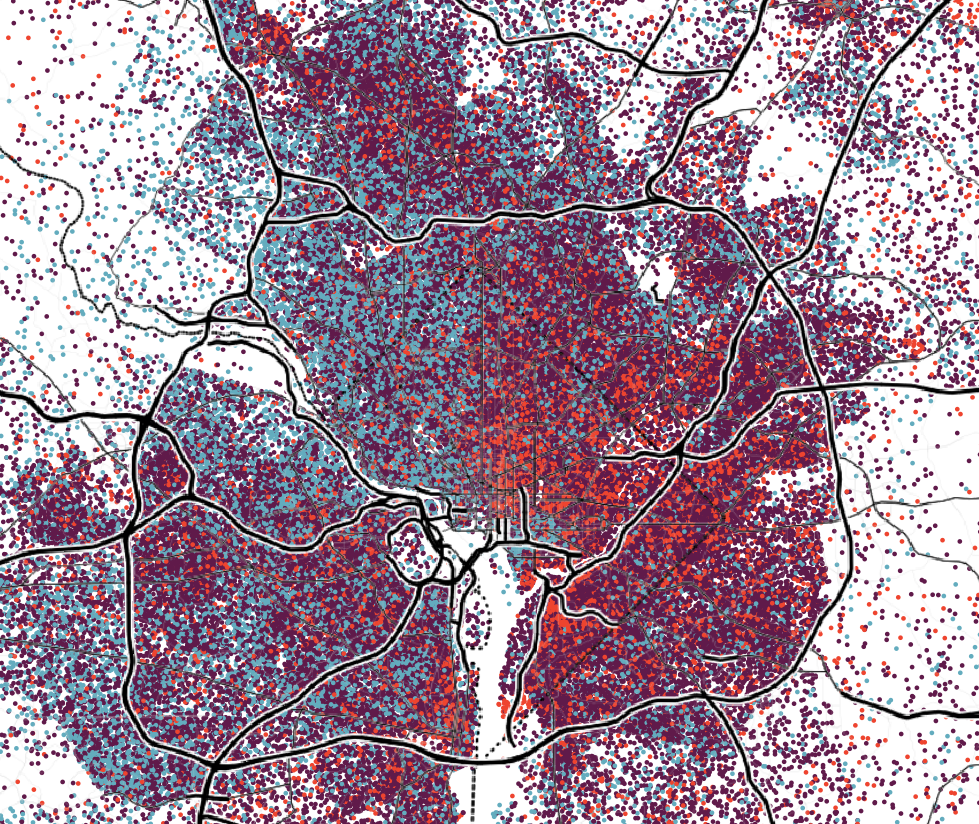
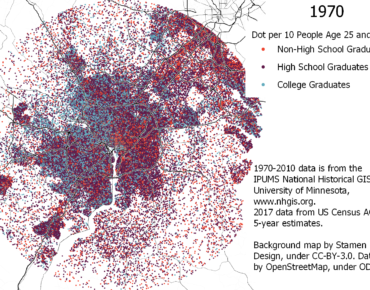
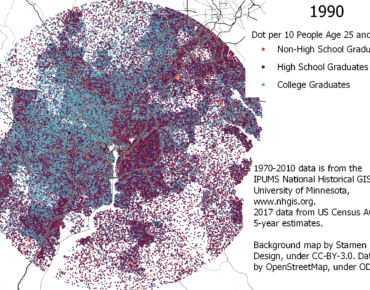
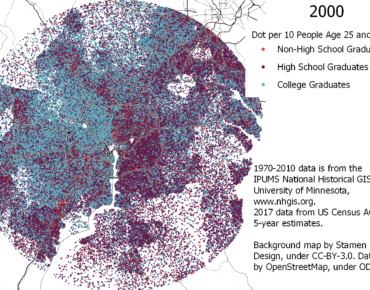
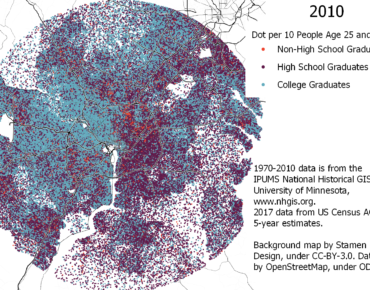
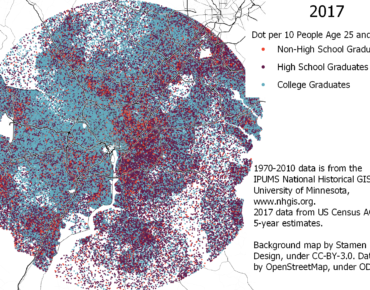
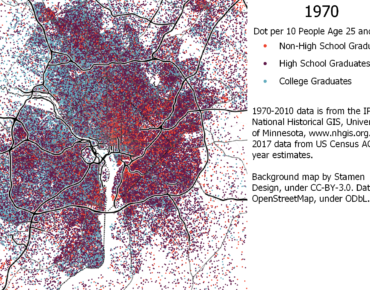
Using data from the 1970 through 2010 Censuses provided by the IPUMS National Historical GIS project at the University of Minnesota and 2017 data from the US Census Bureau’s American Community Survey, I created maps of the distribution of adults ages 25 and up with each census tract within 50 kilometers of the US Capitol. Every ten adults at a given education level—no high school diploma, high school graduates without a college degree, and college graduates with at least a bachelor’s degree—are represented with a color-coded dot randomly located within the census tract where they reside.
The resulting maps show that the region’s east-west economic divide, which was already becoming established in 1980, was already visible in the distribution of college degrees 10 years earlier, in 1970. Data from the 1970 Decennial Census shows a clear concentration of residents with bachelor’s degrees on both sides of the Potomac upstream of downtown D.C., with less dense concentrations in other parts of Fairfax and Arlington counties and western Alexandria, along with Bowie and Montgomery County north of the Beltway.
How the spatial distribution of education levels shifted since 1970
-

- 1970
-
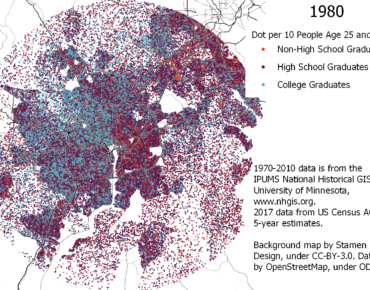
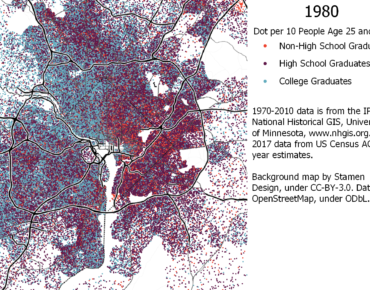
- 1980
-
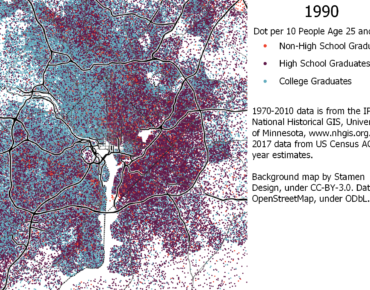
- 1990
-
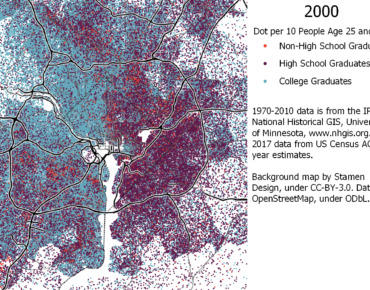
- 2000
-
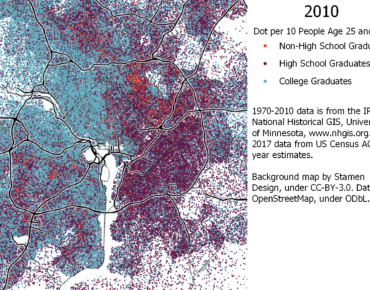
- 2010
-
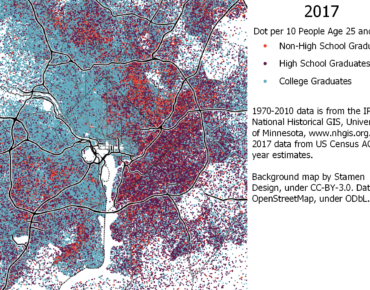
- 2017
Source: Data from 1970 through 2010 Decennial Censuses from the IPUMS National Historical GIS project at the University of Minnesota; 2017 data from the U.S. Census Bureau’s American Community Survey.
On the other hand, in 1970, a sizable fraction of the adults in eastern Alexandria and the District east of 16th Street, NW did not have high school diplomas. Adults without high school diplomas were also common in downtown Rockville and in Prince George’s County south of Maryland Route 410 and northwest of the Baltimore-Washington Parkway, as well as along the US Route 1 Corridor in Laurel and Howard County.
By 1980, college degrees were already becoming significantly more common in the Washington region, including in a number of outlying areas where they had been rare in 1970. However, the District east of 16th Street and Prince George’s County south of US Route 50 and inside the Beltway continued to have numbers of adults who had not graduated high school comparable to or higher than their numbers of adults with bachelor’s degrees.
From 1990 to the present, the outer suburbs have largely been dominated by adults with bachelor’s degrees. However, the District east of 16th Street remained a cluster of non-college-graduate adults through the 2010 Census, and still has large clusters of them, particularly east of the Anacostia. Prince George’s County south of Route 50 and inside or directly south of the Beltway has also remained a cluster of adults without bachelor’s degrees, but this is no longer the least-educated region of the county, as it was through 1990 or 2000.
In the 2000 Census, a large cluster of adults without high school diplomas was visible in Langley Park; by 2010, this cluster had grown and significantly more adults without high school diplomas were present in the portion of the county between Maryland Route 410 and Eastern Avenue. Adults without high school diplomas seem to be even more common in the 2017 data: particularly in Prince George’s County inside the Beltway and north of US-50, but also along the Viers Mill Road corridor in Montgomery County and the Columbia Pike and Richmond Highway corridors in Fairfax County.
How the spatial distribution of education shifted within the beltway over the past 50 years
-
- 1970
-
- 1980
-
- 1990
-
- 2000
-
- 2010
-
- 2017
Source: Data from 1970 through 2010 Decennial Censuses from the IPUMS National Historical GIS project at the University of Minnesota; 2017 data from the U.S. Census Bureau’s American Community Survey.
These clusters of adults without high school diplomas do seem to particularly be clustered in parts of the region which have seen large influxes of low-income immigrants in recent years. However, it is not clear whether this is primarily due to large numbers of people who have not had the equivalent of a high school education, or to people who received their education in other countries being unsure whether it qualifies as equivalent to an American high school diploma.
About the Data
The analysis and maps in this article are based on data from decennial censuses accessed through the IPUMS National Historical Geographic Information System (NHGIS) project at the University of Minnesota. Although the US Census Bureau’s online data portal only provides relatively recent data, NHGIS has digitized a large amount of older data from decennial censuses going back at least to the start of the 20th century. However, the education level data at the census tract level that I used for these maps is only available starting with the 1970 Census.
Using the NHGIS data from the 1970 through 2010 Decennial Censuses, along with 2017 ACS 5-year data obtained directly from the Census Bureau’s online data portal, I mapped educational levels by randomly placing one dot per ten adult residents with a given educational level in the land area of each census tract in the District of Columbia; Prince George’s, Montgomery, Charles, Calvert, Anne Arundel, and Howard Counties in Maryland; and Arlington County, the City of Alexandria, Fairfax County, the City of Falls Church, the City of Fairfax, the City of Manassas, the City of Manassas Park, Prince William County, and Loudon County in Virginia. For the 1970 and 1980 Censuses, when some of the outlying counties were not divided into census tracts, I used minor civil divisions in place of census tracts for those counties. I then cropped the resulting maps to a circle 50 kilometer in radius centered on the US Capitol.
Previously: How the D.C. area’s population density has changed since 1970; How household incomes in the D.C. area have changed since 1980; How the region’s racial and ethnic demographics have changed since 1970
Feature image: A map of the region by education in 1970. Image by the author. This article also appeared at Greater Greater Washington.
DW Rowlands is a human geography grad student and Prince George’s County native, currently living in College Park. More of their writing on transportation-related and other topics can be found on their website. They also write for Greater Greater Washington, where they are on the Elections Committee. In their spare time, they volunteer for Prince George’s Advocates for Community-Based Transit. However, the views expressed here are their own.