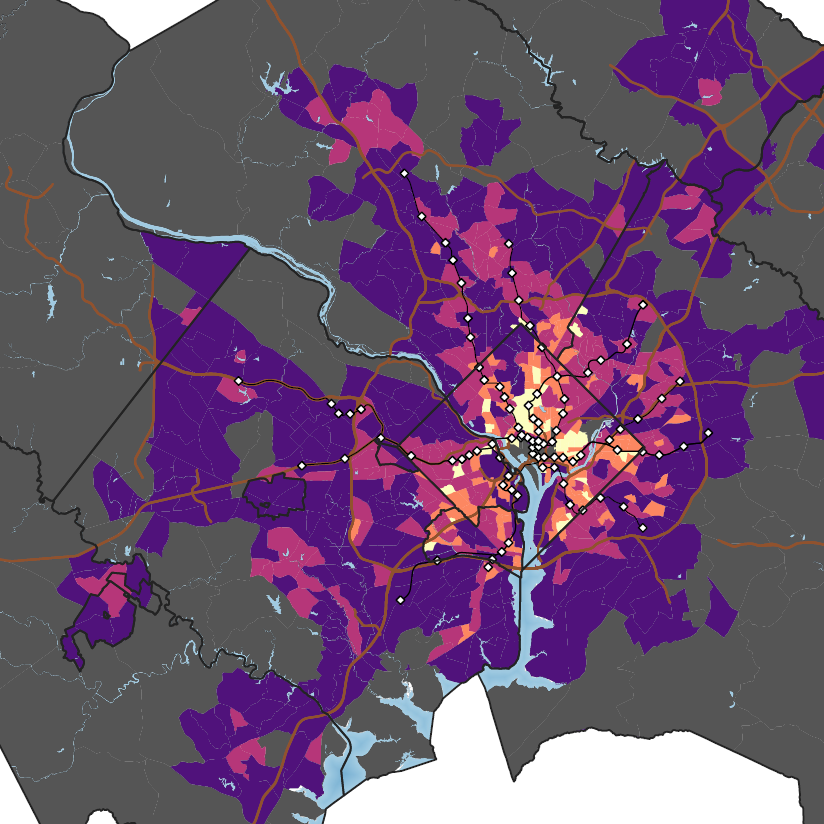
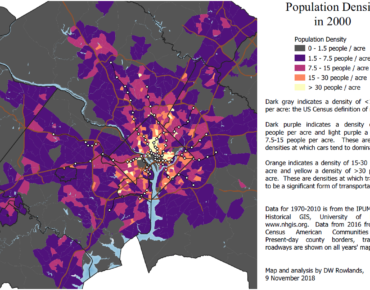
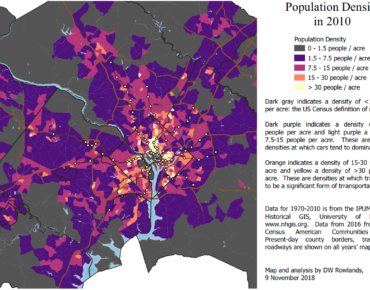
Historical distributions of population in the D.C. metro area
D.C.’s population growth has slowed since the 2009 boom ten years ago, but the population still continues to climb. In December, the U.S. Census Bureau announced that D.C.’s population reached 702,455, officially passing the 700,000 mark.
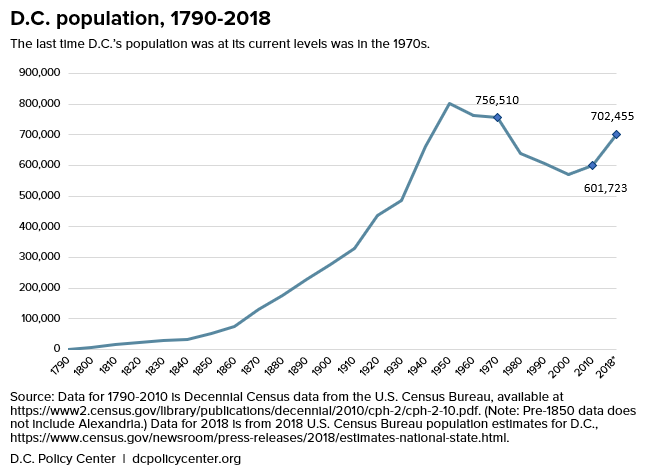
As District Measured has noted, D.C.’s population has been at the same point twice in the past, most recently in the 1970s. However, D.C. is in a very different place than it was over 40 years ago. Not only have the city’s demographic profile and economic trajectory shifted dramatically, but where people live, and in what configurations, has changed as well: over time, residential areas have shifted from downtown outward, households are smaller[1] (but more numerous), and the introduction of Metro has changed the transportation geography significantly. The D.C. metropolitan region has seen significant changes in population and density as well.
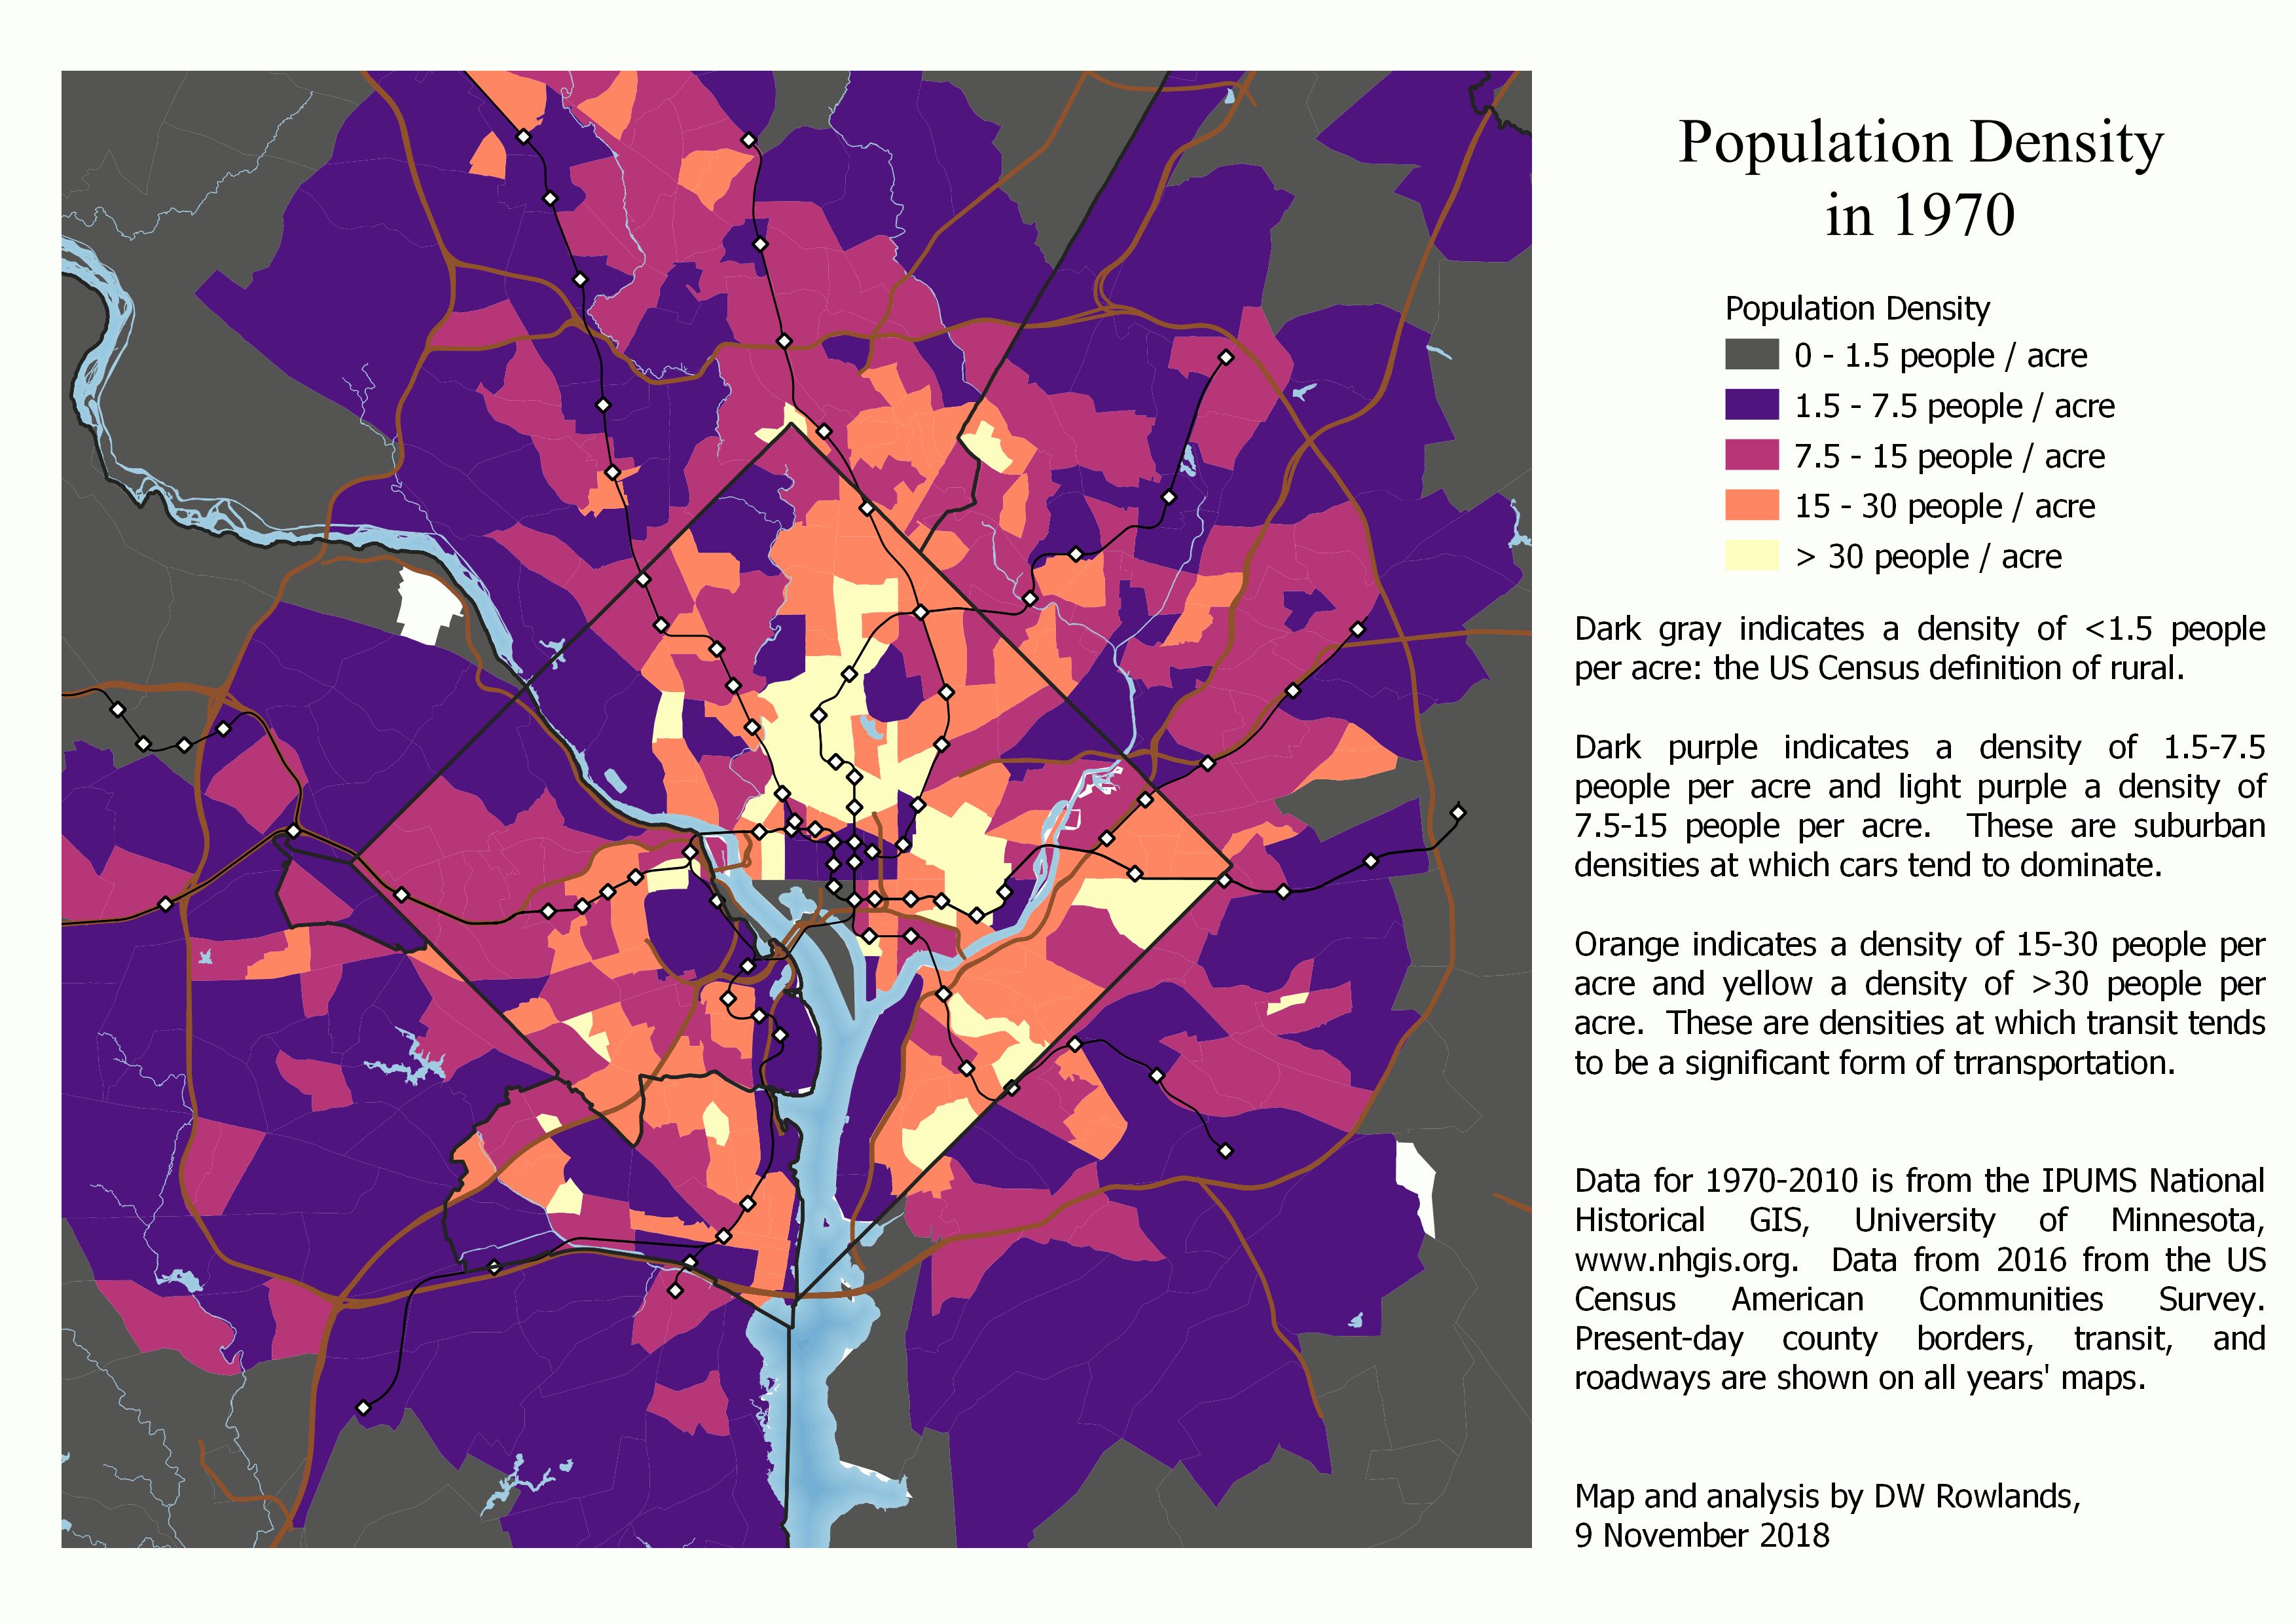
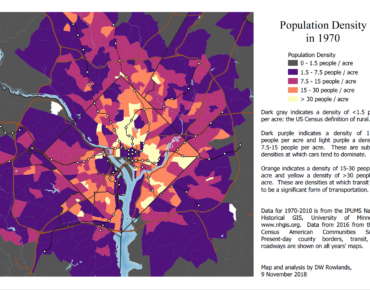
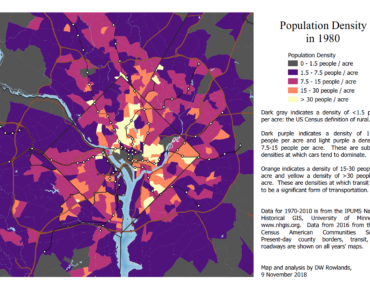
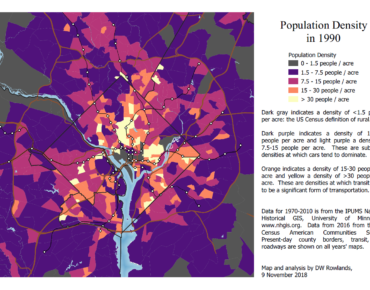
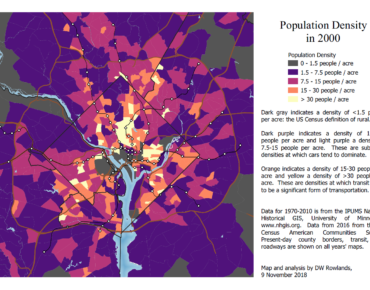
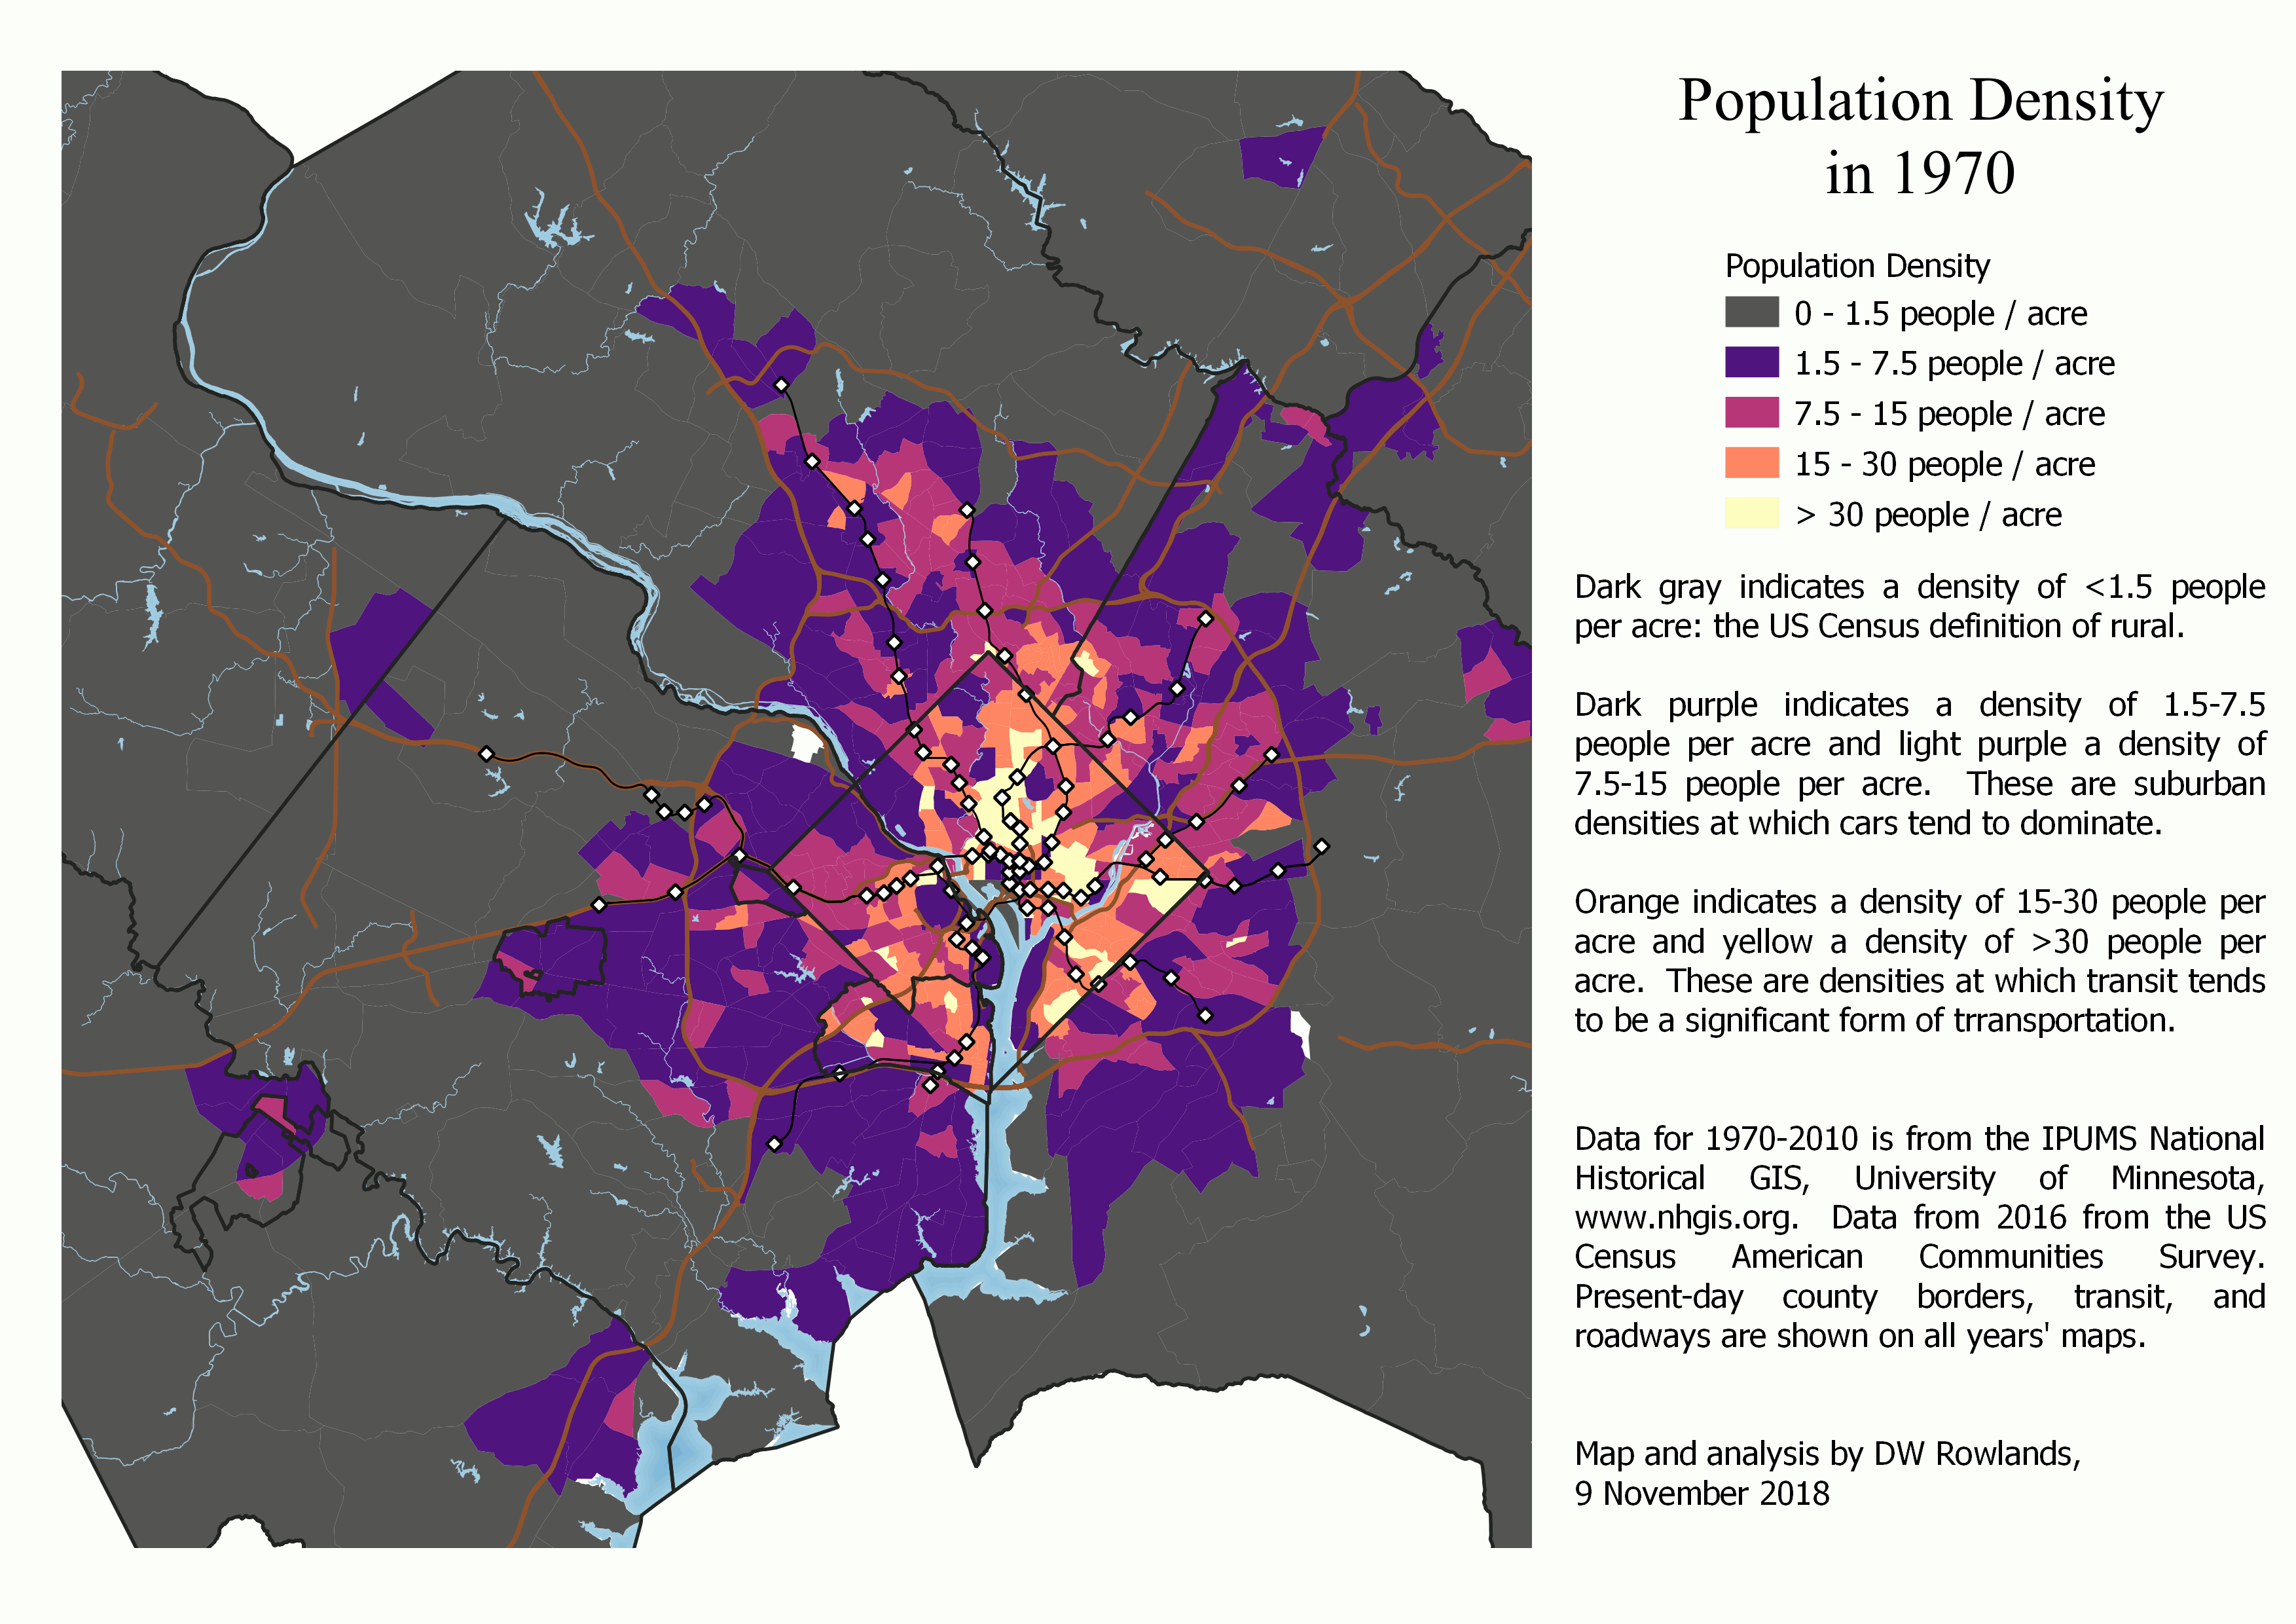
How the D.C. area’s population density changed between 1970 and 2010
Using data from the 1970 through 2010 Decennial Censuses, I mapped the population density of each census tract in the District of Columbia; Prince George’s, Montgomery, Anne Arundel, and Howard Counties in Maryland; and Arlington County, the City of Alexandria, Fairfax County, the City of Falls Church, the City of Fairfax, the City of Manassas, the City of Manassas Park, Prince William County, and Loudon County in Virginia. (Although Anne Arundel and Howard Counties are formally part of the Census’s Baltimore Metropolitan Statistical Area, not the Metropolitan Statistical Area for D.C., I’m including them here because they do contain significant numbers of people who commute to the District.)
-

- 1970
-
- 1980
-
- 1990
-
- 2000
-
- 2010
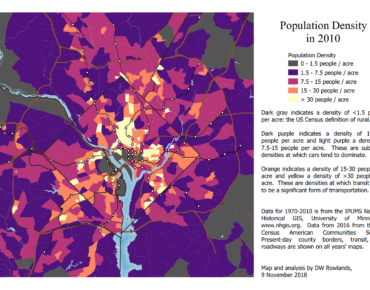
Even in 1970, a significant portion of the D.C. area’s population lived outside of the District of Columbia. Nearly every census tract within the Beltway had a substantial population, and in Fairfax and particularly Montgomery Counties, the suburbs clearly extended significantly outside the Beltway.
Although the population densities of the suburbs generally increased, and the suburban zone expanded outward in each decennial census, the District’s main populated cores in the Mid-City and east of Capitol Hill decreased in density each decade until the 2010 Census, when they seem to have started recovering. A similar hollowing-out effect is visible in the neighborhoods east of the Anacostia.
Interestingly, the two main areas of the region with significant densities of suburban transit riders who don’t live near Metrorail stations, Langley Park on the Prince George’s/Montgomery County border and Columbia Pike in Arlington, had notably high population densities for areas outside the District even in 1970. Although the demographics of these areas have changed, they have remained among the region’s denser suburban areas even without rail transit access.
D.C.’s suburbs have become more dense, but sprawl has also increased
To really grasp the scale of the expansion of the region’s suburbs since 1970, however, it is necessary to examine the region at a larger scale. In 1970, the District and its immediate suburbs formed a rough diamond with sides twenty miles long, with a shape determined more by commuter rail lines and arterial roads than by the freeway network that was still under construction.
In Prince George’s County, there was little population outside the Beltway, except in the Levitt & Sons Belair development in Bowie, which was only completed five years earlier, and in the 19th-century railroad mill town of Laurel. Montgomery County had significant suburban development on both sides of Rock Creek as far north as Rockville, but virtually nothing north of the present-day route of the Inter-County Connector (MD-200). And, in Virginia, Tysons Corner, Fairfax City, and Springfield were at the outer edge of the suburban zone, though isolated population clusters are found In Manassas, Woodbridge, and near Dulles.
-
- 1970
-
- 1980
-
- 1990
-
- 2000
-
- 2010
The shape of the 1970 population distribution in the region helps explain why Metro lines in Montgomery and Fairfax Counties extend well beyond the Beltway, while those in Prince George’s County do not. The Metrorail system was planned in the 1960s, and each of the original lines ends roughly at the edge of suburban population densities in 1970. Over the next forty years, however, the suburbs grew outward in every direction, though particularly to the north (along the I-270 corridor) and to the west (along the Dulles Toll Road, I-66, and I 95).
Over the 40-year period shown in the density maps, inner suburban densities did increase, though rarely to levels where car-dependence breaks down. However, the lower-density inner suburbs were replaced by a rapidly growing swath of low-density suburbs further and further outside the Beltway.
In my next article, I’ll examine how the distribution of residents by race and ethnicity changed across the metropolitan area since 1970 as well.
About the data
The analysis and maps in this article are based on data from decennial censuses accessed through the IPUMS National Historical Geographic Information System (NHGIS) project at the University of Minnesota. Although the U.S. Census Bureau’s online data portal only provides relatively recent data, NHGIS has digitized a large amount of older data from decennial censuses going back at least to the start of the 20th Century. However, since census tracts were first defined for the inner-ring suburban counties in the D.C. region in the 1970 Census, useful data for examining population distribution in the region as a whole is not easily available before 1970.
Using the NHGIS data from the 1970 through 2010 Decennial Censuses, I mapped the population density of each census tract in the District of Columbia; Prince George’s, Montgomery, Anne Arundel, and Howard Counties in Maryland; and Arlington County, the City of Alexandria, Fairfax County, the City of Falls Church, the City of Fairfax, the City of Manassas, the City of Manassas Park, Prince William County, and Loudon County in Virginia. Although Anne Arundel and Howard Counties are formally part of the Census’s Baltimore Metropolitan Statistical Area, I included them in analyses of population changes in the D.C. area because roughly 25 percent of workers living in these counties commute to D.C. and its suburbs.
Notes
[1] The average household size fell from 2.72 in 1970 to 2.28 in 2017.
Feature image: Regional density in 1990. Image by DW Rowlands.
DW Rowlands is a human geography grad student and Prince George’s County native, currently living in College Park. More of their writing on transportation-related and other topics can be found on their website. They also write for Greater Greater Washington, where they are on the Elections Committee. In their spare time, they volunteer for Prince George’s Advocates for Community-Based Transit. However, the views expressed here are their own.