
The D.C. Policy Center report, “Schools in the Neighborhood: Can Neighborhood Characteristics Explain Enrollment at In-Boundary Schools?”, examines the connections between neighborhood characteristics and boundary school enrollment rates among the District of Columbia’s public school students to identify commonalities across school neighborhoods that draw higher proportions of in-boundary students.
The most important indicator of high boundary participation rates at the elementary school level is access to a predictable elementary-to-high school feeder pattern. Specifically, location within the feeder pattern for Wilson High School, the District’s top-performing in-boundary high school, outweighs all other neighborhood aspects in explaining the differences in boundary participation rates across neighborhoods, beginning as early as the pre-kindergarten years. Families who live outside the Wilson boundary area, on the other hand, are more likely to rely on options other than their in-boundary school.
The findings in this study are based on an analysis of demographic, economic, and other characteristics of 109 neighborhoods around each DCPS in-boundary school and their relation to patterns of enrollment at in-boundary schools, out-of-boundary schools, and public charter schools.
A summary of the report’s key findings can be found here, and a PDF version of the report can be downloaded here. Access the data and methodology here, and explore the data here.
ONE | Introduction: What are public school enrollment patterns in the District of Columbia, and what could explain them?
Three-quarters of public school students in the District of Columbia attend a school other than their in-boundary[1] school. But boundary participation rates, or the percentage of public school students who attend the in-boundary school for the neighborhood where they live, vary widely across the city and are extremely high in several adjoining neighborhoods. Existing research has examined the role that school quality plays in families’ school choices, but because boundary participation rates diverge based on location, it is possible that school enrollment patterns are related to neighborhood characteristics. This study seeks to help explain school enrollment patterns in the District’s complex education landscape by determining the extent to which neighborhood characteristics vary with boundary participation.
Public school enrollment in D.C.
After years of decline, public school enrollment has been increasing in the District since school year 2009-10. This growth began with the expansion of public charter schools, and later with concurrent expansions of both DCPS and charter schools. Enrollment had dropped from 145,704 students in school year 1970-71 (United States Department of Education, 1998) to 80,674 students 20 years later, and continued to fall to a low point of 71,280 in school year 2008-09 (see Figure 1). After Congress passed the School Reform Act in 1995, the District’s first public charter schools opened in 1996 with 160 students. Over the 20 years that followed, public charter school enrollment continued to grow, and charters accounted for 47 percent of all public school students in school year 2017-18. Total enrollment began to turn around, and DCPS enrollment stabilized in school year 2009-10, two years after the D.C. Council placed schools under mayoral control.
Figure 1. Public school enrollment has increased along with enrollment in public charter schools

Enrollment growth partly came from families[2] with school-aged children who live in D.C. increasingly opting into public schools: over the last 10 years, public school enrollment has grown by 29 percent (Office of the State Superintendent, 2017), even as D.C.’s population aged 5 to 17 years shrank by 3 percent (United States Census Bureau, 2016). The total population under 18 has been steadily increasing since 2010 after 15 years of decline, but this has been largely driven by an increase in the population under 6 (Taylor, 2016). The city continues to struggle to retain families with older children (Moored & Metcalf, 2015). This is exhibited by an especially large increase in enrollments for younger students, which has not yet translated into similar growth at later grades. Over the last 10 years, enrollment in pre-kindergarten increased by 72 percent (over 5,000 students), mainly because of the expansion of pre-kindergarten,[3] and enrollment in kindergarten through grade 5 increased by 37 percent. Over the same period, middle school enrollment grew by just 8 percent, and high school enrollment declined by 3 percent (see Figure 2).
Figure 2. Enrollment has especially increased in pre-kindergarten through grade 5

As enrollments have increased, a higher proportion of public school students are deciding to attend a school other than their in-boundary school. In school year 2016-17 (the year of focus for our study), 27 percent of public school students attended their in-boundary school, and 73 percent attended a school other than their in-boundary option. The breakdown of this 73 percent across different options (aside from in-boundary) is as follows: 46 percent of public school students attended a public charter school; 21 percent attended an out-of-boundary DCPS school;[4] and the remaining 6 percent attended other DCPS schools[5] (Office of the Deputy Mayor for Education, 2017). Elementary school students attend in-boundary schools at the highest rates, and middle school students are most likely to attend a public charter school (see Figure 3). However, the share of students in charter schools declines at the high school level as DCPS options become more popular when DCPS high school options that require an application—alternatives not available at the middle school level—enroll 20 percent of all public school students.
Figure 3. Enrollment at in-boundary schools is highest in elementary grades

Literature review
Many factors influence school enrollment choices. When asked directly what matters to them most, parents frequently emphasize academics. In national surveys, parents[6] often state that academic performance is their top priority when deciding on a school, especially one that is not their in-boundary school (Tedin & Weiher, 2004). In the District, a 2014 survey of 500 public school parents confirmed this finding: 80 percent of parents said that they chose a school based on academics instead of school safety or location (Jochim, M. DeArmond, & Lake, 2014).
The reported importance of academics does not, however, always translate into actual choices. Research that examines revealed preferences shows that that parents also value non-academic factors that are related to demographics and location (Abdulkadiroglu, Pathak, Schellenberg, & Walters, 2017). A recent study of how parents rank their preferences when they apply to the District’s common lottery found that parents care about academic outcomes, but they also generally prefer schools close to home and exhibit an “own-group” preference for race and ethnicity when ranking schools (Glazerman & Dotter, 2016). That is, parents prefer schools where most students have racial, ethnic, or socioeconomic backgrounds like their own children. This echoed findings from a previous study that analyzed information search patterns on the District’s first public school information site and revealed that parents were most interested in demographic characteristics of the student population, followed by location, and, only then, academic performance (Schneider & Buckley, 2002).
If some families express their school choice by moving in or out of neighborhoods (Holme, 2002), then it would be possible to find some indirect evidence for the importance of neighborhood characteristics in school choice, especially since public schools are highly segregated in the District, even when compared to surrounding jurisdictions (Orfield & Ee, 2017). To be sure, public school segregation in the District has decreased over time, a trend that appears to be driven by areas experiencing gentrification, but many white parents still seem to be opting out of in-boundary schools (Mordechay & Ayscue, 2017) for public charter schools, out-of-boundary schools, or private schools.[7]
Neighborhoods are also a key factor in school choice because of amenities and conveniences such as access to transportation. The District is a relatively small city and allows its students to ride Metrobus or Metrorail at no cost through the Kids Ride Free program, but does not offer public school transportation. Data show that transportation to school can present a constraint to enrolling at a school farther from home: 23 percent of surveyed parents reported difficulty finding transportation so their child could attend school, and 43 percent reported driving to school (Campbell, Heyward, & Gross, 2017). According to a recent Urban Institute report, 43 percent of D.C.’s students use a car to travel to school, but 51 percent of households in D.C.’s highest poverty areas do not own a car (Urban Institute Student Transportation Working Group, 2018).
This study is primarily focused on identifying the links between schools and the neighborhoods in which they are located. Location and demographics, two key influencers of school preferences, are linked to the neighborhoods where schools are located, as most in-boundary schools draw primarily from students living in the surrounding area. Many studies focus on the role of school factors such as academic performance and teacher quality in determining school choices, but given the connection between demographics, location, and school participation, our study examines whether observable neighborhood characteristics can explain choosing an in-boundary school. We identify which neighborhood characteristics, if any, are associated with in-boundary schools that have the highest boundary participation rates, and identify schools that have higher or lower boundary participation rates than expected given the characteristics of their boundary neighborhood.
TWO | Is public school enrollment systematically different across different neighborhoods?
We begin our analysis by examining whether there are differences in characteristics across neighborhoods with various levels of boundary participation rates. To do so, we compare neighborhood characteristics of school neighborhoods with high and low boundary participation.
Our dataset combines data from local sources with U.S. Census Bureau data to assemble a profile of neighborhood characteristics and school enrollment patterns for 109 school boundaries. Here, we introduce our data with a summary of school participation rates and descriptive statistics of neighborhood characteristics.
Data
Enrollment and participation
We rely on a dataset produced by the Office of the Deputy Mayor for Education (DME) on where pre-kindergarten through grade 12 students lived and attended school in school year 2016-17. This dataset provides the number of grade-appropriate students who live in each DCPS boundary, the names of schools attended by students living in each boundary, and the number of students from the boundary who attend each school if there are more than 10 students from that boundary attending a particular school. This dataset allows us to identify neighborhoods with the highest boundary participation rates and estimate flows to out-of-boundary DCPS and public charter schools. The dataset is limited to public school enrollments and does not include any enrollment data for students who receive vouchers through the District’s Opportunity Scholarship Program or attend private schools.
We also use publicly available data from the Office of the State Superintendent (OSSE) on student demographics for school year 2016-17 and school addresses for 2016-17 from DME to count the number of public charter schools in each school boundary. School addresses have been changed to permanent locations for in-boundary schools that were in swing spaces while the sites underwent modernizations.
Neighborhoods
To measure which school neighborhood characteristics can explain boundary participation rates, one must define “neighborhoods.” In the District, the term is sometimes used to denote zoning areas, and at other times is used to define tax assessment units or administrative borders. This study defines neighborhoods geographically by school boundaries because living within a school boundary guarantees a slot (or a preference, for pre-kindergarten students) at the in-boundary school.
We use U.S. Census Bureau 2012-2016 American Community Survey (ACS) 5-Year Estimates at the Census Block Group level to construct school boundary neighborhoods. Census Block Groups are a statistical subdivision of a census tract, and are designed to represent between 600 and 3,000 people. We use Census Block Groups because they are the smallest geographic unit for which the Census Bureau tabulates sample data. The relatively smaller size of Census Block Groups (compared to tracts) allows us to most closely match school boundary neighborhoods. But because Census Block Groups are small, single-year estimates are not reliable (and not published by the Census Bureau). Therefore, we use 5-year estimates that combine 60 months of data. We then combine ACS data with data from local sources (violent crime incidents from the Metropolitan Police Department (MPD), the number of Metrobus and Metrorail stations from Washington Metropolitan Area Transit Authority (WMATA), and the number of Circulator bus stops from the District Department of Transportation (DDOT)).
We also consider the following neighborhood characteristics: [8]
- Indicators of neighborhood change: the change in and proportion of African American[9] and school-age populations;
- Indicators of economic opportunity: poverty rates,[10] the proportion of households headed by single mothers, the proportion of residents with a high school education, and home ownership rates; and
- General neighborhood attributes that may influence school choice: the number of public charter schools, number of bus and metro stops, and violent crime rates.
How does school participation vary across neighborhoods?
In D.C., students can choose to attend their in-boundary school or apply through a lottery to attend a public charter school or an out-of-boundary DCPS school.[11] In school year 2016-17, the District had 107 DCPS schools and 109 public charter schools serving pre-kindergarten through grade 12 students. DCPS schools offered 74 in-boundary elementary schools (including 12 education campuses), 26 in-boundary middle schools (including 14 education campuses), and nine in-boundary high schools (excluding application high schools).
Boundary participation rates are highest in elementary school
Boundary participation rates show how many public school students who have a right to attend a particular DCPS school choose to enroll in that school.[12] Median boundary participation rates across schools are highest at the elementary level at 29 percent, and decline at upper grades to 21 percent at the middle school level and 19 percent among high schools (see Figure 4 and Appendix Table 2). Public charter participation rates, by comparison, show the share of students living within a public school boundary who attend a public charter school anywhere in the city, and are highest in middle school grades.[13]
Figure 4. Elementary schools have the highest boundary participation rates, and participation in public charter schools is highest for middle school students

Explore an interactive version of this figure in a new tab
Some in-boundary elementary schools have particularly high boundary participation rates, but most elementary schools are clustered around a boundary participation rate of 40 percent or less. We identify 19 elementary schools that draw the highest proportion of students from their neighborhoods as having boundary participation rates above 75th percentile or 39.5 percent.[14] There are 11 outlier schools[15] that draw more than 65 percent of students from their neighborhoods. See Figure 5 for participation rates by school type and neighborhood.
Figure 5. Boundary participation rates for different types of elementary schools

Explore an interactive version of this figure in a new tab
Elementary boundary participation rates are highest in the westernmost part of D.C., with additional pockets of high boundary participation in Capitol Hill (Brent ES, Tyler ES, Maury ES, and Watkins ES). Public charter school participation rates are higher in the eastern part of the city. Out-of-boundary participation rates (the percentage of students living in a boundary and attending a DCPS school other than their in-boundary school) for elementary school neighborhoods are higher in a few neighborhoods along the city’s central corridor, and especially in a few neighborhoods close to the high boundary participation rate schools (near Capitol Hill, and bordering the Wilson HS feeder schools).
Public charter school participation rates are highest in middle school
Two middle schools are outliers in terms of boundary participation rates, attended by at least 70 percent of students who live in-boundary, but the other 24 in-boundary middle schools have boundary participation rates of 40 percent or less (see Figure 6). We identify six in-boundary middle schools as the schools that draw the highest proportion of in-boundary students, or more than the 75th percentile of 33 percent of students from their neighborhood (see Appendix Table 4 for the middle schools with the highest boundary participation rates). Public charter school participation rates are fairly uniform outside of upper Northwest. Out-of-boundary participation rates are lower where boundary participation is highest, and higher in a few school boundary neighborhoods closest to the middle school with the highest boundary participation rate.
Figure 6. Boundary participation rates generally fade in middle school

Explore an interactive version of this figure in a new tab
Out-of-boundary participation increases in high school
Enrollment at out-of-boundary schools is higher in high schools in part because 20 percent of all public high school students attend DCPS application high schools, which require students to submit an application and admit students based on specific criteria or eligibility requirements. Three high schools draw the highest proportion of in-boundary students (Figure 7), with boundary participation rates above the 75th percentile of 22 percent: Wilson HS (also an outlier, with the highest boundary participation rate at 68 percent), Ballou HS (27 percent), and Eastern HS (22 percent).
Figure 7. High school boundary participation is highest for Wilson HS

Explore an interactive version of this figure in a new tab
The high school neighborhoods with the highest out-of-boundary enrollment are adjacent to the Wilson HS boundary (which, as noted previously, has the highest boundary participation rate). Public charter school participation rates for high schools are highest east of the Anacostia River.
How does Wilson High School fit into the District’s high school landscape?
Our findings highlight the unique role of Wilson High School in the District’s education landscape. Some descriptive statistics about Wilson already suggest it is very different from the rest of the high schools in the District. During school year 2016-17, Wilson HS had the highest enrollment of any high school, at 1,749 students (the average high school enrollment was 460 students). It also had the longest waitlists, with 347 students for the incoming freshman class (Washington Latin PCS had the next longest waitlist for grade 9, at 258 students). It is also the only in-boundary high school where more than half of students met or exceeded expectations on the state assessment in English Language Arts (compared next highest in-boundary high school score of 20 percent) or where more than 20 percent of students met or exceeded expectations on the mathematics state assessment (compared to next highest score of 4 percent at an in-boundary high school) in school year 2016-17.
Private schools are a frequently used alternative in the District
There is little detailed data on private school enrollment in the District, but for students in kindergarten through grade 12, ACS data summaries indicate that approximately 16 percent of kindergarten through grade 12 students are enrolled in private schools.[16]
Figure 8 shows private school enrollment patterns by high school boundary neighborhood aggregated from Census Block Groups, as patterns by elementary school boundary neighborhood did not have large enough sample sizes to report. The highest private school enrollment rate (44 percent[17]) is found within the Wilson HS boundary neighborhood, which is also where the highest share of public school students attend their in-boundary school. Private school enrollment rates and patterns show that families in areas where boundary participation rates are highest also weigh the option of attending their in-boundary school in similar proportion to the rest of the city. The lowest private school enrollment rate (4 percent) is found within the Anacostia school boundary neighborhood in southeast D.C., which is where public charter school participation rates are highest.
Figure 8. Private school enrollment In all grades is highest within the Wilson HS boundary
Figure 8. Private school enrollment In all grades is highest within the Wilson HS boundary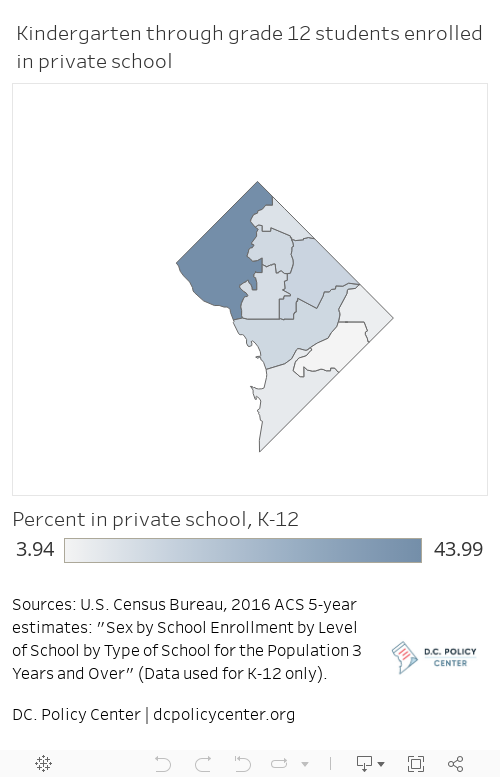
How do neighborhood characteristics vary across neighborhoods with high or low boundary participation rates?
Neighborhood characteristics, including how fast they are changing, vary across the city. To explore the relationship between neighborhood characteristics and school participation rates, we compare the characteristics of neighborhoods where in-boundary schools draw the highest proportions of students (e.g., those with boundary participation rates above the 75th percentile) to other school neighborhoods. Appendix Figure 1 through Appendix Figure 6 map these differences. We present elementary level findings here because they are more detailed; results for middle and high school grades are included in Appendix Table 6.
Characteristics of in-boundary school neighborhoods
The elementary school neighborhoods with in-boundary schools that draw the highest proportion of students share some common characteristics (see Appendix Table 5 for findings on statistically significant differences).[18] These differences are particularly strong for demographic characteristics: elementary school neighborhoods that draw the highest proportion of in-boundary students are likely to have proportionally smaller African American populations (14 percent on average, compared to 69 percent for the rest of the city) that are not decreasing as fast as they are in the rest of the city; the later dynamic could be related to the first because these neighborhoods tend to be historically white, and have very small African American populations to begin with.[19] The schools that draw the highest proportion of students from the neighborhood also have smaller school-age populations in general, but these school-age populations are increasing compared to decreases elsewhere. See Figure 9 for details.
Figure 9. Race and school-age population

Neighborhoods where boundary participation is highest also have the greatest concentration of economic opportunity, and neighborhoods with the lowest boundary participation have the highest barriers to economic opportunity. High boundary participation neighborhoods have much lower shares of family households headed by a single mother (15 percent, compared to 56 percent in low boundary participation neighborhoods). These school neighborhoods also have lower poverty rates (10 percent, compared to 23 percent in low boundary-participation neighborhoods), a higher proportion of owner-occupied housing (56 percent, compared to 39 percent in low boundary participation neighborhoods), and a higher proportion of residents with a high school diploma (97 percent, compared to 86 percent in low boundary participation neighborhoods). See Figure 10 for details.
Figure 10. Single mothers, poverty, home ownership, and educational attainment

Looking at other characteristics that may influence school choice, we find that the most important differentiator between high and low boundary participation neighborhoods is the presence of charter schools in the neighborhood. The in-boundary school neighborhoods that draw the highest proportion of in-boundary students have slightly fewer charter schools, although this difference is statistically significant. However, location for public charter schools is not random, and schools may choose to locate where they anticipate demand will be highest, where facilities costs are lowest, or other factors. Violent crime rates are lower in neighborhoods with schools that draw the highest proportion of students, but transit access appears to be similar across both sets of neighborhoods.[20] See Figure 11 for details.
Figure 11. Public charter schools, transit access, and violent crime rates

Elementary school neighborhoods with the highest public charter school participation rates are statistically different in all categories aside from home ownership and population change, which is aligned with differences in characteristics for neighborhoods with high and low boundary participation. We did not examine results for out-of-boundary schools in detail, as they are a residual category and unlikely to add information to our main model. For detailed results on elementary public charter school participation, see Appendix Table 9.
Differences between high and low boundary participation neighborhoods in terms of demographic characteristics, indicators of economic opportunity, and neighborhood characteristics are not significant at middle and high school levels. This could be because middle and high school boundary neighborhoods are much larger and less different from each other than elementary school neighborhoods, which are smaller and more differentiated. It also could be related to the less important role that location plays in school choices as students grow older and can travel longer distances on their own to and from school. See Appendix Table 6 for details.
THREE | Can differences in neighborhood characteristics explain differences in school enrollment across the city?
In this section, we present findings from models that identify shared characteristics of schools that draw the highest proportion of in-boundary students. We also look for schools whose boundary participation rates are higher or lower than expected, based on their neighborhood characteristics.
Which neighborhood characteristics are the best indicators of boundary participation?
Now that we have established that boundary participation rates are different across the city in ways that systematically change with neighborhood characteristics, we can test whether differences in neighborhood characteristics can explain school choice behaviors across the city.
To do so, we ran regressions of all neighborhood characteristics that have a strong or moderate correlation with boundary participation rates for elementary, middle, and high schools on boundary participation rates. The imposed model structure allows us to see which variables, when considered jointly, can best account for the variation in boundary participation rates across the city.[21] Because of the extremely high boundary participation in the Wilson HS feeder pattern, in all our models, we control for the “Wilson effect” to tease out the relationships that go beyond the pull of this particular feeder area.
Table 1 presents the results for separate regression analyses for elementary schools and the group of middle and high schools. We include the Wilson HS indicator in our final models (2) and (4) in Table 1, considering the large increase in goodness of fit (R-squared) and outlier nature of boundary participation rates in many of these neighborhoods.
Table 1. Boundary participation rates and neighborhood characteristics

The models we present[22] show that controlling for other factors, in-boundary schools with the highest boundary participation rates are likely to be in neighborhoods that have relatively small African American populations, have growing African American populations, have a higher proportion of households in poverty, and are located in the Wilson HS boundary. Similar to findings from correlations, middle and high school neighborhood characteristics (aside from location in the Wilson HS boundary) are no longer associated with boundary participation.
Findings
Location within the Wilson HS boundary or feeder pattern is the key variable in explaining whether students attend their in-boundary school.
Families prioritize enrolling at in-boundary schools in the feeder pattern for Wilson HS, D.C.’s top-performing in-boundary high school, even as early as pre-kindergarten and elementary school. Simply living in a neighborhood with an elementary school that feeds into Wilson HS boosts boundary participation rates by 24 percentage points in our model, and living in any Wilson HS feeder middle school neighborhood or in the Wilson HS boundary means that 34 percent more students choose their in-boundary school. While the Wilson effect is very strong, it cannot explain all differences in boundary participation rates; demographic and economic opportunity variables have smaller, but still significant, associations with boundary participation.
This has two implications. First, given the pull of the Wilson HS boundary, there is a need for more predictable feeder patterns through high school. Access to this feeder patterns shapes enrollment decisions even in elementary schools. Second, the availability of school choices other than one’s in-boundary school are especially utilized by families who live outside the Wilson HS boundary.
Demographic and income characteristics highlight the bifurcated nature of the city.
Looking at race, elementary school neighborhoods with low African American populations are likely to have higher boundary participation rates than neighborhoods with high African American populations. Growth in a neighborhood’s African American population is also significant, which could mean that these neighborhoods are slowly changing. Although African American populations have declined in over 70 percent of all elementary school boundary neighborhoods, African American populations have actually increased in more than half of the 18 neighborhoods with the highest boundary participation rates. Notably, many of the neighborhoods with small or growing African American populations are also located in the Wilson HS boundary, which reinforces our primary finding (see Figure 12). A couple of schools outside the Wilson HS boundary (labeled in the scatterplot below) show a similar pattern of small and growing African American populations as well boundary participation rates that are higher than the city average.
Figure 12. Most areas with small and growing African American populations are in the Wilson HS boundary

In terms of income, when we control for other neighborhood characteristics (such as African American population), higher poverty rates are positively associated with boundary participation. This may seem counterintuitive, as individually, poverty is negatively correlated with boundary participation rates. However, poverty is the only factor that is positively associated with boundary participation rates aside from location in the Wilson HS boundary or the change in African American populations, which means that higher concentrations of poverty could explain boundary participation in areas that are similar in other aspects. Poverty may present transportation challenges and other barriers to choosing a school other than one’s in-boundary school.
The implications of these other characteristics[23] are very small when compared to location in the Wilson HS boundary. For other variables in our model to have the same impact, they would have to increase by 2.5 to 6 standard deviations (see Appendix Table 14 for standardized coefficients for continuous variables). This would mean a change of 84 percentage points in the population that is African American, for example, which is larger than the average difference between the most in-boundary neighborhoods with the highest boundary participation rates and others.[24]
Interpreting the main finding that living in the Wilson HS boundary is the neighborhood characteristic most closely related to higher in-boundary enrollment is not straightforward. Our data can’t tell us which school or neighborhood factors draw families to live in these in-boundary neighborhoods in the first place.[25] However, it seems that the influence of Wilson HS extends beyond just the academic performance of this school and its feeder schools: location in the Wilson HS boundary is still significant when we add math test scores as a rough measure of quality to our model, although it decreases the “Wilson effect” to a 17 percentage point increase in boundary participation for elementary and 25 percentage points for middle and high schools (see Appendix Table 12 and Appendix Table 13).
School enrollment patterns echo the significance of Wilson HS and a predictable feeder pattern. School choice is extremely important outside the Wilson HS path, with some exceptions in Capitol Hill and neighborhoods in the center of the city. For example, outside the students who are in the Wilson HS feeder neighborhoods, the elementary boundary participation rate is 26 percent, compared to 79 percent within Wilson HS and its feeder schools (see Figure 13).
Figure 13. Influence of the Wilson HS feeder pattern

The importance of most neighborhood characteristics in school choice disappears in middle and high school grades.
In the full middle and high school model that accounts for Wilson HS and its feeder middle schools, no other neighborhood factors are significant other than location in the Wilson HS boundary. This means that other neighborhood characteristics are much more important at the elementary level, when students may not be able to travel as far and when school boundary neighborhoods are smaller and more differentiated. In higher grades, no schools have particularly high boundary participation rates outside of the Wilson HS boundary or feeders—the higher elementary school boundary participation rates for Capitol Hill and a Dupont Circle elementary school fade away (see Figure 14). Neighborhood characteristics outside of Wilson HS may also be less important as students travel farther as they grow older: the median travel time is 6 minutes for a kindergartener, 9 minutes for a middle school student, and 13 minutes for a high school student (Urban Institute Student Transportation Working Group, 2018).
Figure 14. Boundary participation outside of Wilson HS boundary fades after elementary school

This implies that if all included neighborhood characteristics are the same, an elementary school boundary neighborhood in the Wilson HS boundary would have a boundary participation rate that is 24 percent percentage points higher than others with similar characteristics. For the other variables, each percent increase in the poverty rate would mean an increase of 0.35 percentage points in the boundary participation rate, each percent increase in the change of African American population over time would mean an increase of 0.75 percentage points in the boundary participation rate, and each percent increase in the share of the population that is African American would mean a decrease of 0.29 percentage points in the boundary participation rate. Single mothers, violent crime, and high school education attainment as a percent of the population do not have significant relationships with boundary participation controlling for other factors.
The magnitude of the coefficient on the Wilson indicator variable with values only of 0 or 1 should be interpreted with caution as a one-unit change in this variable is more meaningful that a one-unit increase in the poverty rate, for example. Given standardized coefficients, to have an equivalent change in boundary participation to the Wilson boost, the poverty rate would have to be about 70 percentage points higher, or share of the population that is African American would have to be about 84 percentage points higher or growing by about 32 percentage points over the last five years. Our data can’t tell us exactly which aspects of Wilson HS or the surrounding area pull families to its in-boundary schools or neighborhoods, but Wilson HS is still an important factor even when we consider academic performance in our checks for robustness.
A handful of in-boundary elementary schools have higher or lower boundary participation rates than expected in the model given the schools’ neighborhoods.
In a model that jointly considers neighborhood characteristics with a strong or moderate correlation with boundary participation and controls for the Wilson HS feeder pattern, there are three schools that have higher boundary participation rates than our models would predict and six schools that have lower boundary participation rates than expected (see Figure 15). These schools have been identified if the difference between the expected value and actual value is greater than one standard deviation of all differences (above 9 percentage points) and if the school is not one of the schools with the highest boundary participation (75th percentile or greater) or lowest boundary participation (25th percentile or less).
Figure 15. Some schools buck the trend

Of the schools with higher in-boundary participation rates than expected, Powell ES and J.O. Wilson ES are located in racially diverse neighborhoods with declining African American populations. The third school, Orr ES, is located in a predominantly African American neighborhood and has a rapidly growing school-age population compared to adjacent neighborhoods. The six schools that have lower boundary participation rates than what our models predict appear to be in neighborhoods that have proportionally fewer children than average to begin with.
Which neighborhood characteristics are the best indicators of public charter school participation?
Using consistent methodology, we run regressions of all strongly or moderately correlated neighborhood characteristics on public charter school participation, or the percent of students living within a school boundary who attend public charter schools anywhere in the city (see Table 2). We add the number of public charter schools per square mile for elementary schools and change in share of the population that is school-age for middle and high schools based on correlation strength (see Appendix Table 8).
Table 2. Public charter school participation rate and neighborhood characteristics

The concentration of public charter schools located in a school boundary appears to be the most important variable aside from location in the Wilson HS boundary for participation in public charter elementary schools.
In the elementary model, public charter schools per square mile are significant, with each public charter school in the school boundary per square mile increasing public charter school participation rates by between 1 and 2 percentage points. Having more public charter schools in a school boundary increases participation in public charter schools even when we exclude the Wilson HS boundary schools (see Appendix Table 15). Like our other findings, this should not be interpreted as causal, since public charter school location is not independent of demand for other school options or additional factors including the cost of a facility.
Some students attend a public charter schools that is very close to home. Citywide, at least 7 percent of students attend a public charter school that is located within their school boundary compared to at least 24 percent of students who attend a public charter school elsewhere (see Figure 16).
Figure 16. Some students attend public charter schools within their school boundary

The impact of the Wilson HS feeder pattern is present here, too: location within the Wilson HS boundary (where there aren’t any public charter schools) decreases public charter participation by about 11 percentage points for elementary schools and about 22 percentage points for middle and high schools. Our data can’t tell us why public charter participation is low in the Wilson HS boundary, but it could be related to access to Wilson HS and its feeder schools as well as the lack of any public charter schools located within this boundary. Similar to boundary participation patterns, neighborhood characteristics can no longer explain enrollment at middle and high public charter schools.
FOUR | Conclusions
In D.C., enrollment at in-boundary schools is geographically concentrated in one area, but typical neighborhood characteristics do not explain this trend. Instead, location within the feeder pattern for Wilson HS, D.C.’s top-performing in-boundary high school, outweighs other neighborhood aspects in explaining the tendency to enroll at in-boundary schools. This shows the importance of a feeder pattern through high school over demographics and other neighborhood characteristics in many families’ enrollment patterns. This is an important finding, as total public school enrollments tend to decline in D.C. beginning in the middle school years. The city has expanded pre-kindergarten to draw more students into the system, but it seems like the boost in enrollment has already been maximized in lower grades.
Our findings also suggest that high boundary participation rates are largely concentrated, with families in one part of the city unlikely to make use of options other than their in-boundary school, and families in the majority of the city primarily relying on these options. In-boundary schools are a primary choice for many families throughout D.C., but public school students living in the Wilson HS area are the only ones in the city—aside from students at a couple elementary schools in Capitol Hill and Dupont Circle—who overwhelmingly attend in-boundary schools over other options in DCPS or public charter schools. This makes availability of public school choices very important for many in the city, and less so for those living within the Wilson HS boundary (where there are no public charter schools, and where nearly half of students attend private school).
This analysis can’t tell us exactly which aspects of Wilson HS, its feeder schools, or the surrounding area pull families to its in-boundary schools or neighborhoods. Our findings do suggest that school factors affecting in-boundary participation rates might extend beyond academics, as Wilson HS is still an important factor even when we consider test scores. Families could be drawn to extra-curricular activities offered at these schools, or to student demographics—or they might not choose other options because public charter schools aren’t available in the vicinity. Or families could choose to live in the Wilson HS boundary because of neighborhood amenities unrelated to schools. To answer some of the questions raised by this study, the Education Policy Initiative will produce additional reports on D.C.’s retention of students over time, diversity and demand for schools, the interaction of housing and education, and access to quality schools across the city.
APPENDIX ONE | Additional figures and tables
Appendix Table 1. Data sources

Appendix Table 2. Participation rates by grade band and school type

Appendix Table 3. Elementary schools with the highest boundary participation rates

Appendix Table 4. Middle schools with the highest boundary participation rates

Appendix Table 5. Differences in neighborhood characteristics for in-boundary elementary schools that have the highest boundary participation rates

Appendix Table 6. Differences in neighborhood characteristics for in-boundary middle and high schools that have the highest boundary participation rates

Appendix Figure 1. Share of African American population, and how it changed over time in elementary school neighborhoods

Appendix Figure 2. Poverty and presence of households headed by single mothers

Appendix Figure 3. Transit access, violent crime rates, and public charter schools in elementary school boundary neighborhoods

Appendix Figure 4. School-age population in elementary school neighborhoods

Appendix Figure 5. Other household characteristics by elementary school neighborhoods

Appendix Figure 6. Clusters of neighborhoods that are different demographically from in-boundary schools

Appendix Table 7. Correlations between boundary participation rates and neighborhood characteristics

Appendix Table 8. Correlation between public charter school participation rates and neighborhood characteristics

Appendix Table 9. Differences in neighborhood characteristics for elementary school neighborhoods with the highest public charter school participation rates

Appendix Table 10. Change in African American students from 2012-13 to 2016-17

Appendix Table 11. In-boundary schools with large difference between African American population of neighborhood and school demographics

Appendix Table 12. Alternative models of elementary boundary participation rate and neighborhood characteristics

Appendix Table 13. Alternative models of middle and high school boundary participation rate and neighborhood characteristics

Appendix Table 14. Standardized coefficients for elementary boundary participation rate

Appendix Table 15. Alternate model of public charter school participation rate and neighborhood characteristics, without Wilson HS and feeders

APPENDIX TWO | References
21st Century School Fund, Brookings, and Urban Institute. (2008). Quality Schools and Healthy Neighborhoods: A Research Report. Washington, DC: OSSE. Retrieved from https://www.urban.org/sites/default/files/publication/32066/411769-Quality-Schools-and-Healthy-Neighborhoods-A-Research-Report.PDF
Abdulkadiroglu, A., Pathak, P., Schellenberg, J., & Walters, C. (2017). Do Parents Value School Effectiveness? NBER Working Paper Series, Working Paper 23912. Retrieved from https://economics.mit.edu/files/14573
Campbell, C., Heyward, G., & Gross, B. (2017, November). Center for Reinventing Public Education. Retrieved from Stepping Up: How Are America’s Cities Delivering on the Promise of Public School Choice? 2017 Parent Survey Results for Washington, DC. : https://www.crpe.org/sites/default/files/crpe-stepping-up-american-cities-public-school-choice.pdf
DCGIS Open Data: Education. (2016). DC Open Data. Retrieved from School Attendance Zones Shapefiles: https://opendata.dc.gov/datasets?q=school%20attendance%20zones
District of Columbia Public Schools. (2015, December 12). SY16-17 School Feeder Patterns. Retrieved from https://dcps.dc.gov/publication/sy16-17-school-feeder-patterns
Glazerman, S., & Dotter, D. (2016). Market Signals: Evidence on the Determinants and Consequences of School Choice from a Citywide Lottery. Mathematica Policy Research. Retrieved from https://www.mathematica-mpr.com/our-publications-and-findings/publications/market-signals-how-do-dc-parents-rank-schools-and-what-does-it-mean-for-policy
Holme, J. (2002, Summer). Buying homes, buying schools: School choice and the social construction of school quality. Harvard Educational Review, 72(2), 177-205.
Jochim, A., M. DeArmond, B. G., & Lake, R. (2014, December). How Parents Experience School Choice. Center for Reinventing Public Education. Retrieved from Center for Reinventing Public Education: https://www.crpe.org/sites/default/files/crpe_how-parents-experience-public-school-choice_1_1.pdf
Moored, G., & Metcalf, L. (2015, January 15). Office of the Chief Financial Officer. Retrieved from DC Parenthood: Who Stays and Who Leaves: https://cfo.dc.gov/node/983682
Mordechay, K., & Ayscue, J. (2017, December). White Growth: Persistent Segregation: Could Gentrification Become Integration. Retrieved from The Civil Rights Project: https://www.civilrightsproject.ucla.edu/research/k-12-education/integration-and-diversity/
Office of the Deputy Mayor for Education. (2017). Fact Sheet – Public Education Supply and Demand for the District of Columbia. Retrieved from Citywide Factsheets: https://dme.dc.gov/node/1200485
Office of the Deputy Mayor for Education. (2017). SY2016-17 Public School Enrollments per DCPS Boundary. Retrieved from https://dme.dc.gov/page/download-data
Office of the State Superintendent. (2017). Enrollment Audit Data. Retrieved from Enrollment Audit, FY 2017: https://osse.dc.gov/enrollment
Orfield, G., & Ee, J. (2017, February). The Civil Rights Project. Retrieved from Our Segregated Capital: An Increasingly Diverse City with Racially Polarized Schools: https://www.civilrightsproject.ucla.edu/research/k-12-education/integration-and-diversity
Schneider, M., & Buckley, J. (2002, Summer). What Do Parents Want from Schools? Evidence from the Internet. Educational Evaluation and Policy Analysis, 24(2), 133-144.
Taylor, Y. S. (2016, March 28). District, Measured. Retrieved from Kids in the neighborhood: The District has more children, but they are not where they used to be: https://districtmeasured.com/2016/03/28/kids-in-the-neighborhood-the-district-has-more-children-but-they-are-not-where-they-used-to-be/
Tedin, K., & Weiher, G. (2004, November). Racial/Ethnic Diversity and Academic Quality as Components of School Choice. The Journal of Politics, 66(4), 1109-1133. Retrieved from https://www.jstor.org/stable/10.1111/j.0022-3816.2004.00292.x
United States Census Bureau. (2016). American Community Survey 5-year Estimates. Retrieved from https://www.census.gov/programs-surveys/acs/
United States Census Bureau. (2016). Geography. Retrieved from Cartographic Boundary Shapefiles – Block Groups: https://www.census.gov/geo/maps-data/data/cbf/cbf_blkgrp.html
United States Department of Commerce. (2009, May). A Compass for Understanding a Using American Community Survey Data: What Researchers Need to Know. Retrieved from https://www.census.gov/content/dam/Census/library/publications/2009/acs/ACSResearch.pdf
United States Department of Education. (1998). National Center for Education Statistics. Retrieved from State Comparisons of Education Statistics: 1969-70 to 1996-97, NCES 98-018: https://nces.ed.gov/pubs98/98018.pdf
United States Department of Education. (2015-16). Private School Universe Survey. Retrieved from National Center for Education Statistics: https://nces.ed.gov/surveys/pss/
Urban Institute Student Transportation Working Group. (2018). The Road to School: How Far Students Travel to School in the Choice-Rich Cities of Denver, Detroit, New Orleans, New York City, and Washington, DC. Washington, DC: Urban Institute.
Whitehurst, G., Reeves, R., Joo, N., & Rodrigue, E. (2017, November). The Brookings Institution. Retrieved from Economic Studies at Brookings: https://www.brookings.edu/wp-content/uploads/2017/11/es_20171120_schoolsegregation.pdf
Acknowledgements
The author is grateful to the Walton Family Foundation and EdForward DC for their generous support of the Education Policy Initiative. The paper benefited from helpful feedback and input from Dane Anderson, Kristin Blagg, Tomeika Bowden, Matt Chingos, Jennifer Comey, Steven Glazerman, Irene Holtzman, Claudia Luján, Sara Mead, Arthur McKee, Ginger Moored, Richelle Russell, and Jon Valant. At the D.C. Policy Center, Yesim Sayin Taylor and Kathryn Zickuhr offered crucial guidance, and Simone Roy provided incredible research assistance.