“Transition to college or career for the District’s high school students” explores outcomes for D.C.’s students at the close of high school and as they become young adults transitioning into postsecondary or entering jobs. Below is the full report. You can also read the summary – available in both English and Spanish – or download the PDF.
D.C.’s public schools and educators are tasked with preparing students to be successful as adults, especially as part of the workforce. However, navigating the transition from high school to college or the workforce can be challenging for former D.C. students. Out of every 100 public school students[1] who began ninth grade in 2014-15 and were in the graduating high school class cohort of 2017-18, only 14 students will complete a postsecondary degree within six years of high school graduation.[2] This means the majority of the cohort will likely enter the labor force with a high school diploma. Assuming they stay in D.C., these graduates without a postsecondary degree can expect to earn an estimated $15,000 a year in their first years after high school.[3]
Given the public health and economic crisis of COVID-19, this transition from high school to workforce or postsecondary education is even more challenging this year. Most school years were cut short by three weeks and included nine weeks of distance learning, which likely resulted in lower levels of achievement.[4] In addition, local employment opportunities are becoming scarce. Since D.C.’s public emergency was declared in March, economic hardship has increased significantly: thousands of people in D.C. lost their jobs, leading to an additional 103, 323 new unemployment claims filed in the District between March 13 and May 21.[5] Hiring activity is currently low, especially in jobs requiring minimal education[6] – postings for these jobs declined by 76 percent from January to May 2020 in D.C.[7]
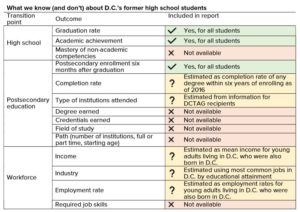
This study examines the extent of what we know about the transition to college or career for D.C.’s former high school students in a typical year. Information is the most complete for high school outcomes, and shows that the majority will end their education at the end of high school, and at least half the students who graduate from D.C. public schools are not ready for college or career. Data on postsecondary education and workforce outcomes is scant. This report estimates some of these metrics using limited publicly available data to give a slice of the full picture. Based on these estimates, only a small percentage of D.C.’s former high school students will eventually earn a postsecondary degree, and these former students who stay in D.C. will earn less compared to other former students who stay in D.C. if they have lower levels of educational attainment. Importantly, the review of what we know about former public school students show that more information is necessary to better assess and improve long term outcomes for D.C.’s students after high school.
Transition from high school to postsecondary education
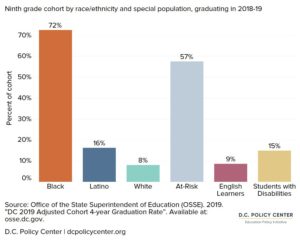
In the 2018-19 school year, 3,359 students were part of the cohort that began ninth grade in District of Columbia Public Schools (DCPS) and public charter schools four years earlier (an estimated 17 percent of high school students living in D.C. attend private schools[8]). Of these public school students, the majority were students of color: 72 percent were Black and 16 percent were Latino. White students were a small proportion at 8 percent of the cohort. The high school student cohort was 57 percent at-risk,[9] higher than the rate of 45 percent for all students in D.C., in part due to the overage category for at-risk funding that only applies to high school students. At the close of the 2018-19 school year, 68 percent of this cohort had graduated high school within four years.
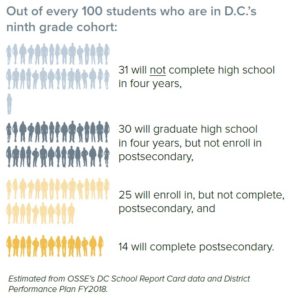
Looking at the previous year to include postsecondary enrollment data, 31 percent of D.C.’s students who entered ninth grade in 2014-15 and remained in the cohort didn’t complete high school within four years as of the fall of 2018,[10] and another 30 percent graduated from high school but didn’t continue to postsecondary. If past patterns continue, 25 percent of the cohort will enroll in postsecondary but will not complete, and an estimated 14 percent will complete postsecondary within six years of high school graduation.[11]
For D.C.’s students to earn wages that unlock more opportunities, they need to be able to find good jobs with high earnings potential and a career growth path. They also need to seek the education that will allow them to qualify for those good jobs. The definition of a good job will vary from person to person, but high pay and growth potential are important components. For example, the Georgetown University’s Center on Education and the Workforce defines a ‘good job’ as one that pays at least $35,000 for workers between the ages of 25 and 44, and at least $45,000 for workers between the ages of 45 and 64. Using this definition, only 20 percent of good jobs are potentially available to workers with a high school diploma or less across the country.[12]
Given that access to good jobs depends heavily on the educational attainment of workers, what do we know about graduation from high school, learning outcomes, postsecondary enrollment, and postsecondary completion for D.C.’s former high school students? What do we need to find out?
High school graduation
At the close of the 2018-19 school year (the most recent year for which we have data), 68.2 percent of students who started in the ninth grade cohort graduated from D.C.’s public high schools within four years. This is lower than the U.S. national average of 85 percent in 2016-17 (the most recent year available).[13] D.C.’s overall graduation rate has increased over time, by three percentage points between the 2014-15 and 2018-19 school years, with a peak in 2016-17. But outcomes remain uneven: the gap between graduation rate for at-risk students,[14] who represented 61 percent of students in the cohort,[15] and their counterparts who are not considered at-risk is particularly stark: four-year graduation rates for at-risk students are 34 percentage points lower than those of not at-risk students. By race, white students have the highest graduation rates, but only represent 8 percent of graduates.
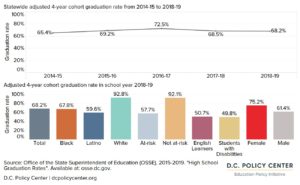
Of the remaining 31.8 percent of the cohort who did not graduate in 2018-19, about half were educationally disengaged, defined as having dropped out or otherwise not in school.[16] The DC ReEngagement Center, Pathways for Young Adults Program, and Out-of-School Program are examples of some local efforts to connect these youth with additional education or workforce training.
The other half of students who did not graduate were actively enrolled in a DCPS or public charter school pursuing a diploma, either through a high school offering grades 9 to 12, or through an alternative school.[17] In D.C., three DCPS opportunity academies offer a personalized competency-based learning program, and ten public charter schools serve adult and alternative students with options to earn a GED in English or Spanish and programs such as dual enrollment, English as a second language, and computer skills.
These rates mean that, among the approximately 5,000 students who began high school in the fall of 2014, approximately 3,400 graduated in the spring of 2019 with a diploma, 800 dropped out or disengaged, and possibly entered the workforce without a high school diploma, and another 800 are still in high school or enrolled in alternative programs (while possibly working).
Learning outcomes
What can available metrics tell us about how prepared D.C.’s former high school students are for what comes next? Three available metrics provide some information on learning outcomes: state assessment results for high school students, participation and performance on Advanced Placement (AP) or International Baccalaureate (IB) exams, and SAT test scores.[18]
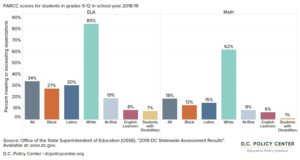
D.C.’s state assessment, Partnership for Assessment of Readiness for College and Careers (PARCC), intends to measure the knowledge and skills ultimately needed to succeed in college and careers. High school students primarily take this assessment in grade 10. In 2018-19, 34 percent of high school students who were assessed met or exceeded expectations – the standard for being ready for college or career – in English Language Arts (ELA) and 18 percent reached this bar in Math (including Algebra II, Geometry, and Integrated Math II subjects).[19] Learning outcomes are lower for at-risk students: 19 percent of at-risk students met or exceeded expectations in ELA and 8 percent did so in Math.
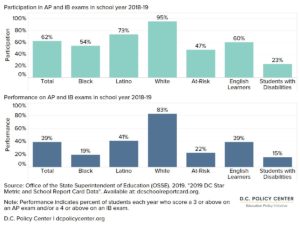
Participation and performance on AP or IB exams indicate which students have already successfully completed college-level courses during high school. Students who score a 3 or higher on an AP exam might receive college credit for a course, and earning a 4 on an IB exam is a passing grade. In school year 2018-19, 38 percent of all D.C. public high school students who took these exams scored a 3 or above on an AP exam and/or a 4 or above on an IB exam. For context, 62 percent of all high school seniors took at least one AP or IB course – if their scores mirror all students’ scores, these outcomes could mean that as many as 24 percent of all seniors are ready for college content, although access to AP and IB courses varies by student group.[20]
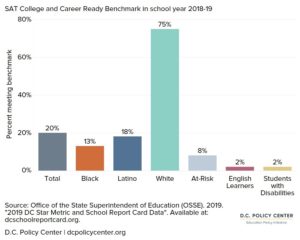
SAT scores are another measure used to determine college readiness, frequently used in the college admissions process The College Board, which provides the SAT, sets benchmark scores for college and career readiness, which was 480 in Evidence-Based Reading and Writing and 530 in Math in the 2018-19 school year.[21] In this year, 20 percent of all D.C. high school seniors met or exceeded this benchmark in both subjects.
These three sources of information show that at least half the students who graduate from D.C. public schools are not ready for college or career: 68.2 percent of students graduated in 2018-19, but at most 34 percent are college or career ready as measured by the PARCC test results in ELA, but this share could be as low as 18 percent when measured for math competencies.
How could the District improve its understanding on this topic? Grade Point Average (GPA) is another metric that would add to this picture of how prepared students are for college. Research from Chicago Public Schools shows that GPA is a better predictor for college success than ACT scores, for example.[22] Each of these available metrics focuses on academic preparedness for postsecondary education, and doesn’t shed light on competencies required for the workplace.
Postsecondary enrollment and completion
Across the country, postsecondary experiences rarely involve a four-year degree immediately after high school: 37 percent of postsecondary students are at least 25 years old, 40 percent work full time, 24 percent have children or dependents, and 57 percent live independently (not on campus or with parents).[23] By type of program, 38 percent enroll at two-year schools and another 38 percent are part-time students.[24] In D.C, the majority of those enrolled in postsecondary who were born in D.C. are also working: 71 percent of those 18 to 24 years old and 81 percent of those 25 to 34 years old.[25] We don’t know a lot of these details for D.C.’s former high school students, but it is possible that their postsecondary paths are similar.
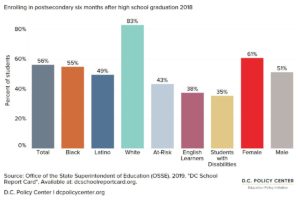
After graduating from traditional public or public charter high schools, 56 percent of graduates (or 39 percent of the grade 9 cohort) continue to postsecondary within six months. By subgroup, females have the second-highest likelihood of enrolling, at 61 percent continuing to postsecondary. Students who are considered at-risk, students with disabilities, and English learners are among the groups least likely to attend postsecondary. White students enroll at a rate that is 27 percentage points higher than the city average, but only represent 7 percent of public high school graduates in the 2017-18 school year.[26] Applications for financial aid indicate that students intended to enroll in postsecondary next year at similar rates as before the pandemic: As of April 2020, FAFSA completion rates were at 65 percent of seniors in public schools compared to 64 percent of seniors in the previous year.[27] However, time will tell whether these students actually enroll.
The DC Tuition Assistance Grant (DCTAG) provides more detail on the characteristics and decisions of a set of D.C.’s former students who attend college: former D.C. students who are enrolled in postsecondary education at public institutions, Historically Black Colleges or Universities (HBCUs) and private colleges in the Washington, D.C. metropolitan area, are eligible to receive DCTAG funding.[28] Out of the DCTAG recipients in the 2017-18 school year, 1,370 graduated high school in the previous year and likely entering their first year as postsecondary students, and 79 percent attended DCPS or public charter schools.[29] The 2017 median household income for DCTAG recipients was $41,038, and 79 percent of recipients were Black or Latino. When choosing postsecondary options, 40 percent of DCTAG recipients enroll at Historically Black College and Universities (HBCUs) and 48 percent go to school close to home in D.C., Maryland, or Virginia. Of DCTAG recipients, 41.6 percent (including students from private high schools) graduate with a Bachelor’s or Associate’s degree within six years.[30]
We don’t know much about what happens to former D.C. students after they enroll in postsecondary. D.C. doesn’t collect data on fields of study, type of degree completed (Bachelor’s or Associates), how many institutions are attended, or credentials including Career and Technical Education (CTE) earned aside from Associate’s and Bachelor’s degrees. Even data on postsecondary completion is hard to come by and outdated. OSSE’s District Performance Plan FY2018 states that 37 percent of DCPS and public charter school students completed a postsecondary degree within six years of college enrollment as of 2017, which means that about one third of those who continue to postsecondary will complete a Bachelor’s or Associate’s degree. Information on college completion is not available by high school, college, race or ethnicity, income level, or score on the state assessment, and we don’t know how many institutions students typically attend before graduating or when they begin – nationally, 37 percent of postsecondary students are 25 years old or older, for example.[31]
Workforce outcomes for former high school students as young adults living in D.C.
D.C. doesn’t gather data on long-term outcomes for former students, making it difficult to know how they fare later in life. However, two sources can provide limited insights into how this group navigates the workforce. First, American Community Survey (ACS) data show outcomes for those who were born in D.C. and live in D.C. during their young adult years, presumably having attended high school in D.C. (although it is possible that they left as children and returned as young adults). Second, the Bureau of Labor Statistics has information on the types of jobs that are available in D.C. by required educational attainment.
Income and unemployment for young adults born and living in D.C., 2014-2018
Earnings for those born in D.C. and still living in D.C. as young adults can give a sense of what educational attainment patterns and local labor force opportunities mean for D.C.’s former high school students’ outcomes. An estimated 60,520 young adults ages 18 to 34 who were born in D.C. and still live in the city. This suggests that only one in five who are born in the city still remain in the District when they become young adults; others move elsewhere.[32] Of these young adults living in D.C. who were born in D.C., 83 percent are Black, compared to 71 percent of high schoolers who were Black in 2018-19.[33] An estimated 17 percent of high school students living in D.C. attend private schools[34] — they may be included in this slice of Census data in addition to public school students. This group may be of interest to the city as they are still part of the community and regional labor markets, meaning that policy decisions have more of an impact on their lives than those who left.
These workforce outcomes look at the period before COVID-19, but much has changed. As of May 2020, the unemployment rate in the District of Columbia was 11.1 percent—the highest rate since the early 1980s – and it rose 5.1 percentage points in a single month. Unemployment is disproportionately affecting younger workers, who are now a larger share of unemployment benefits recipients than what has historically been the case in the District of Columbia.[35] If D.C. follows national trends, young adult residents with less education have experienced more loss of income and employment during this pandemic. Nationally, an estimated 59 percent of adults without a high school degree experienced income loss between March and May of 2020.[36]
This analysis looks at two age groups: (i) those who are 18 to 24 years old and may be in the process of completing postsecondary or first jobs after high school; and (ii) those who are 25 to 34 years old and are likely to be more settled in their educational attainment and career path.
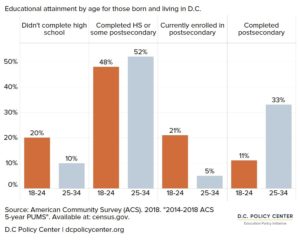
After high school, 21 percent of young adults between the ages of 18 to 24 born and living in D.C. is enrolled in postsecondary, and 11 percent has completed some postsecondary education, including a Bachelor’s or Associate’s degree. For young adults between the ages of 25 to 34 born in D.C., educational attainment increases: A smaller percentage lacks a high school diploma (10 percent compared to 20 percent), and a larger percentage has a postsecondary degree (33 percent compared to 11 percent). However, for many, this early employment may be accompanied by continuing education to earn a high school diploma or postsecondary degree. We don’t know how many of D.C.’s former students are working and earning degrees concurrently – nationally, an estimated 40 percent of postsecondary students are working full time, for example.[37]
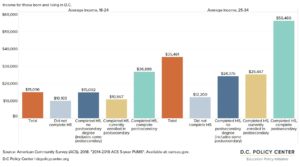
Earnings for those born in D.C. increase with educational attainment and age. Census data show that 18 to 24 year-olds born and living in D.C. without a high school diploma earn an average of $10,103 while those with a postsecondary degree earn an average of $26,889.[38] For the older group between the ages of 25 to 34 years old born in D.C., incomes increase by 20 percent for those without a high school diploma, and double for those with a postsecondary degree.
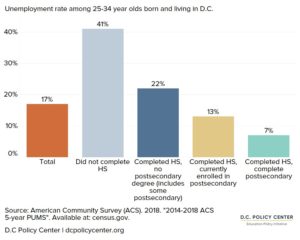
Out of young adults ages 25 to 34 years old born and living in D.C., an estimated 80 percent are in the labor force. The average unemployment rate for 25 to 34 year-olds born and living in D.C. is 16 percent, and unemployment rates are higher for those with lower levels of educational attainment. The unemployment rate for those without a high school diploma is six times the average unemployment rate for those who have completed postsecondary.
Jobs for young adults in D.C.
We don’t know the types of jobs D.C.’s former high school students have, but we can look to the local job market to see which opportunities are available. D.C.’s former high school students who remain in D.C. enter a job market that values skills and credentials, and provides limited opportunities for lower-skilled workers. This is consistent with the national economy, which favors workers with at least some education or training beyond high school: two out of three jobs across the country demand at least some education beyond high school.[39] This means that disparities in educational attainment early in life permanently shape the opportunities available to workers, which in turn, widen gaps in income and quality of life. Nationally, adults with an Associate’s degree or some college earn 35 percent more than those with a high school degree, and they earn 55 percent more than those without a high school degree,[40] although wage differentials by degree vary by location and are largest in urban areas.[41]
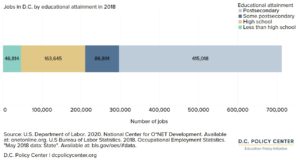
There were approximately 712,000 jobs in D.C. as of 2018, which includes jobs held by individuals commuting to the District from nearby jurisdictions.[42] Over half of all District jobs (58 percent) require a postsecondary degree, with lawyers accounting for the largest number of jobs at 32,000. Just seven percent (an estimated 47,000) of jobs in the District of Columbia do not require a high school education. The remaining 35 percent require a mix of high school and postsecondary credentials.[43]
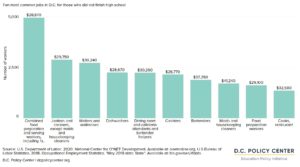
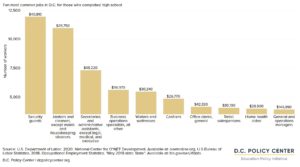
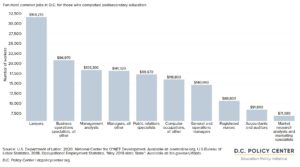
There is considerable variation in incomes and jobs available for workers with each level of educational attainment, especially by field of study.[44] However, in D.C., incomes generally rise as required education increases. Among those working in D.C. with less than a high school diploma, Combined Food Preparation and Serving Workers Including Fast Food, account for the largest number of jobs in this category at almost 5,000 jobs and a median income of $28,870.[45] Security guards and cleaners or janitors are the most common occupations for high school graduates, with median incomes of $40,810 and $29,750, respectively. Within the high school graduate category, some common jobs in business operations have high earning potential with median incomes at or above $96,000. By comparison, lawyer is the most common occupation of postsecondary graduates, with a median income five times higher than foodservice, at $164,210.
Conclusion
D.C. monitors high school graduation rates and enrollment in postsecondary education six months after graduation. However, information about outcomes for former high school students beyond whether they begin postsecondary education is scarce. College persistence is possible to track with National Student Clearinghouse data, but D.C. does not consistently publish this information. Additionally, D.C. does not have a system to follow income or other credentials as adults for D.C.’s former high school students. As such, tracking outcomes is challenging as it requires access to federal income tax databases or a costly survey to follow cohorts no matter where they live.
The District’s school leaders and policymakers are increasingly shifting their focus from graduation rates to college attendance, completion, and ultimately the workforce outcomes of their students. In order to evaluate how effective our education programs are at preparing young people for regional high-paying jobs, D.C. needs to better link education data on high school graduation, credentials earned, and postsecondary attainment with job and wage data.
About the Education Policy Initiative
The D.C. Policy Center started its Education Policy Initiative in October of 2017.
Acknowledgements
The author is grateful to the Bill & Melinda Gates Foundation for their generous support of the Education Policy Initiative and this report. This research was guided by members of the Education Policy Initiative Advisory Board. The authors are grateful to Josh Boots, Matt Chingos, Furman Haynes, Arthur McKee, and Jennie Niles for their comments on earlier drafts of the report. At the D.C. Policy Center, Yesim Sayin Taylor and Aimee Custis offered crucial guidance. Julia Crusor, Allison Ostert, Allison Ludwig, Danielle Randall, Sunaina Kathpalia, and Amanda Chu provided valuable research assistance.
Chelsea Coffin is the Director of the Education Policy Initiative at the D.C. Policy Center.
Tanaz Meghjani is the Education Analyst at the D.C. Policy Center.
The views expressed in this paper are those of the author and should not be attributed to members of the D.C. Policy Center’s Board of Directors or its funders. The research, analysis, and policy recommendations published by the D.C. Policy Center staff and independent experts are not determined by the D.C. Policy Center’s Board of Directors or its funders.
Feature photo of Howard University from Ted Eytan (Source)
Notes
[1] Public schools include both District of Columbia Public Schools (DCPS) and public charter schools. This report focuses on public school students unless otherwise stated.
[2] D.C. Policy Center estimation based on OSSE data. High school graduating class cohort includes all ninth grade students who started in SY 2014-15. Any postsecondary degree counts toward completion. See Office of the State Superintendent for Education (OSSE). 2018. DC School Report Card. Available at: https://osse.dc.gov/dcschoolreportcard and Office of the State Superintendent for Education (OSSE). OCA District Performance Plan FY2018. Available at: https://oca.dc.gov/sites/default/files/dc/sites/oca/publication/attachments/OSSE18.pdf.
[3] U.S. Census Bureau, 2014-2018 American Community Survey 5-Year Estimates. Available at: https://data.census.gov/cedsci/
[4] Boots, J. 2020. How COVID-19 Regular School Closures Could Impact Student Proficiency in 2020-21. EmpowerK12. Available at: https://empowerk12.org/covid-19-impact#8d2a1602-ba31-4a3e-acd7-50301d49a962
[5] Department of Employment Services (DOES). 2020. Unemployment Compensation Data. Available at: https://does.dc.gov/publication/unemployment-compensation-claims-data
[6] Some of these occupations may require a high school diploma or GED certificate, as classified by ONET in “Job Zone 1.” For more information: https://www.onetonline.org/help/online/zones#zone1
[7] Chetty, R., Friedman, J. N., Hendren, N., Stepner, M. and the Opportunity Insights Team. 2020. Real-Time Economics: A New Platform to Track the Impacts of COVID-19 on People, Businesses, and Communities Using Private Sector Data. Available at: https://tracktherecovery.org/
[8] U.S. Census Bureau. 2013-2017 American Community Survey 5-Year Estimates. Available at: https://data.census.gov/cedsci/
[9] In D.C., students are considered to be at-risk if they receive TANF or SNAP benefits, experience homelessness, are involved in the foster care system, or are over-age in high school.
[10] An additional 5.6 percent of the cohort graduated in five years in 2018-19.
[11] Based on 68.5 percent graduation rate in 2017-18 and 56.3 percent of these high school graduates continuing to postsecondary within six months. In 2016, 37 percent[11] of DCPS and public charter school students who enrolled in college six years earlier completed a post-secondary degree. See Office of the State Superintendent for Education (OSSE). 2018. DC School Report Card. Available at: https://osse.dc.gov/dcschoolreportcard and Office of the State Superintendent for Education (OSSE). OCA District Performance Plan FY2018. Available at: https://oca.dc.gov/sites/default/files/dc/sites/oca/publication/attachments/OSSE18.pdf.
[12] Carnevale, A., Strohl, J., Ridley, N., and Gulish, A. Three Educational Pathways to Good Jobs: High School, Middle Skills, and Bachelor’s Degree. Georgetown University Center for Education and the Workforce and McCourt School of Public Policy. Available at: https://cew.georgetown.edu/cew-reports/3pathways/
[13] https://nces.ed.gov/programs/coe/pdf/coe_coi.pdf
[14] In D.C., students are considered to be at-risk if they receive TANF or SNAP benefits, experience homelessness, are involved in the foster care system, or are over-age in high school.
[15] Office of the State Superintendent of Education (OSSE). 2019. “DC School Report Card.” Available at: www.dcschoolreportcard.org
[16] See Q10 of OSSE oversight for 2020 here https://www.dropbox.com/sh/4zccap5u88cw1cn/AABQMASLr9j1f0TIHU-Gi6xHa/Performance%20Responses/Office%20of%20the%20State%20Superintendent%20of%20Education/Responses?dl=0&preview=Q10+Attachment+2+-+Outcomes.xlsx&subfolder_nav_tracking=1
[17] Less than one percent received an alternate diploma in the form of a GED or IEP certificate.
[18] These metrics emphasize particular subjects and do not directly measure mastery of transferrable competencies which are needed for success in the workplace. D.C. is beginning to track the completion of industry recognized credentials for technical skills.
[19] Office of the State Superintendent of Education (OSSE). 2019. 2019 DC Statewide Assessment Results. Available at: https://osse.dc.gov/sites/default/files/dc/sites/osse/page_content/attachments/2019%20Statewide%20ELA%20and%20Math%20Public%20Results.pdf
[20] All high schools offering grade 12 provide access to at least some AP and IB content, with range from 2 to 100 percent of students participating and a median of 53 percent of students participating.
[21] D.C. offers the SAT to students free of charge, and over 90 percent of seniors typically take the test.
[22] Allensworth, E. and Clark, K. 2020. “High School GPAs and ACT Scores as Predictors of College Completion: Examining Assumptions About Consistency Across High Schools.” Educational Researcher, Vol. 49 No. 3, pp. 198–211. DOI: 10.3102/0013189X20902110
[23] Lumina Foundation. 2020. Today’s Student. Available at: https://www.luminafoundation.org/campaign/todays-student/
[24] Bill & Melinda Gates Foundation. 2020. Today’s College Student. Available at: https://postsecondary.gatesfoundation.org/what-were-learning/todays-college-students/
[25] Analysis of American Community Survey microdata, 5-year sample (2014-2018).
[26] Office of the State Superintendent of Education. 2018. 2017-18 School Year ACGR Four Year Rates. Available at: https://osse.dc.gov/publication/2017-18-adjusted-cohort-graduation-rate
[27] U.S. Department of Education Federal Student Aid Office. 2020. FAFSA completion by High School and Public School District. Available at: https://studentaid.gov/data-center/student/application-volume/fafsa-completion-high-school
[28] Office of the State Superintendent of Education. 2018. DC Tuition Assistance Grant: List of Participating Institutions. Available at: https://osse.dc.gov/sites/default/files/dc/sites/osse/page_content/attachments/DCTAG%20Participating%20Instititutions%202018-19.pdf
[29] Office of the State Superintendent of Education. DC Tuition Assistance Grant. Available at: https://osse.dc.gov/dctag
[30] Office of the State Superintendent of Education (OSSE). FY 2018 Performance Oversight Questions, Q67. Available at: https://osse.dc.gov/page/fy18-performance-oversight-questions
[31] https://www.luminafoundation.org/files/resources/today-s-student.pdf
[32] U.S. Census Bureau. 2014-2018 American Community Survey 5-Year Microdata. Available at: https://data.census.gov/cedsci/
[33] DME EdScape data https://edscape.dc.gov/page/pop-and-students-public-school-enrollment-by-race-and-ethnicity
[34] U.S. Census Bureau. 2013-2017 American Community Survey 5-Year Estimates. Available at: https://data.census.gov/cedsci/
[35] Sayin Taylor, Y. 2020. Pandemic-induced unemployment has hit the District’s Hispanic, Latino, and younger workers more intensely. D.C. Policy Center. Available at: https://www.dcpolicycenter.org/publications/hispanic-latino-pandemic-unemployment/
[36] Carnevale, A. 2020. Education, Race, and Jobs in the COVID-19 Crisis. Georgetown Center on Education and the Workforce. Available at: https://medium.com/georgetown-cew/education-race-and-jobs-in-the-covid-19-crisis-c927be2c2487
[37] Lumina Foundation. 2020. Today’s Student. Available at: https://www.luminafoundation.org/campaign/todays-student/
[38] These estimates include those without any earnings, but exclude those who are out of the labor force entirely.
[39] Carnevale, A., Strohl, J., Ridley, N., and Gulish, A. Three Educational Pathways to Good Jobs: High School, Middle Skills, and Bachelor’s Degree. Georgetown University Center for Education and the Workforce and McCourt School of Public Policy. Available at: https://cew.georgetown.edu/cew-reports/3pathways/
[40] Median earnings are less than $30,500 for adults with a high school diploma or less, compared to $30,469 for a high school graduate and $41,297 for those with some college or an associate’s degree (U.S. Census Bureau. 2017. American Community Survey 1-Year Estimates. https://factfinder.census.gov/faces/tableservices/jsf/pages/productview.xhtml?pid=ACS_17_1YR_B20004&prodType=table )
[41] Winters, J. 2020. What You Make Depends on Where You Live: College Earnings Across States and Metropolitan Areas. Fordham Institute. Available at: https://fordhaminstitute.org/national/research/what-you-make-depends-on-where-you-live
[42] U.S. Bureau of Labor Statistics. 2018. Occupational Employment Statistics. “May 2018 data: State”. Available at: https://www.bls.gov/oes/#data
[43] Expected educational attainment by occupation is based on data from the National Center for O*NET Development, which is sponsored by the U.S. Department of Labor (https://www.onetonline.org/). Educational attainment requirements by occupation were matched by occupation code to U.S. Bureau of Labor Statistics data on the number of jobs for each occupation in D.C.
[44] Carnevale, A., Cheah, B., Hanson, A. 2015. The Economic Value of College Majors. Georgetown University Center on Education and the Workforce. Available at: https://cew.georgetown.edu/cew-reports/valueofcollegemajors/
[45] U.S. Bureau of Labor Statistics. 2018. Occupational Employment Statistics. “May 2018 data: State”. Available at: https://www.bls.gov/oes/#data