In 1970, metropolitan Washington was more residentially segregated than DC proper. The 10-jurisdiction region had a black/white segregation index of 81 (hyper-segregation) compared its central city’s segregation index of 72 (high segregation).
Almost a half century later, in 2015, the now 22-jurisdiction region’s Black/Anglo segregation index was 61 compared to the central city’s 70 (both still in the high segregation range though the metro area is on the verge of moving into the medium segregation category.)
What explains this reversal? Massive suburbanization of DC’s black population.
Black Suburbanization in metropolitan Washington
In 1970, three-quarters (76 percent) of the region’s black residents lived in the central city. By 2015, DC’s share of the region’s Black population had dropped to less than one-fifth (18 percent). (Remember that the 1970 figures do not separate out Hispanic residents, and therefore I use the terms black and white. Beginning 1980, the Census started separating out Hispanic residents. So, for these years I use the terms Black and Anglo, capitalized).
The flow of DC’s Black residents into Prince George’s County is well-recognized; by 2015, that county’s 558,903 Black residents were approaching twice that of DC’s 310,792 Black residents. But the significant Black suburbanization did not just happen in Prince George’s County. By 2015 Montgomery County’s Black population increased eight-fold to 174,054 or 17 percent of the county’s population; Fairfax County, almost seven-fold to 102,714, or 9 percent; Prince William County, almost 15-fold to 86,142, or 20 percent; and Loudoun County, five-fold to 25,281, or 7 percent. Both close-in Arlington County (18,587 or 8 percent) and Alexandria City (31,207, or 21 percent) almost doubled their Black populations.
Certainly, only a fraction of this growth represents actual movement of Black residents from DC to Suburban Maryland and Northern Virginia. Some of it is intergenerational growth. Forty-five years covers at least two generations. Over one-quarter of Suburban Maryland’s Black residents are African American residents born in Maryland; similarly, over one-third of Northern Virginia’s Black residents are now native Virginians.
Migration of African Americans into the region from other states was also significant: In addition, in 2015, metro Washington had over 225,000 foreign-born Black residents (one-seventh of all black residents); only 15 percent resided within DC proper.
In short, greater Black suburbanization may have occurred in the Washington region than in any other metropolitan area.
Has segregation declined faster or slower in Washington metro compared to other major metropolitan areas?
Let’s see how our region compares with regard to the decline in racial segregation overall in other major metropolitan areas:
The 1970 census documented the peak of racial segregation at the metropolitan level. The average segregation index in 33 major metropolitan areas was 82 with not much difference between Northeastern and Midwestern regions (84) and Southern and Western regions (80). Regions such as Chicago (92), Cleveland (91), Milwaukee (91), Los Angeles (91) and Oklahoma City (90) approached South African apartheid-style levels of black/white segregation.
Over the next four decades segregation indices in the South and West dropped much faster to an average of 59 than did segregation indices in the Northeast and Midwest (to an average of 71).
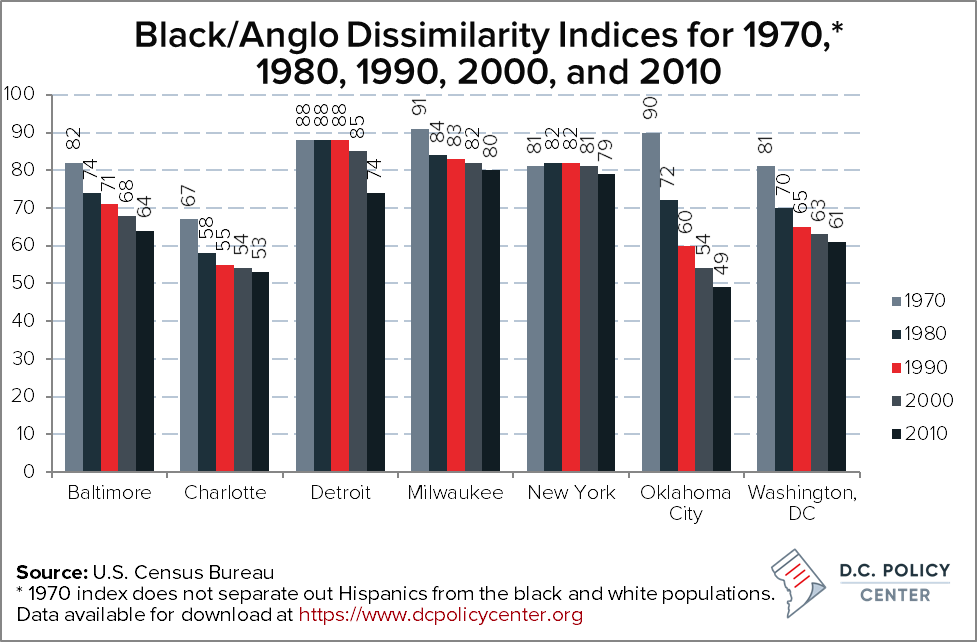
The above graph charts changes in racial segregation within illustrative metro areas:
- By 2010, Milwaukee was the USA’s most racially segregated metro area but it was typical of the industrial Midwest.
- The New York area showed the least progress, possibly affected by being the port of entry for many immigrants from the Caribbean and Africa (who may temporarily “pond” together in immigrant neighborhoods); native born African Americans may have experienced a greater decline in segregation.
- Detroit would have remained the USA’s most racially segregated region except for the accelerated evacuation of the City of Detroit by African Americans in the 2000s; substantial re-segregation characterizes Detroit’s suburbs.
- Our neighbor, the Baltimore region, would be characteristic of Southern and Western “Big Box” regions except that Baltimore City’s power to expand through annexation has been restricted for a hundred years. The fixed footprint of Baltimore limits the improvements in measured segregation we see in other Southern and Western metro areas.
- The Washington DC-MD-VA-WV region (61.0) ranked 38th among the 61 metro areas with more than 1,000,000 population; our region was bracketed by Houston (60.6) and Boston (61.5).
- The Charlotte region began with the lowest segregation index in 1970 (67) and was among the lowest by 2010 (53) by 2010.
- The Oklahoma City region had the most dramatic decline in racial segregation from 90 to 49—a 41-point drop! A key factor may have been major military influence (Tinker Air Force Base). Home to the world’s largest naval base, the Norfolk-Newport News-Virginia Beach area may have been affected by the same factor. Its segregation index dropped from 76 to 47. The military may be viewed as a conservative institution but when it undertakes a mission, it makes a determined effort. From the mid-1960s onward, desegregating housing for military personnel—both on-base and off-base—has been a major military commitment.
More broadly, what are the factors that have driven residential desegregation? An obvious factor was the federal Fair Housing Act of 1968 that undoubtedly contributed to the 1970s being the greatest single decade of relative improvement.
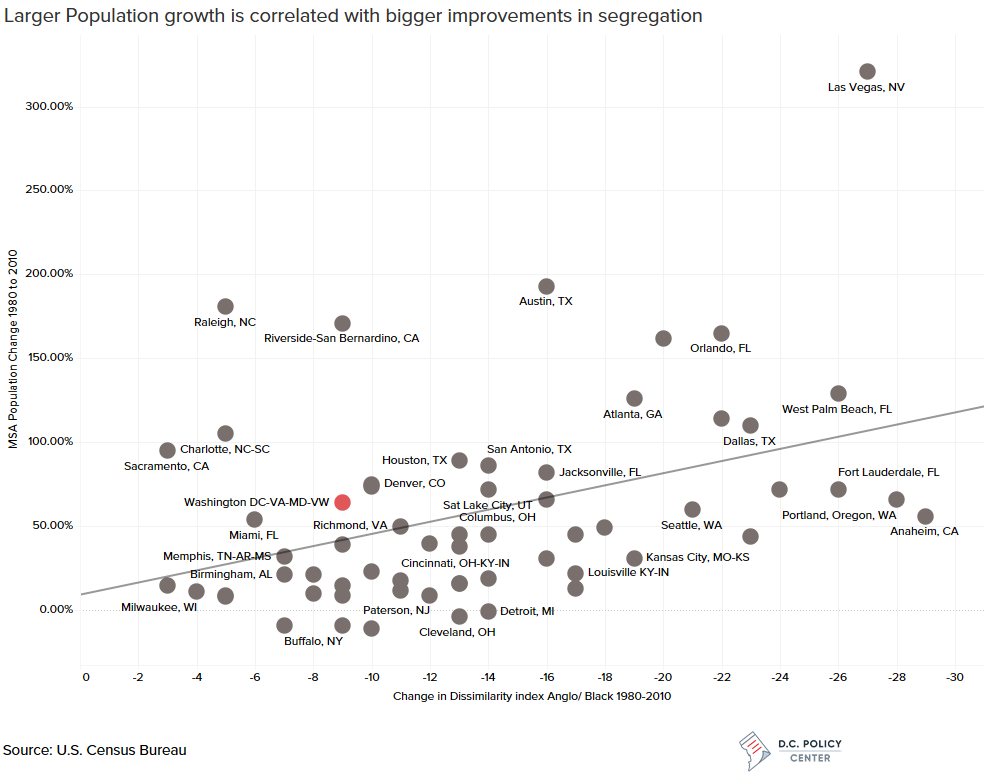
Based on statistical analysis of the 61 metro areas above 1,000,000 residents from 1980 to 2010 (which yields an apples-to-apples comparison both through uniform configuration of metro areas and Black/Anglo definition), four factors account for 57 percent of the variation in Black/Anglo segregation. In rank order of importance as single-variable regressions, they are:
- Age of the central city, which I defined as the census year when the city surpassed 100,000 people. The older the central city, the higher the regional level of Black/Anglo segregation as Black residents became segregated in inner-city neighborhoods, including city-based federal public housing projects.
- Rate of regional population growth between 1980 and 2010. The faster the rate of growth, the lower the level of racial segregation. Rapidly expanding regional housing supplies in the civil rights decades opened up new housing opportunities for African Americans as buyers/renters of new and filtered-down housing.

- The relative fragmentation of local governance. A “little boxes” region has a myriad of cities, boroughs or villages, and towns or townships covering every square foot of the region. A “Big Box” region has municipalities only where significant urbanization occurs with county government being the general local government for unincorporated areas; cities typically expand their boundaries through annexation to capture new suburban growth. Thus, “little boxism” is an invitation to practice exclusionary zoning. “Big Boxism” allows major local government to practice more inclusive zoning practices if they choose to. The more fragmented regional governance, the higher the rate of racial segregation.
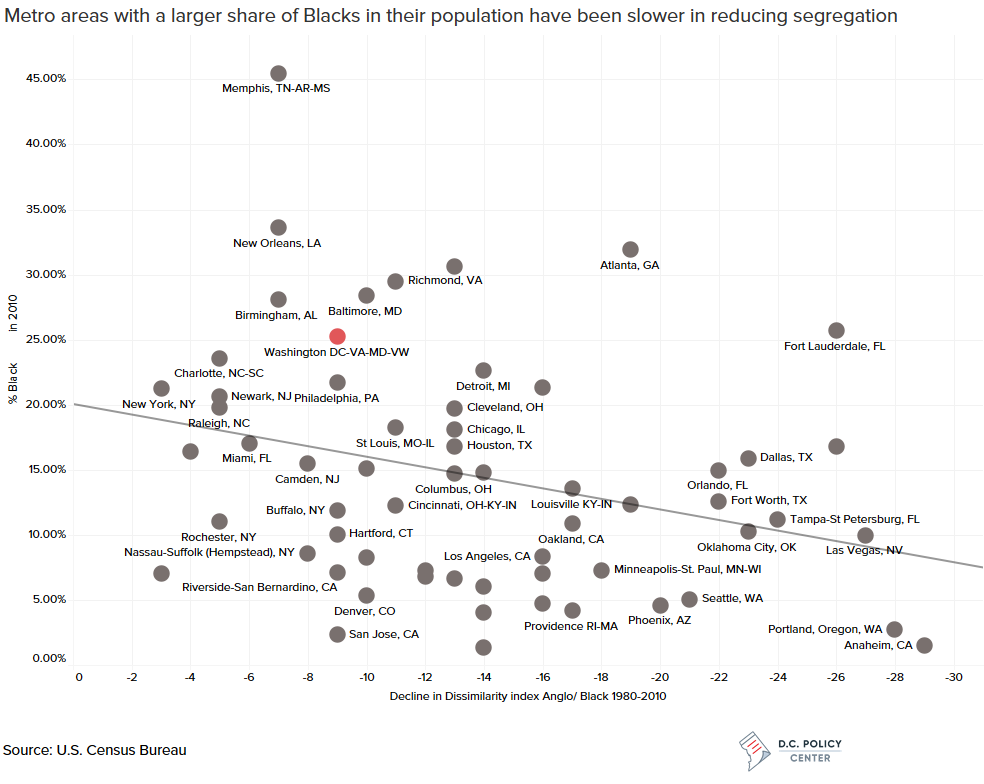
- The regional percentage of Black residents. Though the segregation index tilts modestly towards the higher when the share of the Black population is higher, there is great variation. In 2010, for example, both metro Charlotte and metro Detroit were 23 percent Black; Charlotte’s segregation index was 53; Detroit’s, 74. Both metro Austin and metro Boston were 7 percent Black; Austin’s index, 48; Boston’s, 62.
Thus, recent decades have seen consistently lower levels of Black/Anglo housing segregation in large metropolitan areas. Do the same patterns hold for Hispanic/Anglo housing patterns?
That will be the topic of the next article.
Notes
[10-jurisdiction region] These include Washington, DC, Montgomery and Prince George’s Counties in MD, and Arlington Fairfax, Loudoun and Prince William counties and the cities of Alexandra, Fairfax, and Falls Church in VA.
[22-jurisdiction] The other 12 jurisdictions are: Frederick, Calvert, and Charles counties in MD, Clarke, Stafford, Fauquier, Spotsylvania, Warren counties, and cities of Manassas, Manassas Park, and Fredericksburg in VA, and Jefferson county in WV.
[Black-Anglo] As in the earlier piece, I use the term “Anglo” to mean anyone who is not Hispanic, black, Asian or Native American. See the explanation here.
[single-variable regressions] For the statistically minded, using least-squares linear regression, the adjusted R2 measures for the four factors are central city age 0.39; metro population growth 0.35; governmental fragmentation 0.23; and metro percentage Black 0.15. Interestingly, in the multi-variate regression (adjusted r-squared 0.57), per their relative t-stats, the order of influence is re-ordered: metro percentage Black (3.82); governmental fragmentation (3.09); metro population growth (-2.28); and central city age (-2.15). All are statistically significant at the 99% confidence level except metro population growth and central city age which are statistically significant at the 95% confidence level in the multi-variate regression.
David Rusk is a Senior Fellow at the D.C. Policy Center. Rusk is a former federal Labor Department official, New Mexico legislator, and mayor of Albuquerque, the USA’s 32nd largest city. He is also the author of Cities without Suburbs. Now a consultant on urban policy, Rusk has worked in over 130 US communities in 35 states. Abroad, Rusk has lectured on urban problems in Canada, England, Germany, South Africa, and The Netherlands.