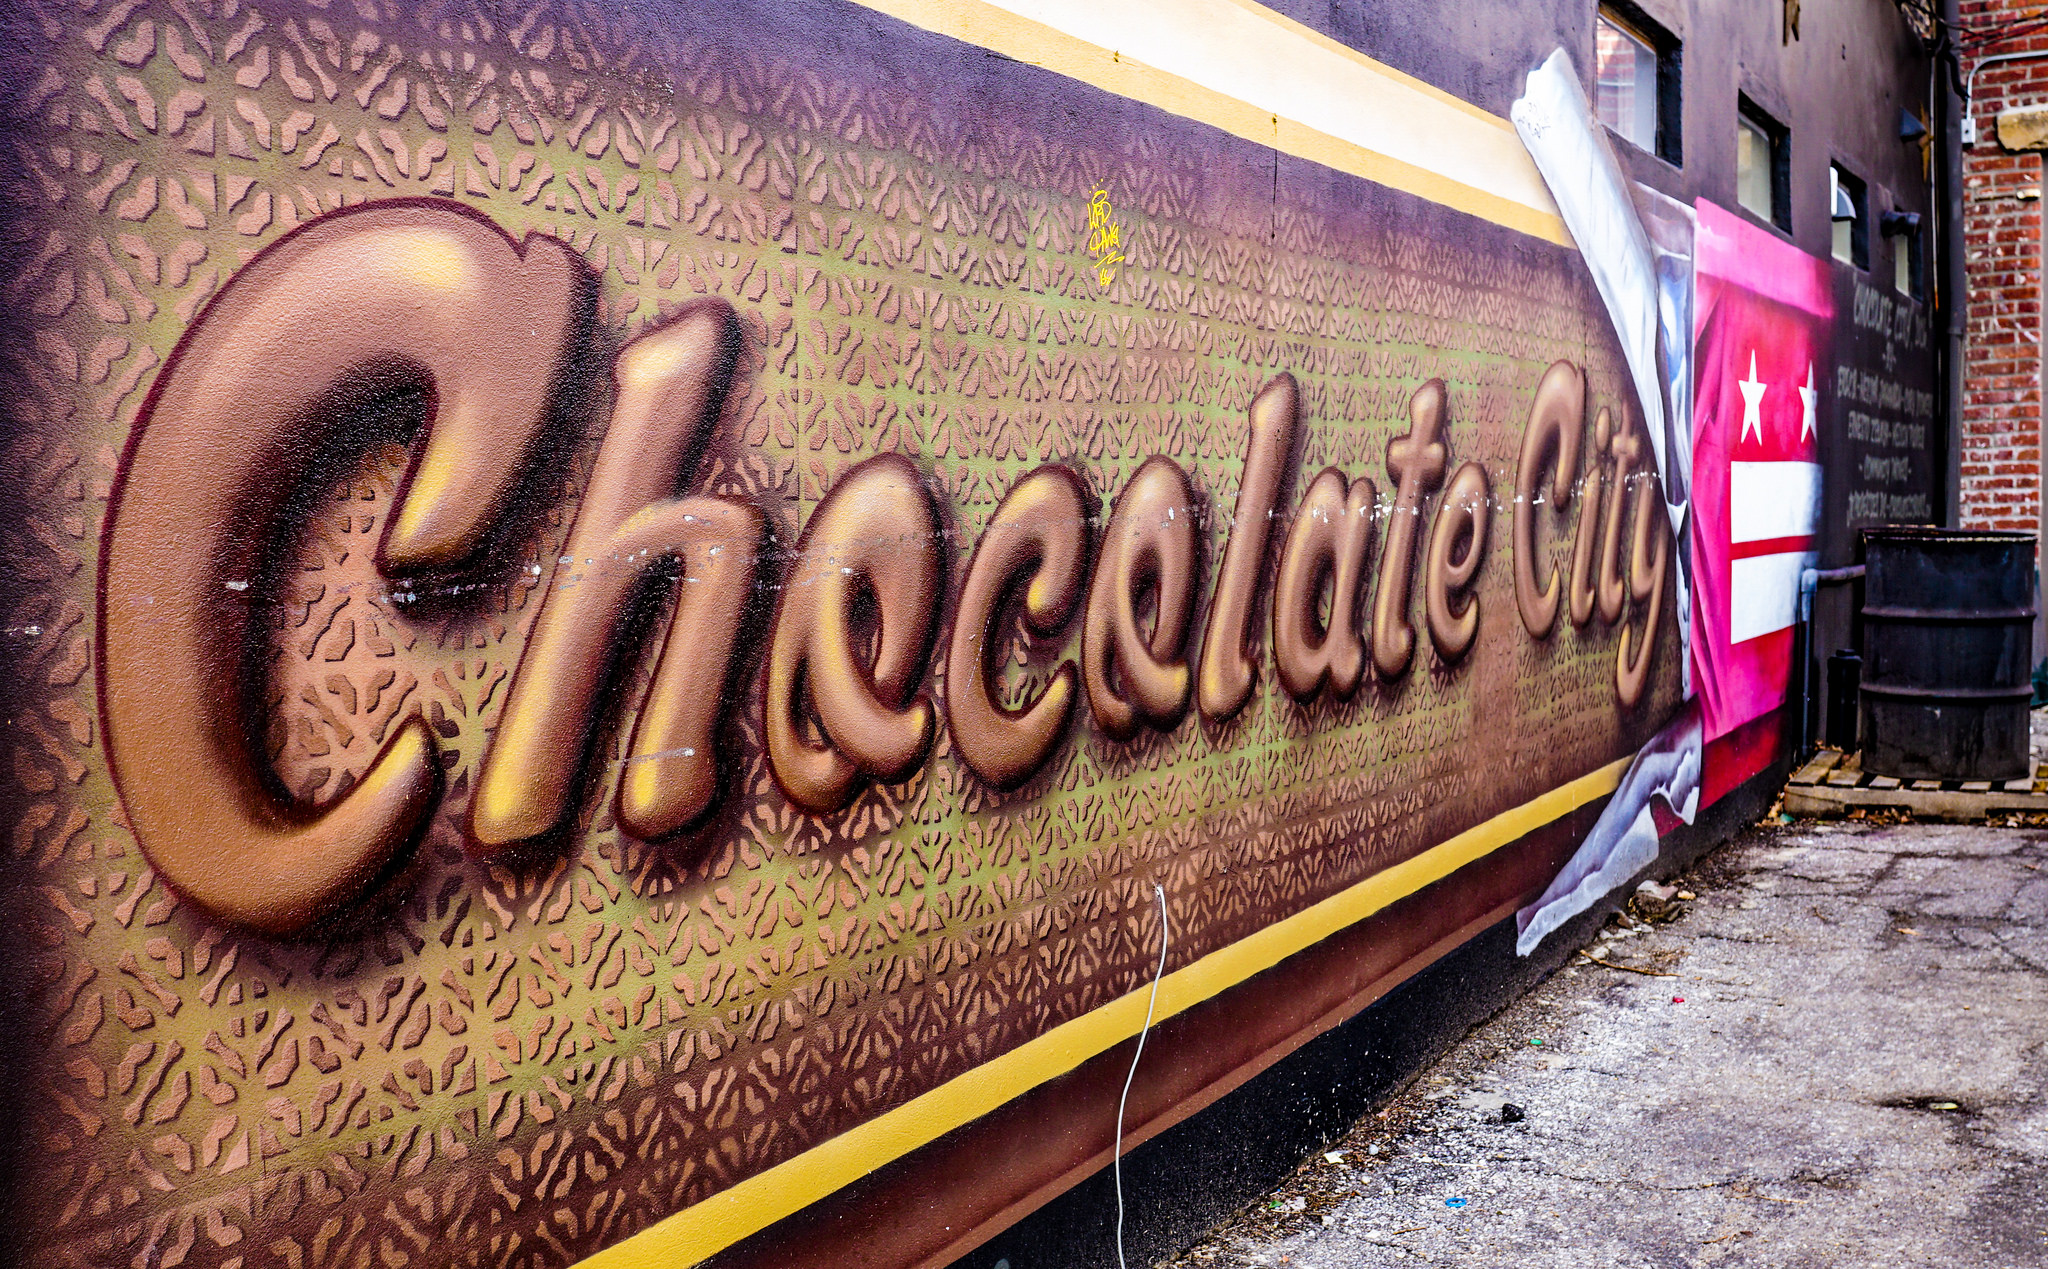
D.C. is no longer “Chocolate City.”
In fact, the District of Columbia now joins New Mexico, California and Texas as states without any one racial group forming a majority of the population [1]. (Of course, unlike those three, our “state” doesn’t have a vote in Congress.)
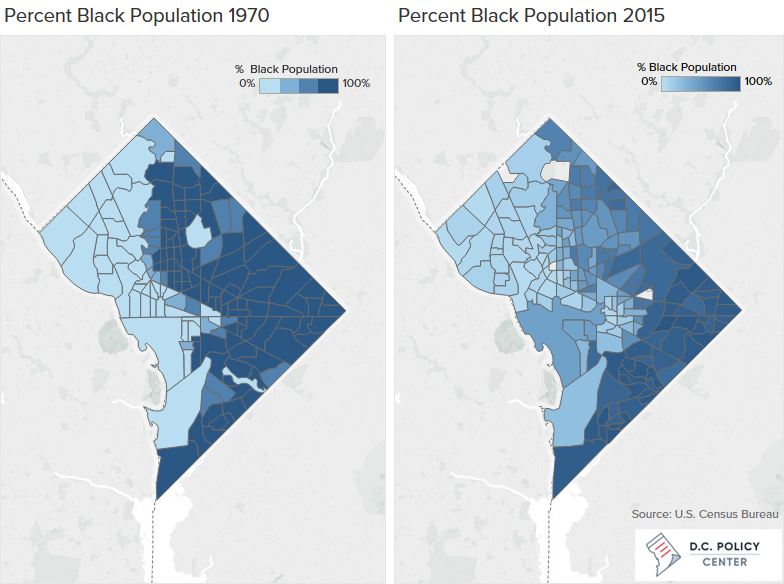
Our case is unique in that, in recent decades, our majority group was black (The other three states had majority white groups). The demographic high water mark for “Chocolate City” was 71.1 percent “Negro” in the 1970 census. Whites were 27.7 percent and “persons of Spanish language” (of any race) were 2.1 percent.
As of 2015—almost a half century later—D.C. residents identified themselves as 48.0 percent Black, 35.6 percent “Anglo[2],” 10.2 percent Hispanic (of any race), 3.6 percent Asian, and 2.6 percent mixed race and other.
In 1970, blacks and whites largely lived in separate neighborhoods. Using a demographer’s common measure[3], D.C. black/white “segregation index” was 72 (highly segregated). By 1980, the segregation index had risen to 77 though the increase may have been largely a statistical artifact; for the first time, the 1980 census allowed Hispanics to be separated out from white and black categories. Separating out white Hispanics to create the Anglo category (i.e. non-Hispanic whites) raised the segregation index somewhat since Hispanics proportionally tended to share neighborhoods with Blacks (that is, non-Hispanic blacks) more than did Anglos.
Despite the growing diversity of some neighborhoods, in 2015, D.C. remains highly segregated. Its Black/Anglo segregation index was 70. From 77 to 70 in 35 years—that is not much progress.
Let’s look at what was happening in different parts of D.C.:
- West of Rock Creek Park (Georgetown, American University Park, Cleveland Park, Chevy Chase DC, et al.): This was the traditional bastion of Whiteness in DC. In 1980, this area was 88 percent Anglo (having come down from 95 percent white in 1970). By 2015, West of the Park was still three-quarters Anglo (74.5 percent) with the balance split evenly between African Americans and other blacks (6.6 percent), Hispanics (9.2 percent), Asians (6.2 percent), and mixed race and others (3.5 percent).
- East of the Anacostia River (excluding Bolling Field): The most racially isolated part of DC in 1980 (95.4 percent black), this vast area—one-fifth of DC’s population—is unchanged racially over 35 years. In 2015, East of the Anacostia River’s racial breakdown was 95.1 percent Blacks; 1.3 percent Anglo; 2.1 percent Hispanic; 0,3 percent Asian; and 1.2 percent mixed race and other.
- Pierre L’Enfant’s City of Washington (bounded by Florida Avenue and the Potomac and Anacostia rivers): The old City of Washington, with its neighborhoods primarily filled with 19th century townhouses, has been the great magnet for gentrification over the past 35 years. In 1980, the area was 59.7 percent Black and 34.01 percent Anglo; by 2015, the ratios had roughly reversed with 56.9 percent Anglo and 24.6 percent Black.While there were well-established Anglo enclaves in the old City of Washington in 1980 (for example, Capitol Hill, Foggy Bottom, the redeveloped Southwest), the most dramatic transformation occurred in the Shaw area centered on U Street, the heart of 20th century Black Washington. While the Shaw neighborhood’s population almost doubled, its Anglo population ballooned ten-fold, increasing Anglos from 11.4 percent to 61.7 percent of what had been the old City of Washington’s poorest neighborhood in the 1960s and 1970s.
Census tracts have changed between 1970 and 2015. For this reason the maps look slightly different. You can see the change in tracts by downloading this file.
- Central Northwest (bordered by Rock Creek Park, North Capitol Street, and Florida Avenue, NW): This area saw the second greatest racial change, shifting from 79.3 percent Black and 14.5 percent Anglo in 1980 to 42.4 percent Black and 30.6 percent Anglo in 2015. Interestingly, over 40 percent of the increase in Anglos within Central Northwest occurred in just those neighborhoods abutting the old City of Washington, such as Adams Morgan, Columbia Heights, and Le Droit Park;
- Central Northeast (bordered by North Capitol Street, Anacostia River, and Florida Avenue, NE: In Central Northeast, the modest change in racial composition was driven almost entirely by an almost seven-fold increase in Hispanic residents. Over the 35 years the percentage of Anglo residents was stable (14.3 percent to 14.7 percent); the proportion of Black residents declined modestly (83.3 percent to 72.7 percent); but the Black decline was replaced almost completely by Hispanic residents (1.2 percent to 9.1 percent).
Why does this statistical analysis classify D.C. as still “highly segregated” when many parts of the District show increasing racial diversity? It is the extreme degree of racial isolation of Blacks in east of the Anacostia River (basically, Wards 7 and 8) that accounts for it. Of the mono-racial census tracts (90 percent or more of a single race) 42 of D.C.’s 43 mono-racial tracts lie in East of the Anacostia River.
Suppose the eastern boundary of D.C. were the Anacostia River. The Black/all others segregation index would be 55—a level of medium segregation. In short, the old City of Washington, Central Northwest and Central Northeast, and even West of the Park are increasingly racially diverse. Is this integration stable or just a snapshot in time as neighborhoods re-segregate (from Black to Anglo) as appears to be the case with Shaw and Capitol Hill? Creating stable racial diversity is a challenge that DC faces.
The other pressing challenge is east of the Anacostia River. With federal Hope VI grants and other public/private financing, the DC Housing Authority has been replacing former public housing projects such as East Capitol Dwellings and Capitol View Plaza in Ward 7 and Sheridan Terrace and Barry Farms in Ward 8 with mixed-use, mixed-income developments featuring both affordable rentals and home ownership. This has introduced a modicum of greater economic diversity but not, to date, racial diversity. Eliminating such “poverty factories” has helped stimulate the first private, market-rate home building in east of the Anacostia River.
This article has focused on the District of Columbia as the “central city.” However, the real city is the entire Washington metropolitan area. The status of racial diversity in the entire region and how we compare with other regions will be the topic of the next article.