Housing is the great stage on which a city is built.
Housing defines how residents share the wealth created by a city and how they access its assets and amenities. Population growth and demographic changes make their imprints through the housing market, shaped by how quickly supply responds to changes in demand. When housing is constrained, these forces deliver gentrification, economic and racial segregation, and displacement.
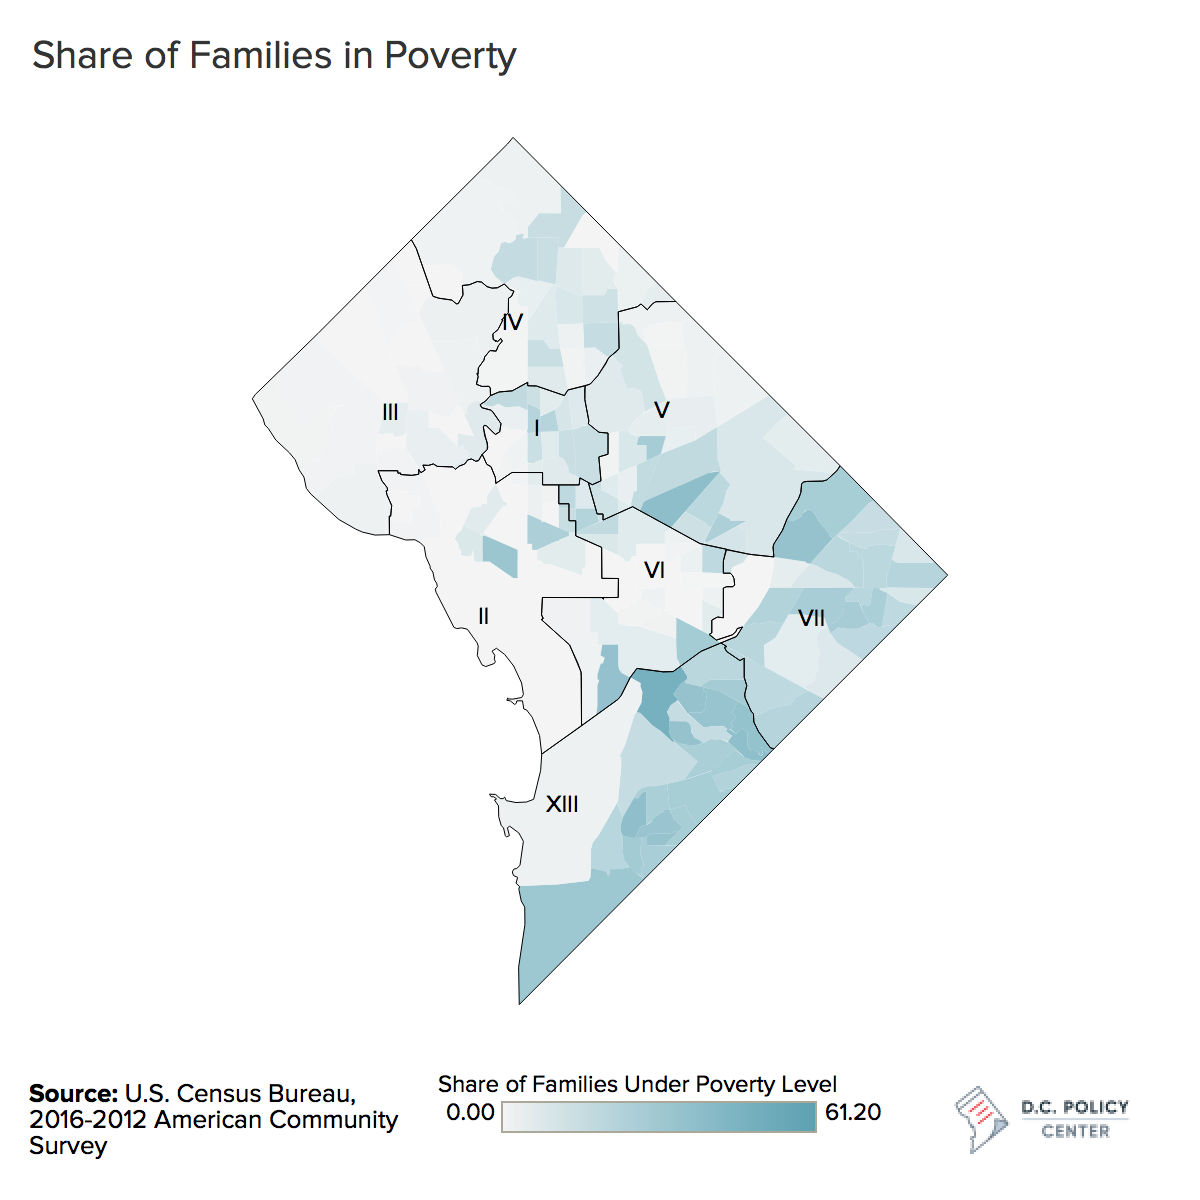
The District is experiencing what happens to a city when that stage is broken. The District’s phenomenal population growth and the accompanying economic boom has completely changed it, but not always for the better. The city is clearly richer, but it is also less inclusive and more segregated. Many new families are now settling in the city—a promising sign of city’s increasing attractiveness, including better schools and other amenities that appeal to families. Families that make over $200,000 now comprise 22 percent of all families compared to 14 percent in 2010,[1] and these families increasingly settling in central parts of the city. But poverty is becoming increasingly concentrated in other parts of the city: There are 21 census tracts in the greater metro area where more than 40 percent of households are in poverty—twice as many as they were in 2010—and all of these neighborhoods are in Washington, D.C. In some parts of Ward 7 and 8, the neighborhood-level poverty rate is over 60 percent.
And that kind of inequality is measured just on income flows. The picture changes for the worse when one includes the most valuable asset a household owns: its own home.
Housing is among the greatest sources of wealth in the District.
In 2018, the homes in D.C. were collectively worth $137.5 billion in the eyes of the city’s tax assessors.[2] This is an amount equivalent to 1.5 times the value of all goods and services produced in D.C. that year,[3] and more than five times the income earned by District residents. Here is another way to think about it: If you were to fold the value of these homes into one single bond that pays a dividend for eternity with a 3 percent interest, each and every D.C. resident would receive $6,000 per year. For a family of four, that is $24,000—the difference between nothing and being out of poverty.
Of this housing wealth, $68 billion belongs to 100,074 homeowners [4]—and how much of this wealth they hold depend on where they live, what type of a home they own, and how long they have owned it. To be sure, this great source inequality in wealth associated with home ownership, both stemming from homeownership and the great variations in the value of housing across the city, has deep historical roots. National housing policies—including redlining, restrictive covenants, lack of access to FHA and VA loans—have kept communities of color from homeownership. In D.C., urban renewal wiped out almost all of Southwest’s buildings, forced out 15,000 businesses, and displaced 23,000 residents, 70 percent of who were Black and 90 percent of whom were poor. The District’s own policies played a role too: Almost half of the displaced residents moved to far southeast, where 75 percent of the land was zoned for apartments—a policy with implications lasting today.
However, current practices also contribute to the growing housing inequalities. Wealth associated with housing grew especially quickly since 2000, with the population boom. Demand for housing increased, but supply did not. Restrictive zoning, resistance to new development among D.C. residents, and the disparate nature of neighborhoods in the District—both in public and private investments—have put great pressure on housing prices, especially in some parts of the city. As a result, wealth created by a growing economy and increasing public and private investments is largely capitalized in housing—and as I will show, not in newly built housing, but in housing that already existed in the city before the population boom, sucking out a great share of the value created by hard work. Increasing housing burdens have pushed many residents out of the city, or to neighborhoods with few public and private amenities; these dynamics further deepen poverty and economic segregation, which goes hand-in-hand with racial segregation in the District of Columbia.
Home ownership and the wealth associated with it eludes communities of color.
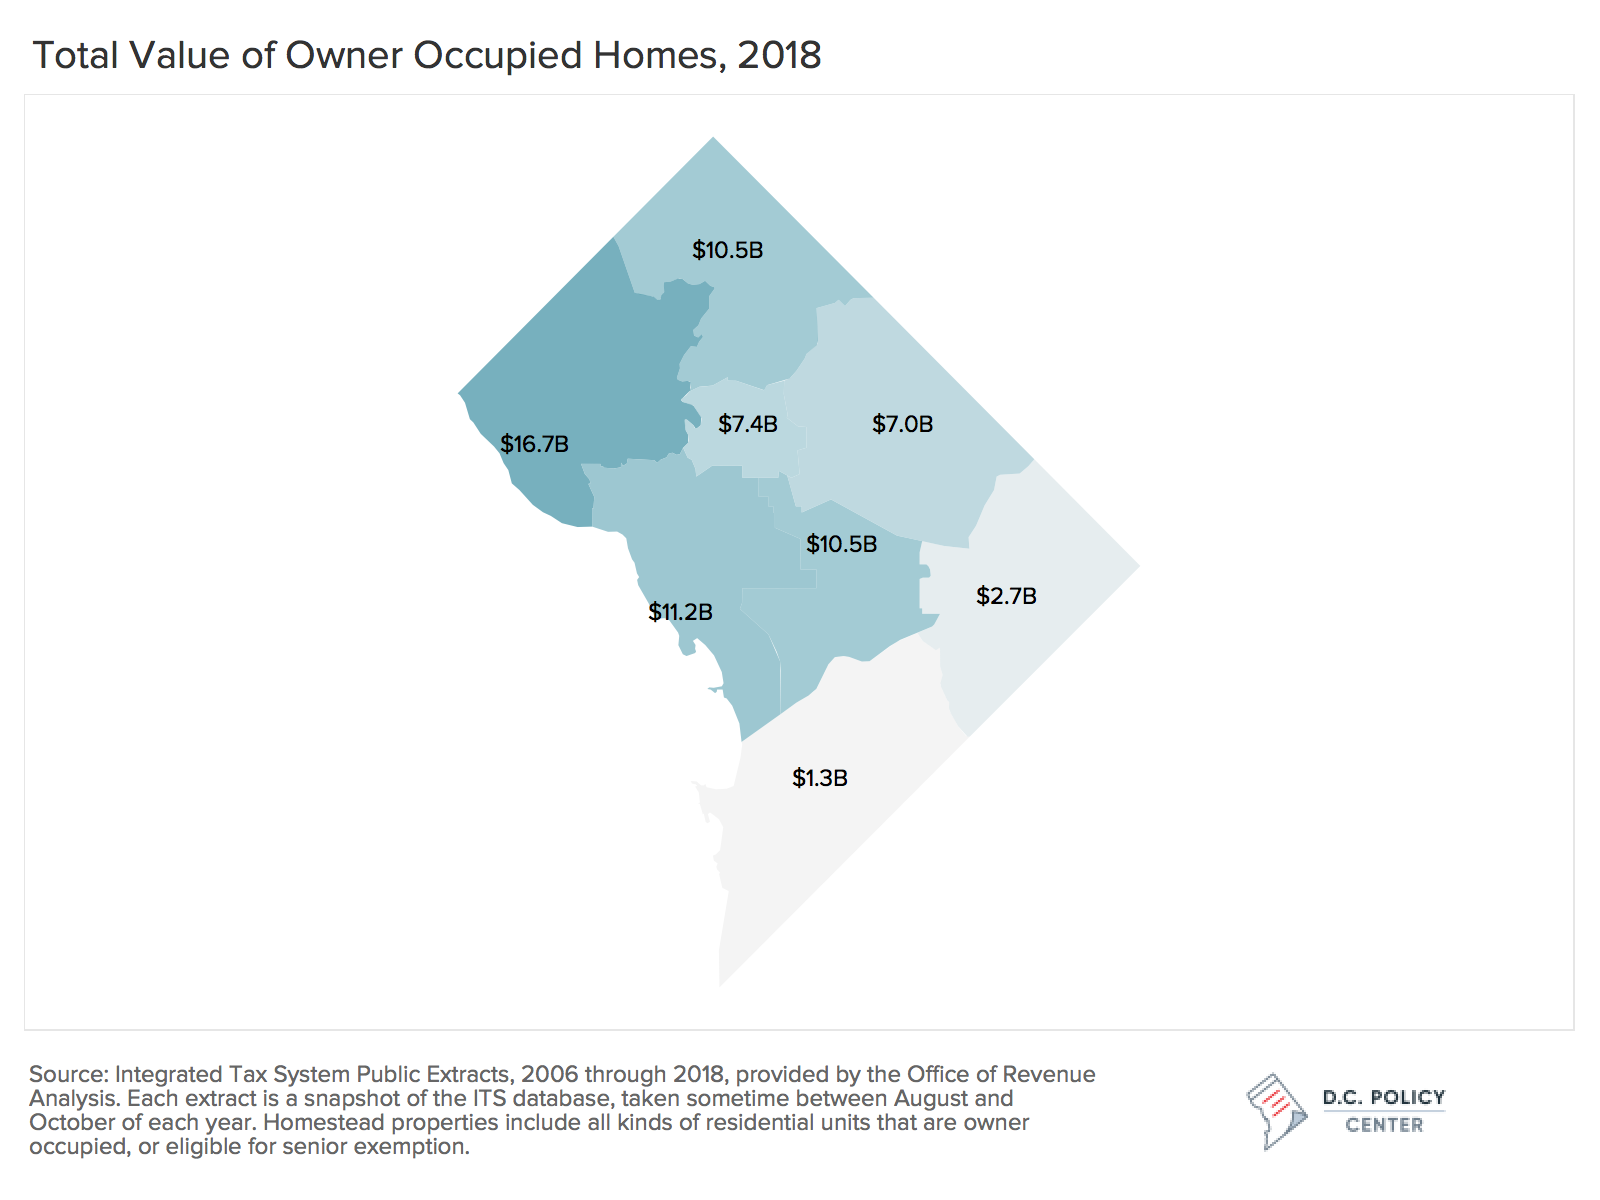
According to Census estimates, only 36 percent of households headed by a Black D.C. resident own the home they live in, compared to 47 percent of households headed by a white resident.[5] Of the 120,000 households headed by a Black resident, 73,500 rent their homes. In addition, Black homeowners hold a meager share of the housing wealth—largely because of where they live. To wit, four wards—2,3,4 and 6—account for 72 percent of all wealth embedded in owner-occupied housing. In contrast, Ward 7 accounts for 4 percent, and Ward 8, only 2 percent. In Wards 7 and 8, for example, 66 and 78 percent of single-family homes are assessed at or under $250,000 respectively, and not a single home is assessed over $750,000 in 2018. In Ward 2, only 8 percent of single-family homes are assessed at a value less than $750,000; in Ward 3, this share is only 6 percent. Even when controlling for housing size, the value disparities are great: most homes east of the Anacostia River are estimated to be valued at around $111 per square foot, compared to $450 to $800 in parts of the city west of the Rock Creek Park.
Changes in home ownership patterns follow the District’s Great Demographic shift.
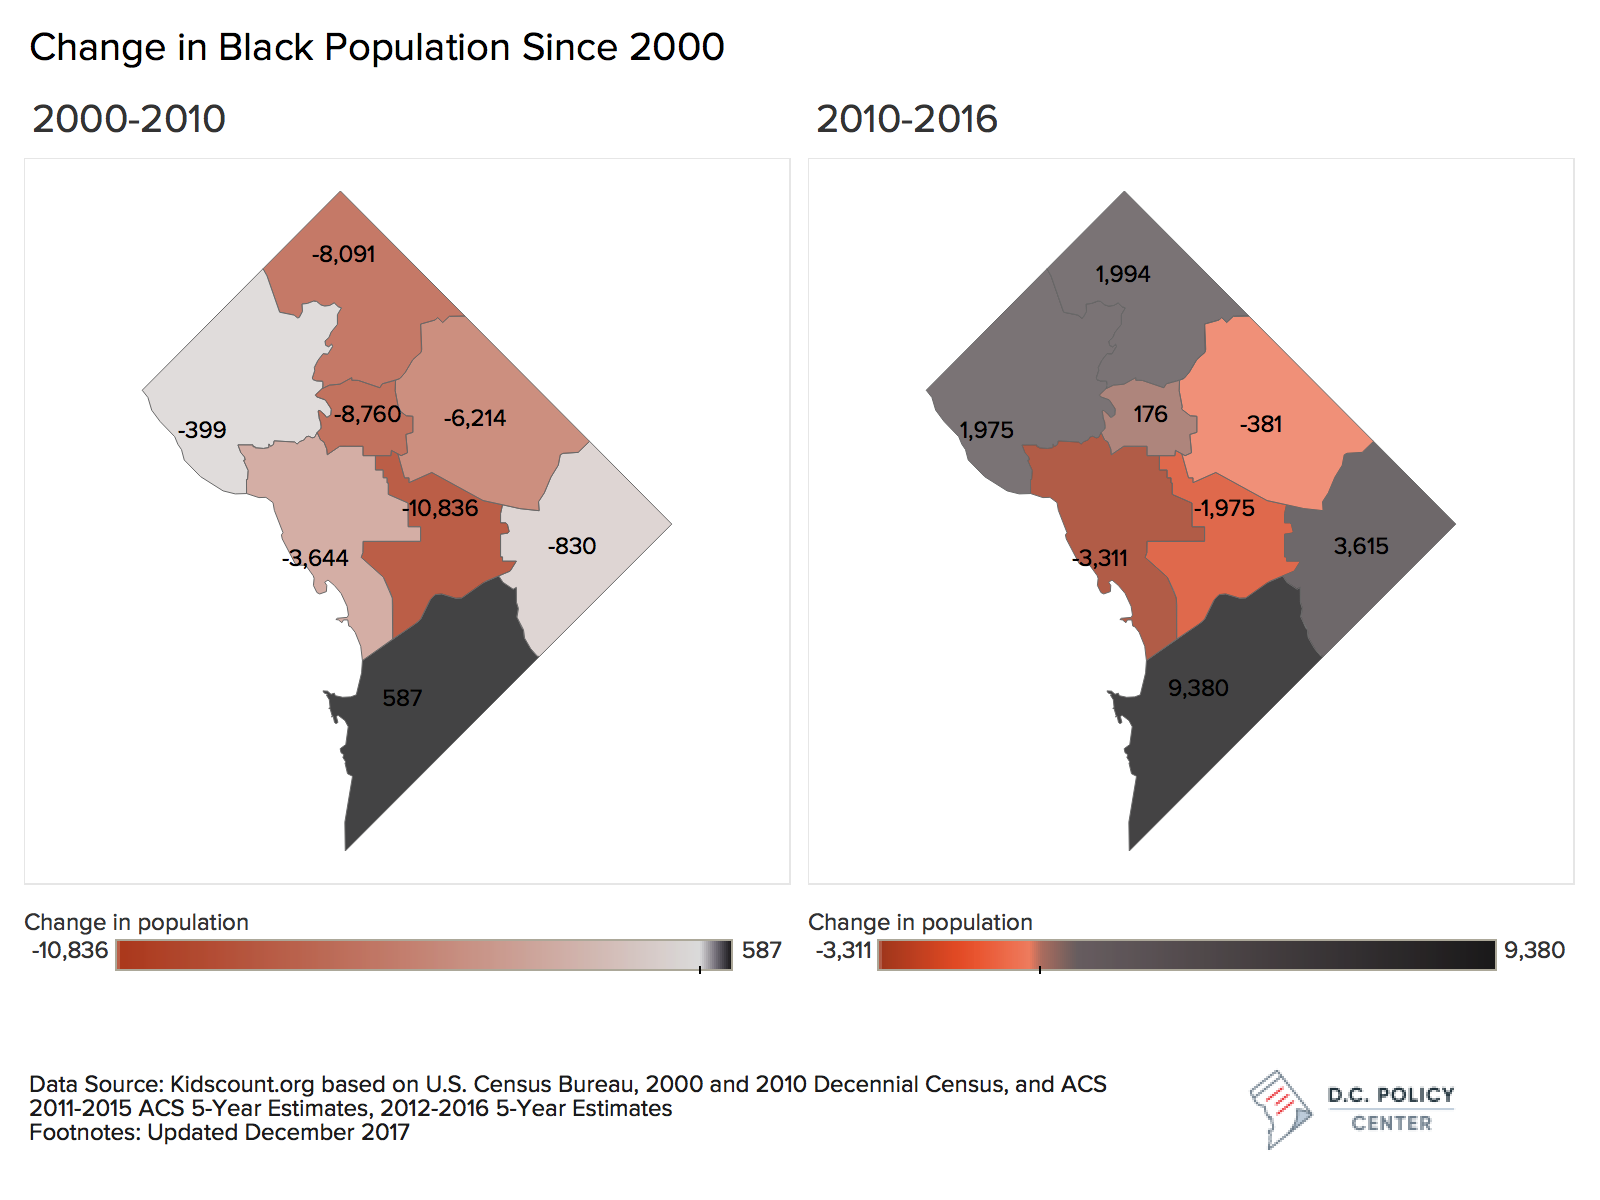
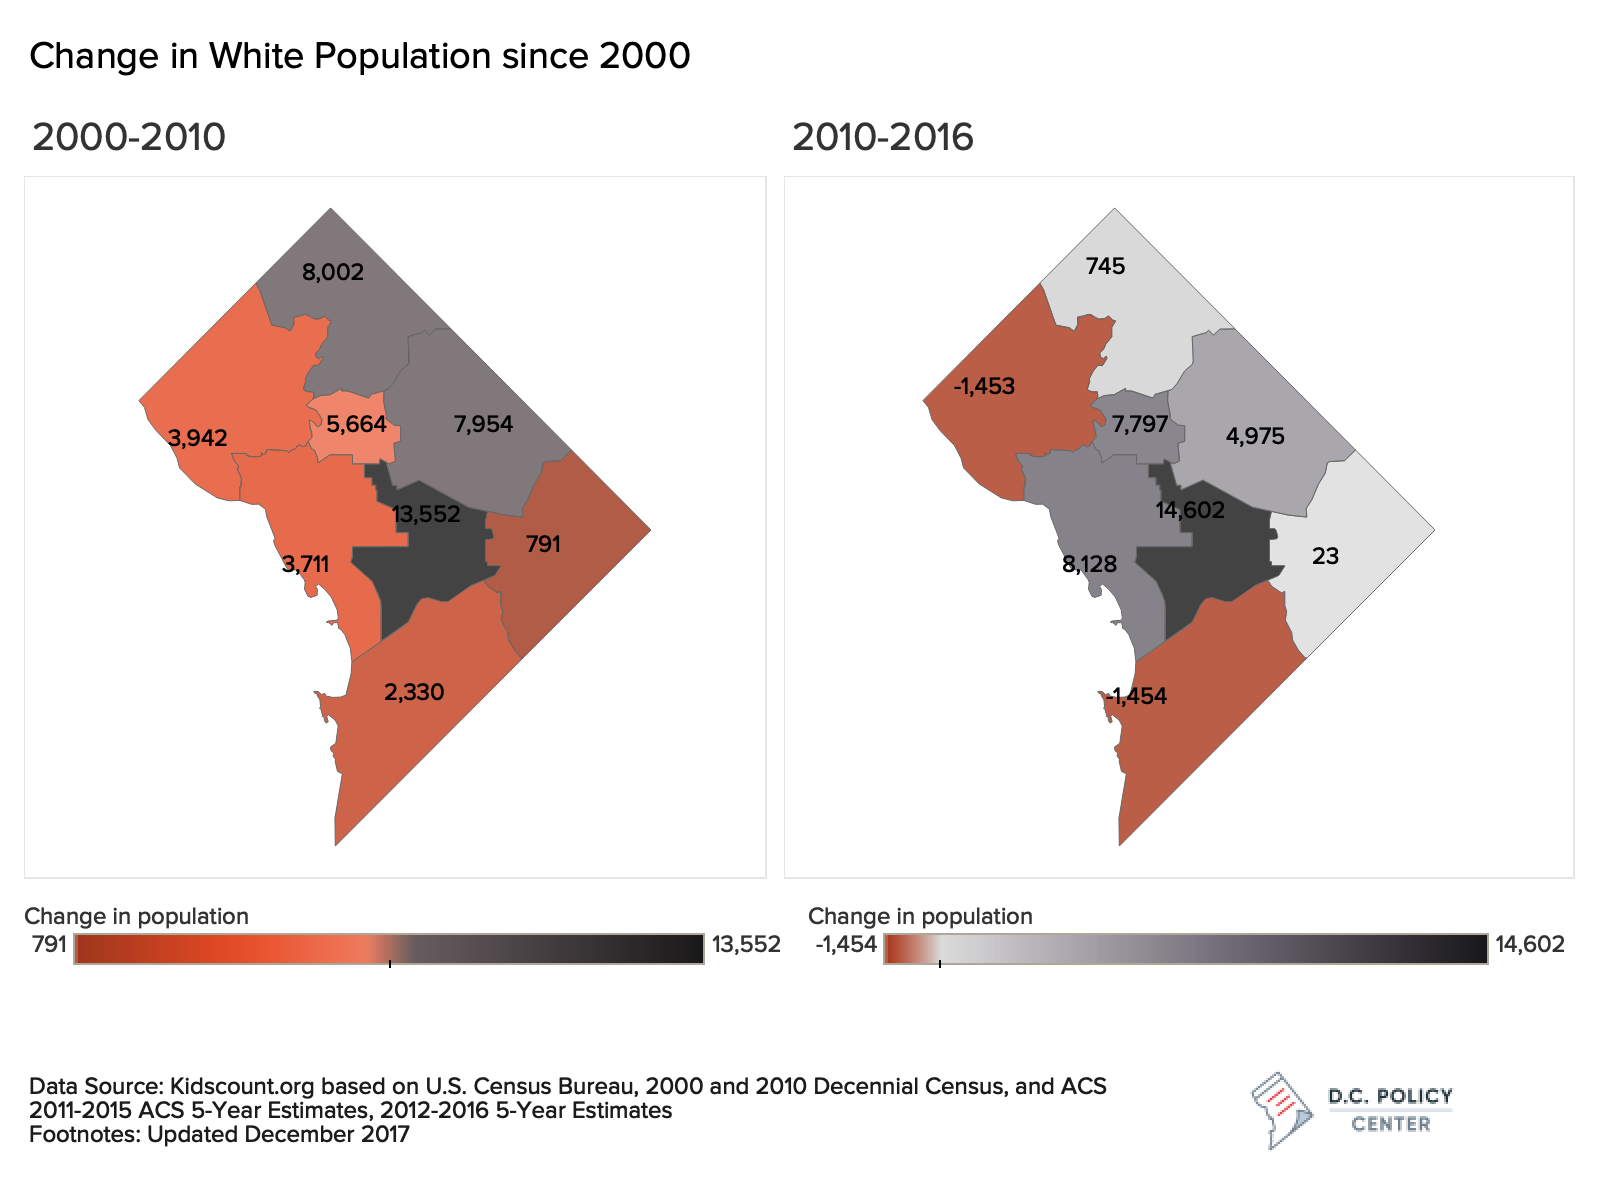
The District of Columbia has experienced a great demographic shift since 2000, rapidly expanding its population and changing its makeup. There are 130,000 more residents in the city compared to 2000, and Black and African American residents are no longer the majority (at 47 percent).
This change happened twice as fast for Black residents than it did for the White population in D.C. during this period of time. While the number of Black residents in D.C. declined sharply after the 1970s, the trend continued through recent years: 38,000 Black residents left the city between 2000 and 2010. During that period, District’s Black residents moved out of every ward except for Ward 8, and the draining of Wards 1, 4, 5, and 6—with neighborhoods traditionally home to middle and upper-middle-income African American families—was especially rapid. Many of these residents settled in Prince George’s county, but some moved out further. Since 2010, the Black population has been increasing, but not as fast as other races and ethnicities. Between 2010 and 2016, 11,473 Black residents have moved into the city, especially into Ward 8 (some of them might have moved from central parts of the city), but growth is also strong in Ward 7 (again attracting middle and upper-middle income Black residents from elsewhere in the city) and burgeoning in Wards 3 and 4. The decline of Black population in Wards 5 and 6 appears to have slowed down, but continues downtown.
The influx of White residents into D.C., in comparison, has been going strong since 2000 without any signs of slowing down. Between 2000 and 2010, 33,000 new White residents (on net) moved into the city, and majority of them settled in downtown, Capitol Hill and the surrounding areas. According to Census Bureau data, just over 14,000 White residents moved into Ward 6, and another 15,000 into the Downtown areas in parts of Wards 1 and 2. These included the first round of gentrifiers: young professionals who can easily move into parts of the city that had not been very friendly to families. Ward 5 received about 5,000 new White residents, and White families continued to leave Ward 3 and Ward 8. The growth in the District’s White population has grown stronger since 2010, and there has been a baby boom across all income levels. Over this time period, roughly 45,946 new White residents moved into the city, settling in every Ward, but especially in Wards 1, 4, 5, and 6.
The number of owner-occupied homes has increased, but this is mainly because of newly constructed condominiums.
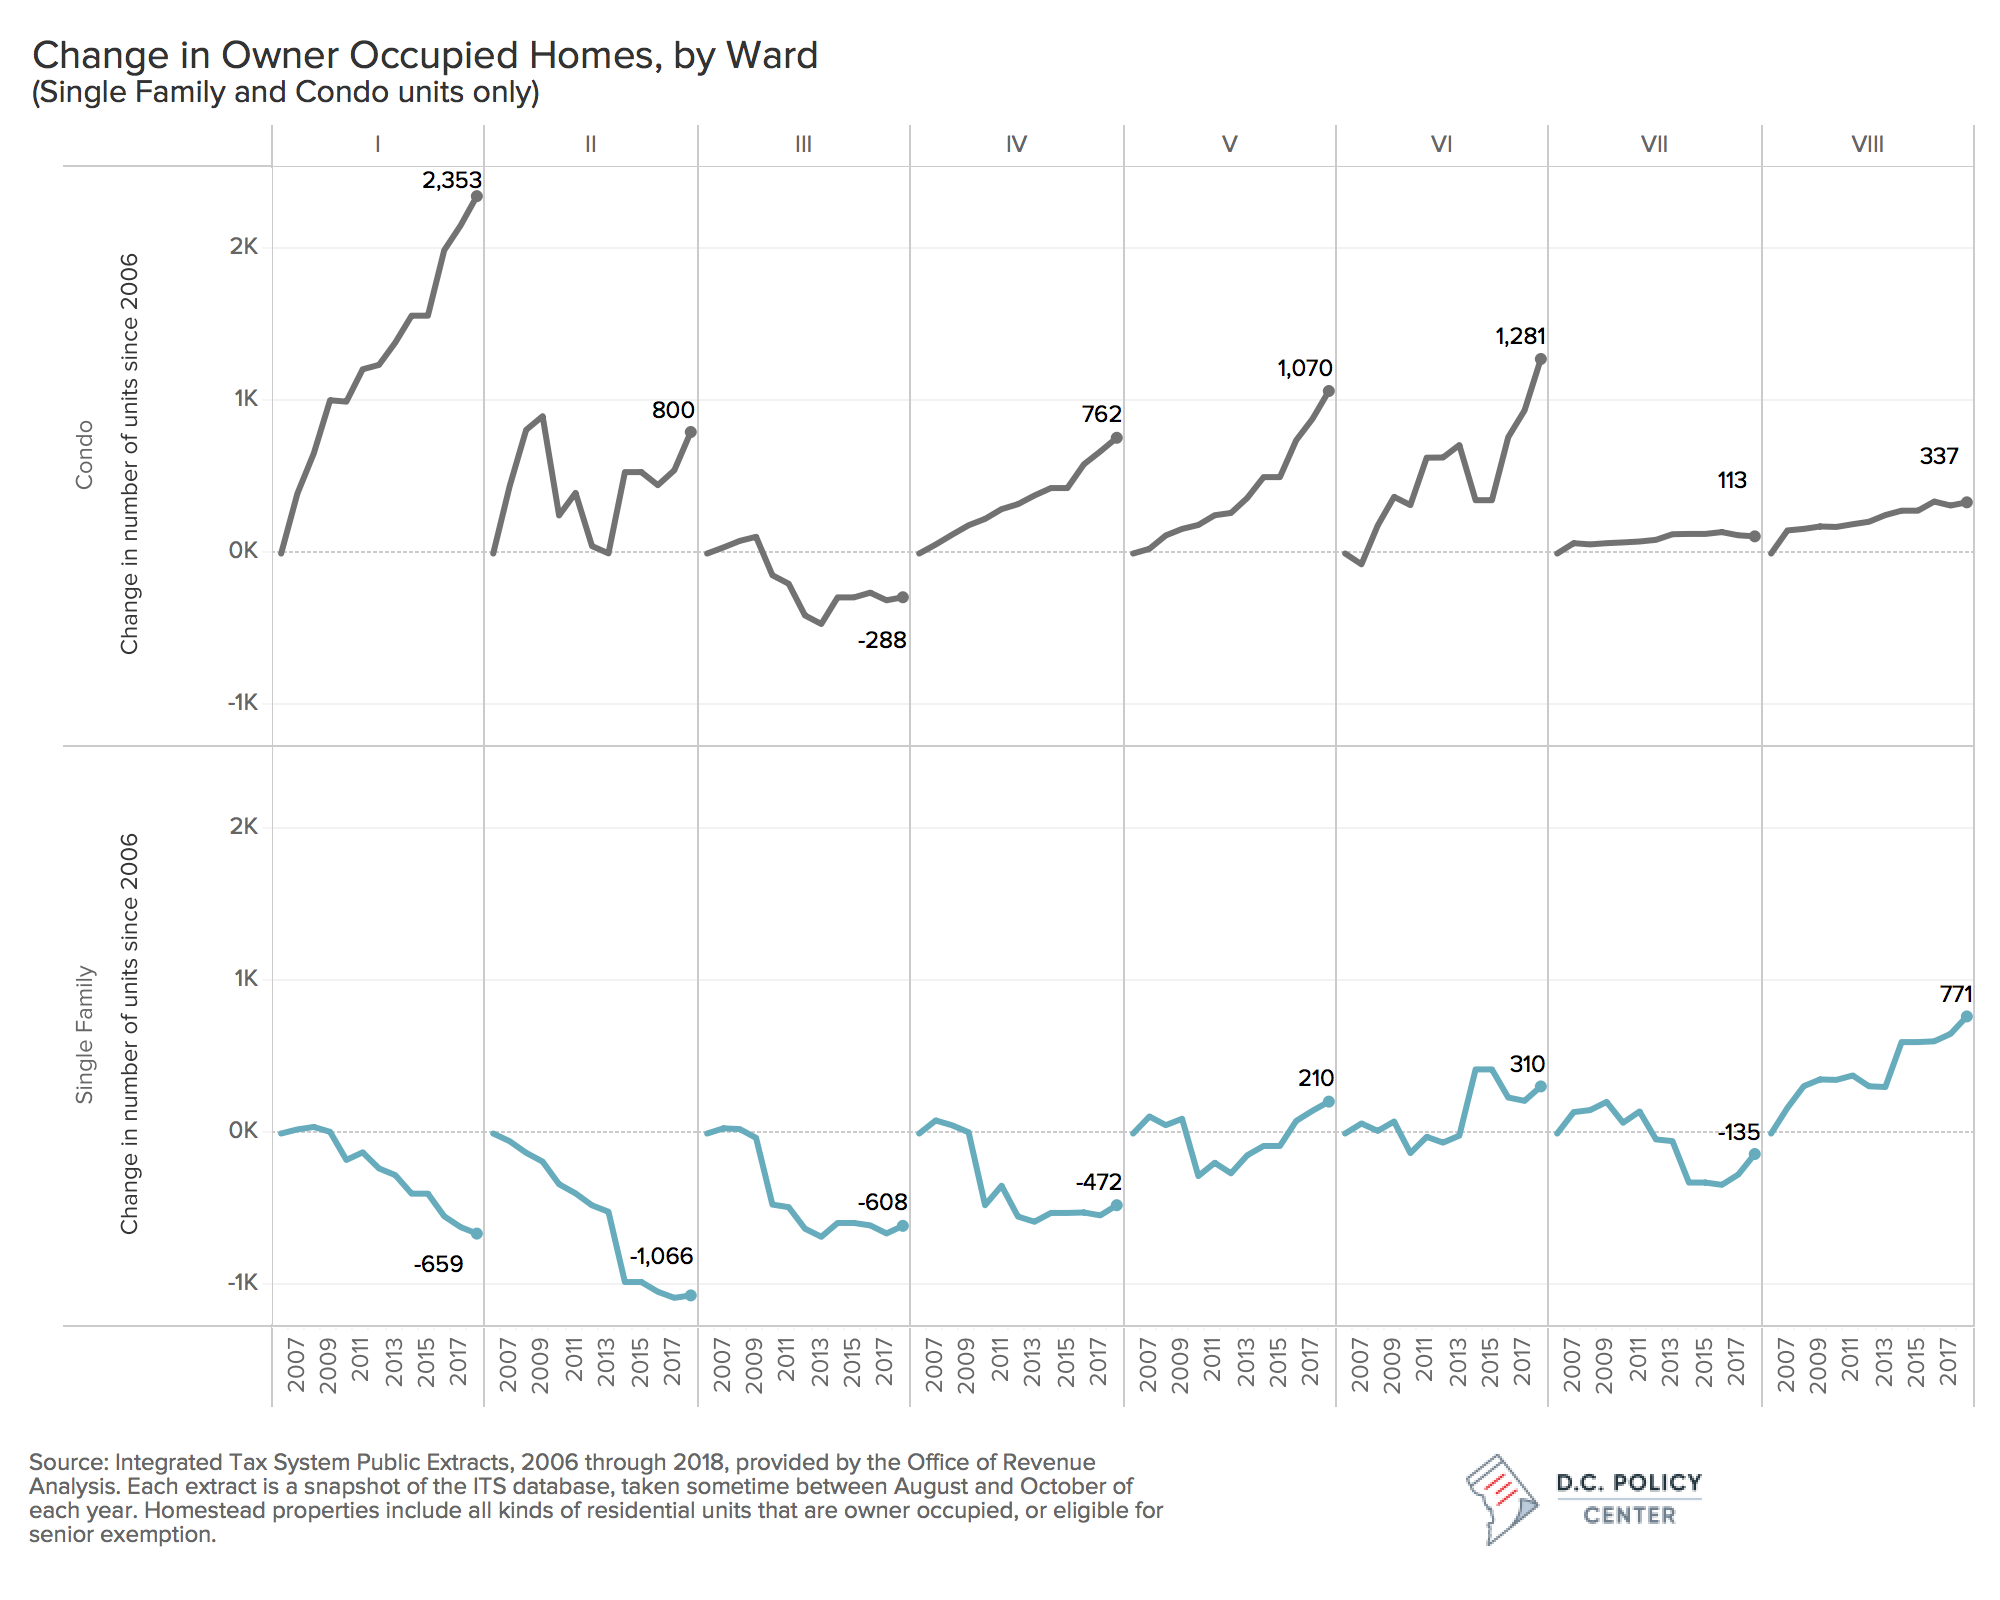
The population boom has increased home ownership, but mostly because of the increases in the number of owner-occupied multifamily units—especially condominiums that have been newly constructed. In 2006—the first year for which we have reliable tax assessment data—there were 91,277 market rate owner-occupied units in the city.[6] In 2018, this number stands at 96,000—a meager increase. But hidden in that number is also a shift in the types of homes residents own: Between 2006 and 2018, the number of single-family homes occupied by their owners actually declined by 1,649 units, while the number of owner-occupied condominiums increased by 6,428.
Wards 1, 5, and 7 account for all the net increase in home ownership (4,500 out of 4,700). For example, in Ward 1, we find over 4,100 new condominiums, over half occupied by their owners. In contrast, single-family homes declined by 823 (many razed to make room)—and owner-occupied single-family homes by about half that. Wards 5 and 6, where gentrification has been most rapid, are the only places where home ownership increased both in single-family and multi-family properties. Ward 5 added 2,000 new condo units, half owner-occupied, and Ward 6 added 3,350, again about half (1,281) occupied by their owners. There are fewer owner-occupied homes in Wards 2 and 3, but overall still more of the owner-occupied units are here in these Wards, with some neighborhoods where home ownership rates are close to 90 percent. There has been no change in Ward 7, where the number of all units only increased by about 1,000. The only Ward where single-family home ownership increased faster than multi-family units is Ward 8, and that is due to fewer new constructions.
While growth in home ownership is due to new construction, the growth in value has been capitalized in older residential units.
Between 2006 and 2018, housing values measured by their assessed values appreciated much faster than the growth in owner-occupied units. To wit, the median assessed value of owner-occupied homes increased from $320,000 to $535,000 between 2006 and 2010. The odds of finding an owner-occupied home assessed under $350,000 is now 30 percent lower compared to 2006, and the odds of finding one over $800,000 is 16 percent higher.
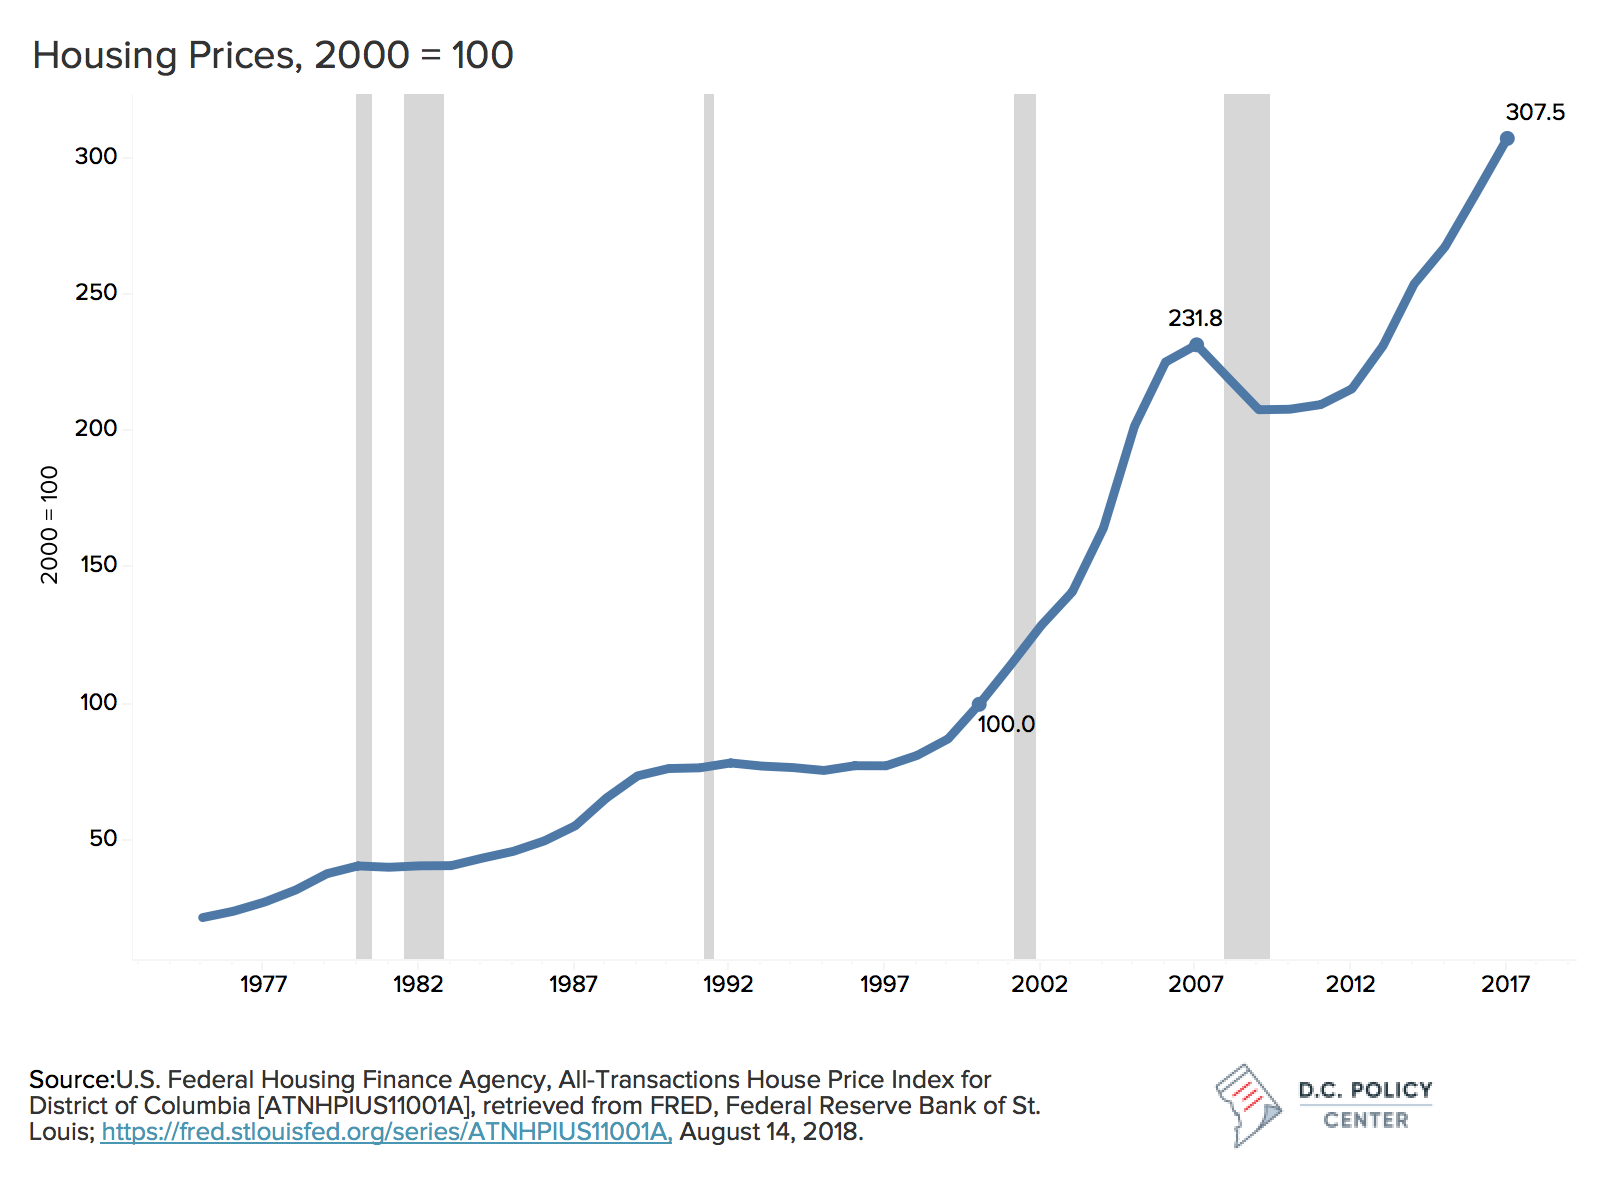
The rapid appreciation in housing values is the result of the great demographic shift. Housing values (measured by the sale prices and not assessed values) remained stable through 1990s, but rapidly appreciated between 2000 and 2018, except for a brief period of decline through the Great Recession. If you bought your house in D.C. before 2000, you could be sitting on an asset at least three times more valuable than what you bought. This is a return six times the increase the Consumer Price Index during this time. That difference is what economists call “rent”—an earning not related to productivity or output, but purely delivered by happenstance, like the income differential between a talented painter and a mediocre one. So, if you bought a house in D.C. in 2000 for $200,000 (in today’s dollars) and sold it for $600,000 in 2017, $332,000 of your $400,000 “profit” is because the housing supply in the District cannot grow fast enough to meet the housing demand.
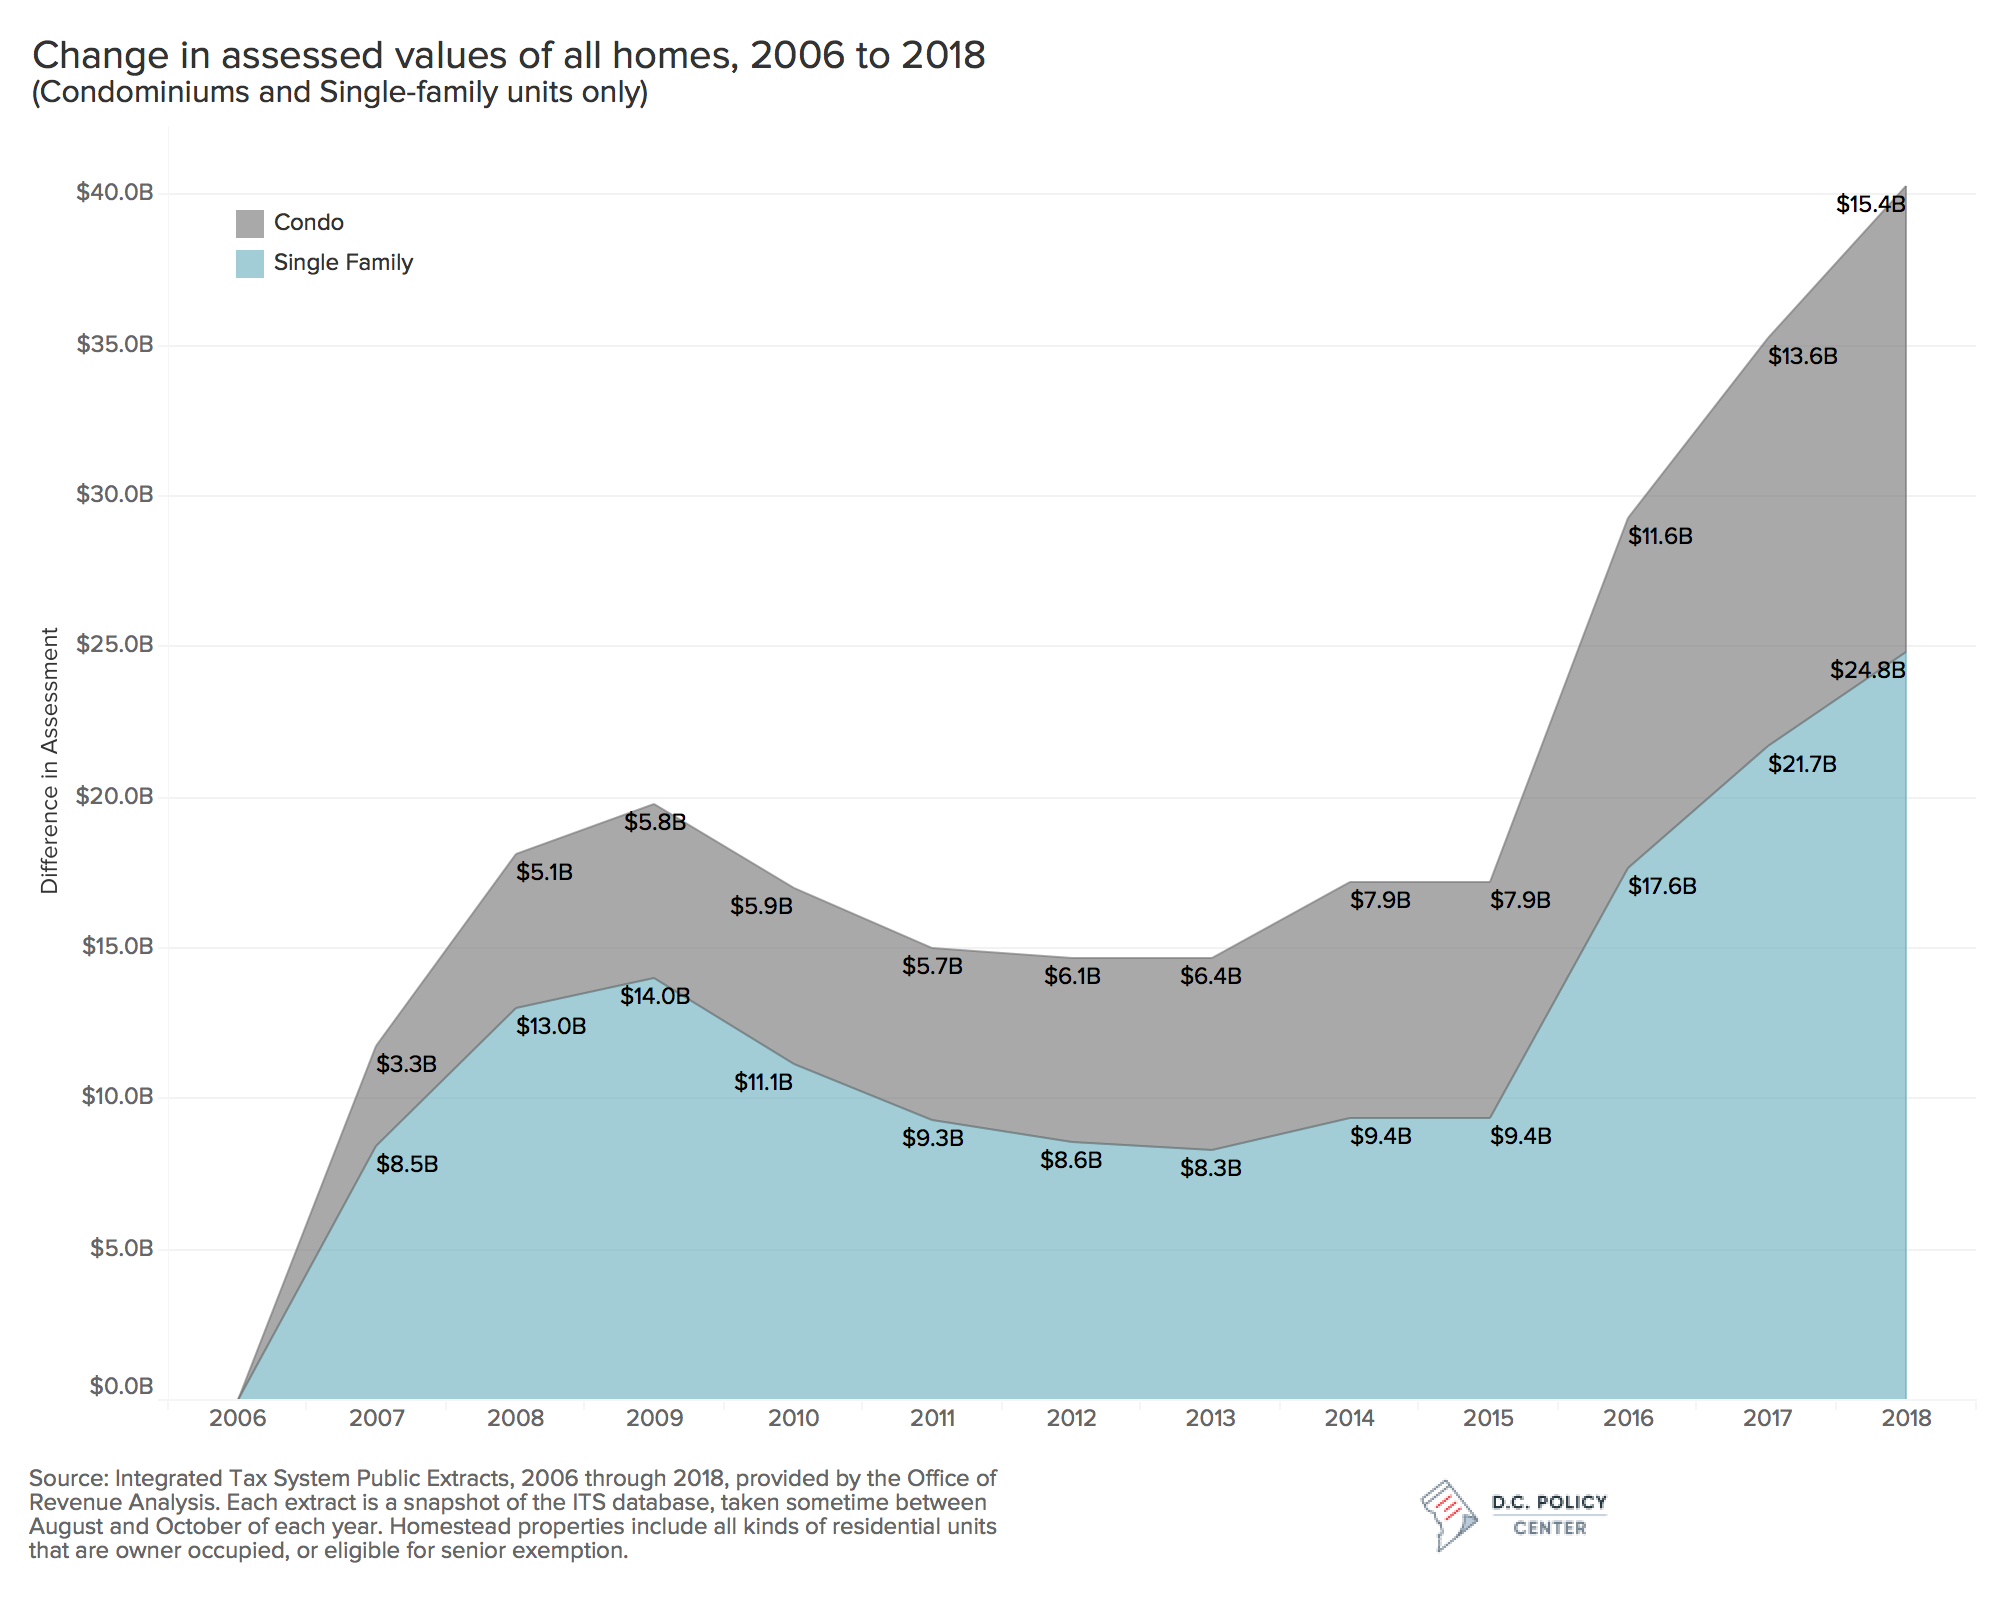
Importantly, more of this new wealth in housing has capitalized in existing homes and not new construction. Much of the housing that exists is because developers bought the land and built the housing they thought they could sell or rent. The late growth in housing supply in D.C. has been entirely driven by new multi-family units, as developers are rushing to meet the demand from young singles and couples in parts of the city that offer amenities these new residents demand. As such, the growth in owner-occupied housing has been a function of new construction of condominiums. Between 2006 and 2018, the District’s single-family housing stock tracked by its real property tax database shows a net increase by a total of 1,820 units (2 percent growth)[7], whereas condo units increased by 22,256 (50 percent growth). In contrast, the assessed value of all single-family homes (whether owner-occupied or rented) increased by $24.8 billion during this period (63 percent, or 31 times the growth in the size of the stock) compared to $15.5 billion for all condominiums (140 percent or less than three times the growth in the size of the stock).
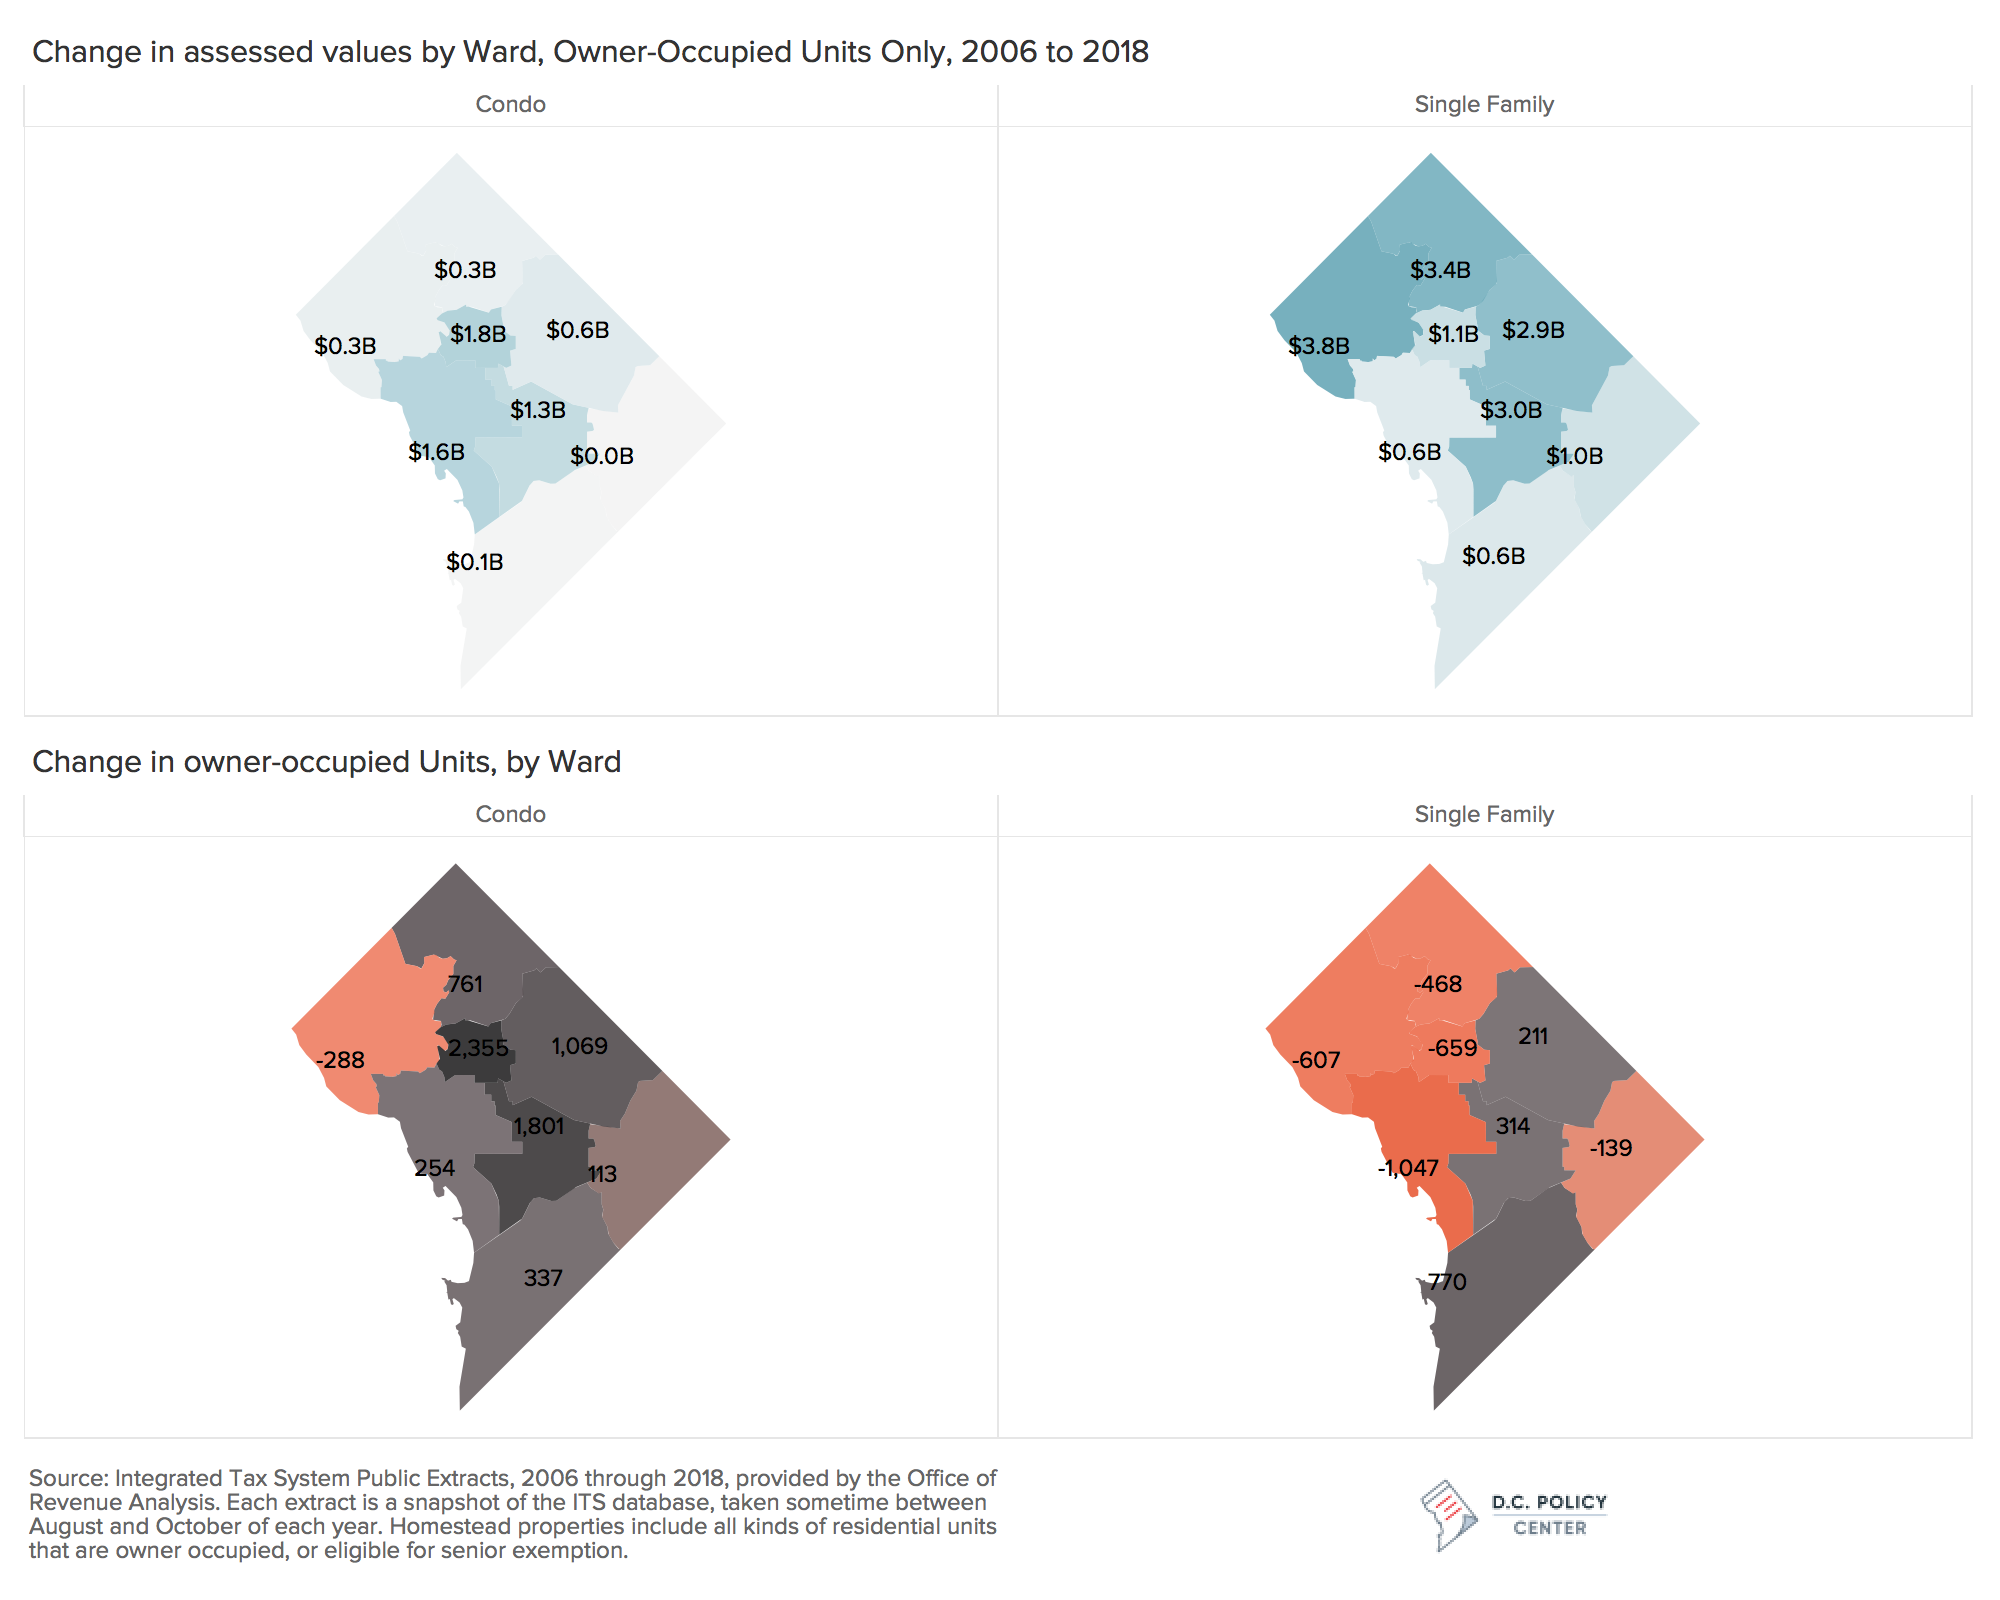
To be sure, this single-family unit premium partly reflects the tastes and preferences that favor larger units with a backyard. But it also reflects the value of amenities in parts of the city which holds these types of units: Better schools, safer neighborhoods, access to transportation, and things that improve one’s quality of life—all of which reflect the quality and quantity of public and private investments in these neighborhoods. Overall assessed values of owner-occupied single-family homes increased by over $3 billion in Wards 3 and 4, while the number of owner-occupied single-family units have declined by more than a combined 1,000. Restrictions to new development in these neighborhoods, and a lack of investment in parts of the city that do not have attractive amenities, amplify this premium and place it in the hands of those who could afford to live in highly resourced neighborhoods.
We cannot know the race or ethnicity of homeowners from the available data on the real property tax base. But comparing the growth in owner-occupied housing since 2006 both by the number of units and the value of these units show that increased values eluded communities east of the river. Going back to the maps of demographic change, these also show that the greatest value gains have been in parts of the city that have seen the greatest demographic shifts.
The tax treatment of home ownership is amplifying inequities.
The District, like many other cities, has adopted policies to reduce housing discrimination, encourage housing production, preserve some neighborhoods affordable, and increase affordability in others. These policies include building codes for safety, taxation to raise money for services, zoning to preserve neighborhood character, and—much later—anti-discrimination laws. To promote affordability, there is rent control, public housing, participation in federal programs (such as FHA loans and Section 8 rental assistance), the Housing Production Trust Fund, DOPA and TOPA laws, Inclusionary Zoning requirements, and preservation efforts. These programs have made important gains towards preservation of housing for low-income communities, but they have not stopped the growing cost of and inequalities in homeownership. That these policies have been adopted does not mean they been successful in accomplishing their stated objectives or are free of unintended consequences.[8]
One policy tool that the District uses to support housing is tax expenditures. Tax expenditures refer to various tax reductions and exemptions that aim to reduce housing burdens and homeownership. The District has instituted 30 tax expenditure programs, ranging from property tax exemptions to income tax refunds, for residents struggling with high housing costs. These expenditures reduced total tax revenue by $163 million in fiscal year 2018—more than what the city invested in the Housing Production Trust Fund. (For a comprehensive list of all tax expenditures, see the Office of Chief Financial Officer’s biennial Tax Expenditure Reports, most recently published this year). This is in addition to an estimated $167 million revenue foregone because of federal tax preferences for homeowners.[9] Importantly, the tax benefits from some of these programs only accrue to current homeowners, and the value of the benefits grow with the value of their homes.
The District’s tax expenditure programs related to housing showcase some of the unintended consequences of government programs on racial equity. Of the $163 million of tax expenditures related to housing, more than half ($88 million) is because of two programs: The homestead deduction and the real property tax cap. The homestead deduction exempts a fixed amount of housing value from real property taxes for owner-occupied homes. In 2018, this amount was $73,450. The real property tax cap limits the growth in the taxable assessments of owner-occupied homes to 10 percent (and beginning next year, to 5 percent for seniors with low incomes). An analysis show that the impacts of these two tax preferences have affected different parts of the city in different ways, benefitting parts of the city where price appreciations have been most dramatic. Furthermore, these policies have created all kinds of inequalities, some systematically reflecting the different appreciations that follow the path of gentrification.
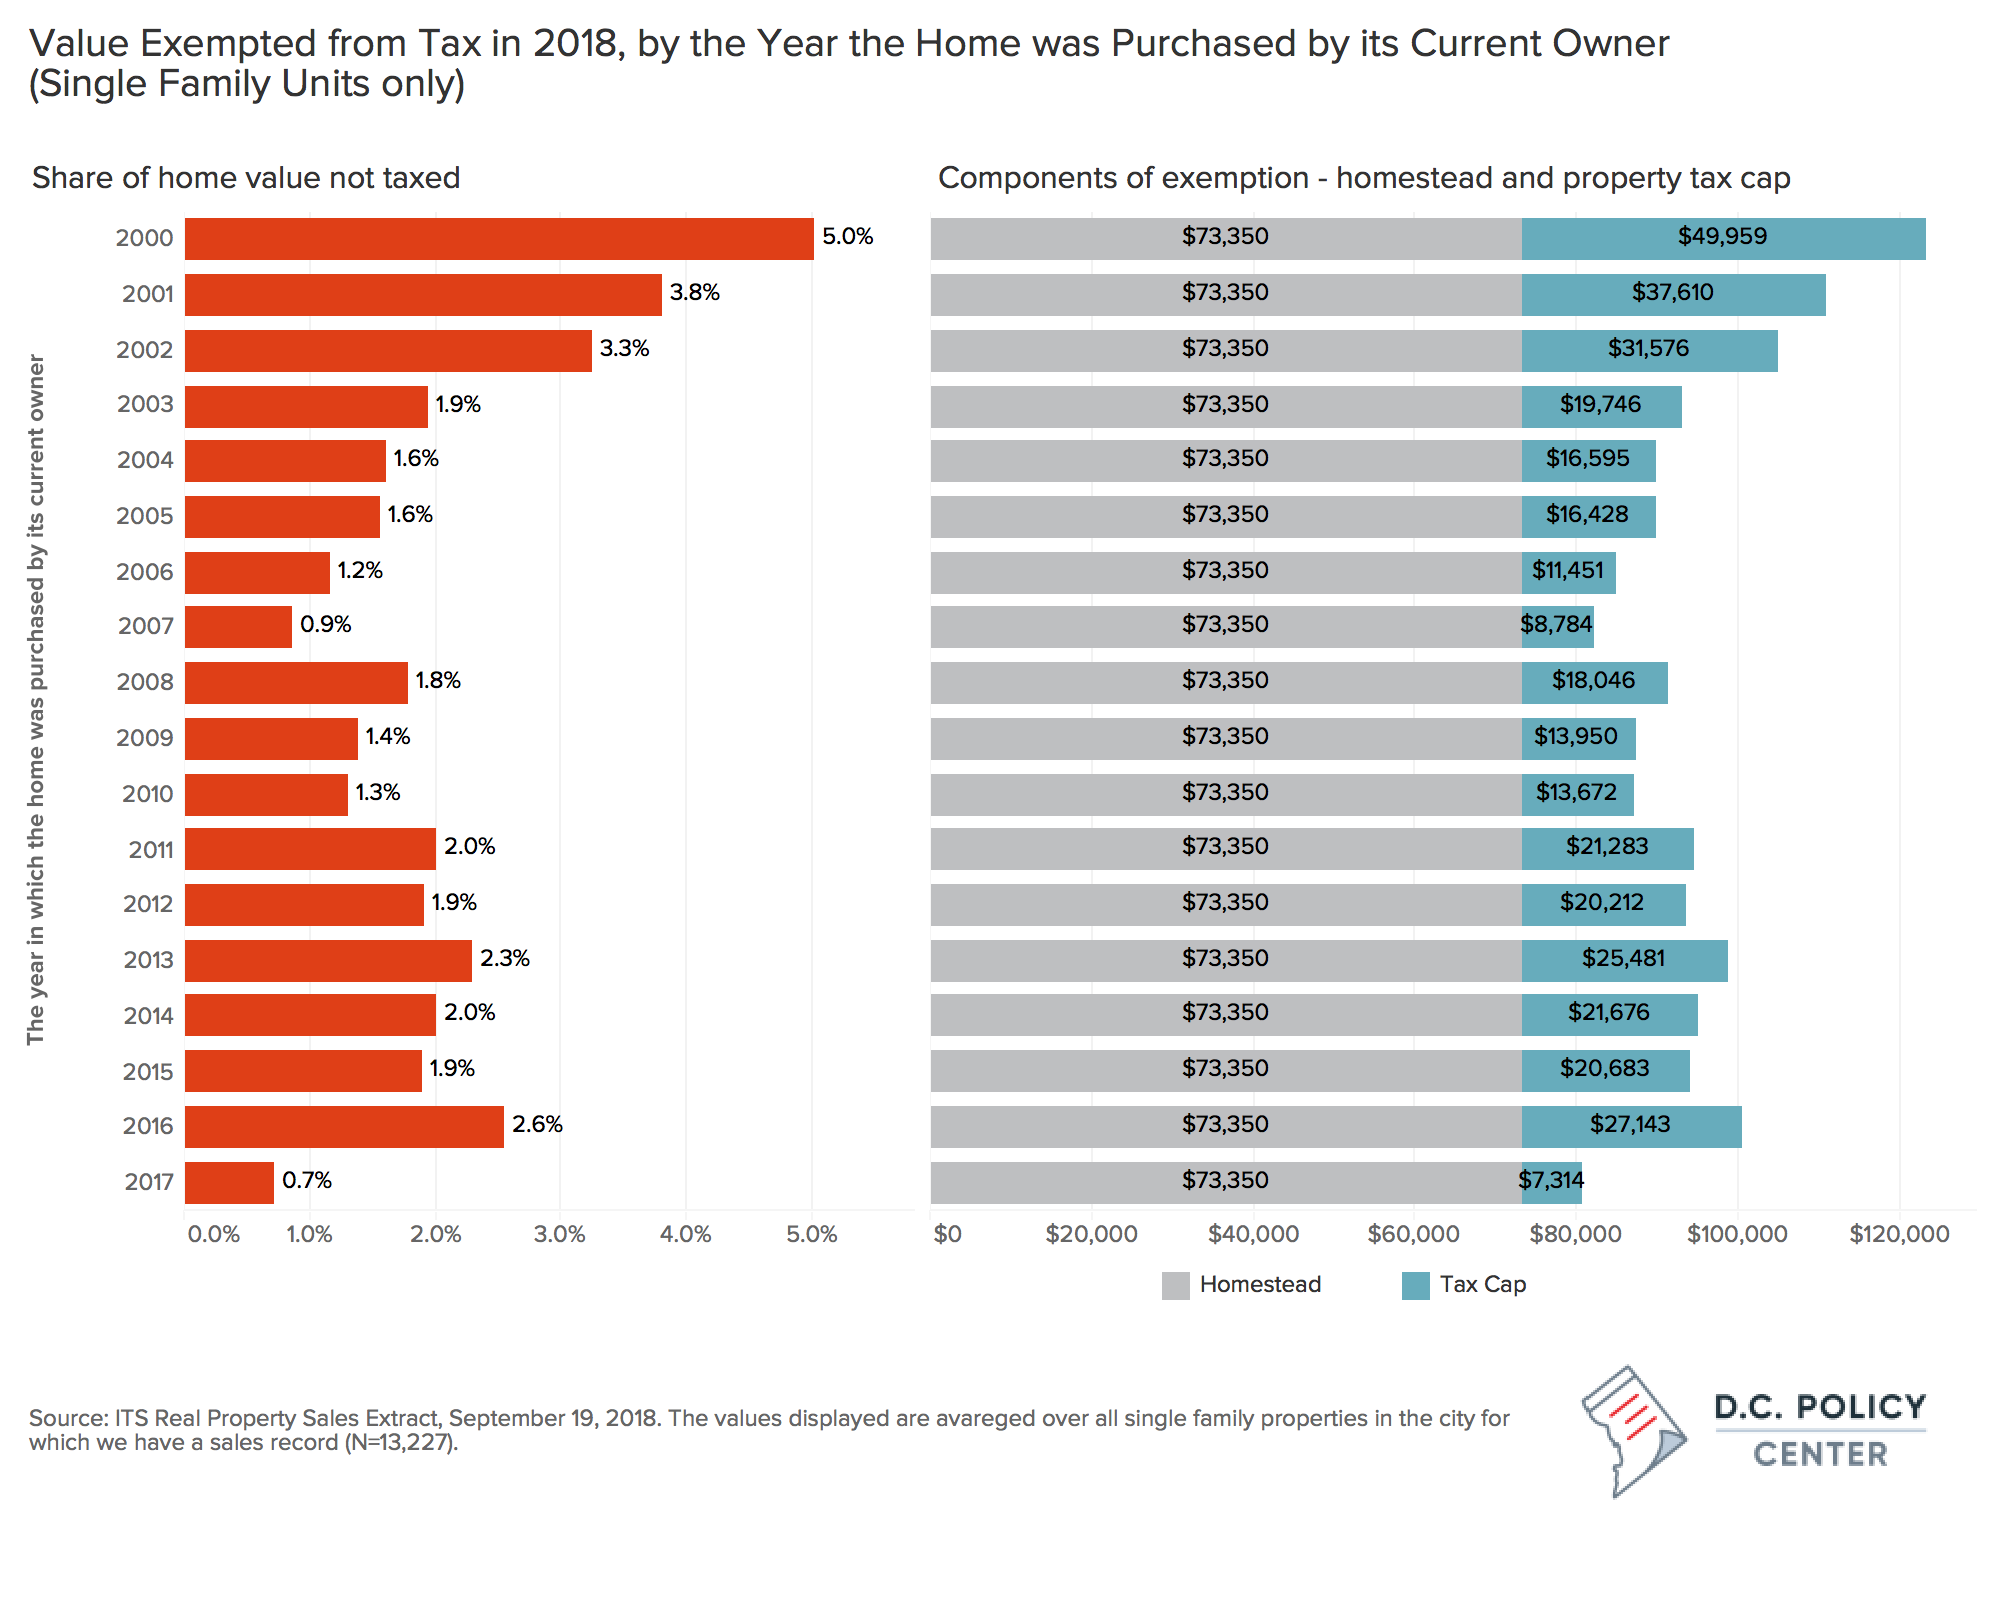
The homestead deduction and the property tax cap operate in different—and sometimes conflicting—ways. The homestead deduction wipes of a fixed amount from each owner-occupied home’s value. Thus, the relative value of the benefit is greater for homes with lower value. The cap, however, yields a much greater value to those who happen to live in neighborhoods that have seen the greatest amount of appreciation. The cap benefits the most who have held longest to their homes and therefore accumulated years of growth in value. For example, in 2018, homeowners who have purchased their homes in back in 2000 had, on average, 5 percent of their home value exempted from taxes, and about 40 percent of this was because of the cap. In contrast, homeowners who purchased their homes seven years later, in 2007, right before the Great Recession, have only 1 percent of their home values exempted, and the part associated with the property tax cap is about 10 percent of this value. Similarly, those who bought their homes last year in 2017, on average, had 0.7 percent of their home value exempted from taxes, and only 9 percent of this value was because of the cap.
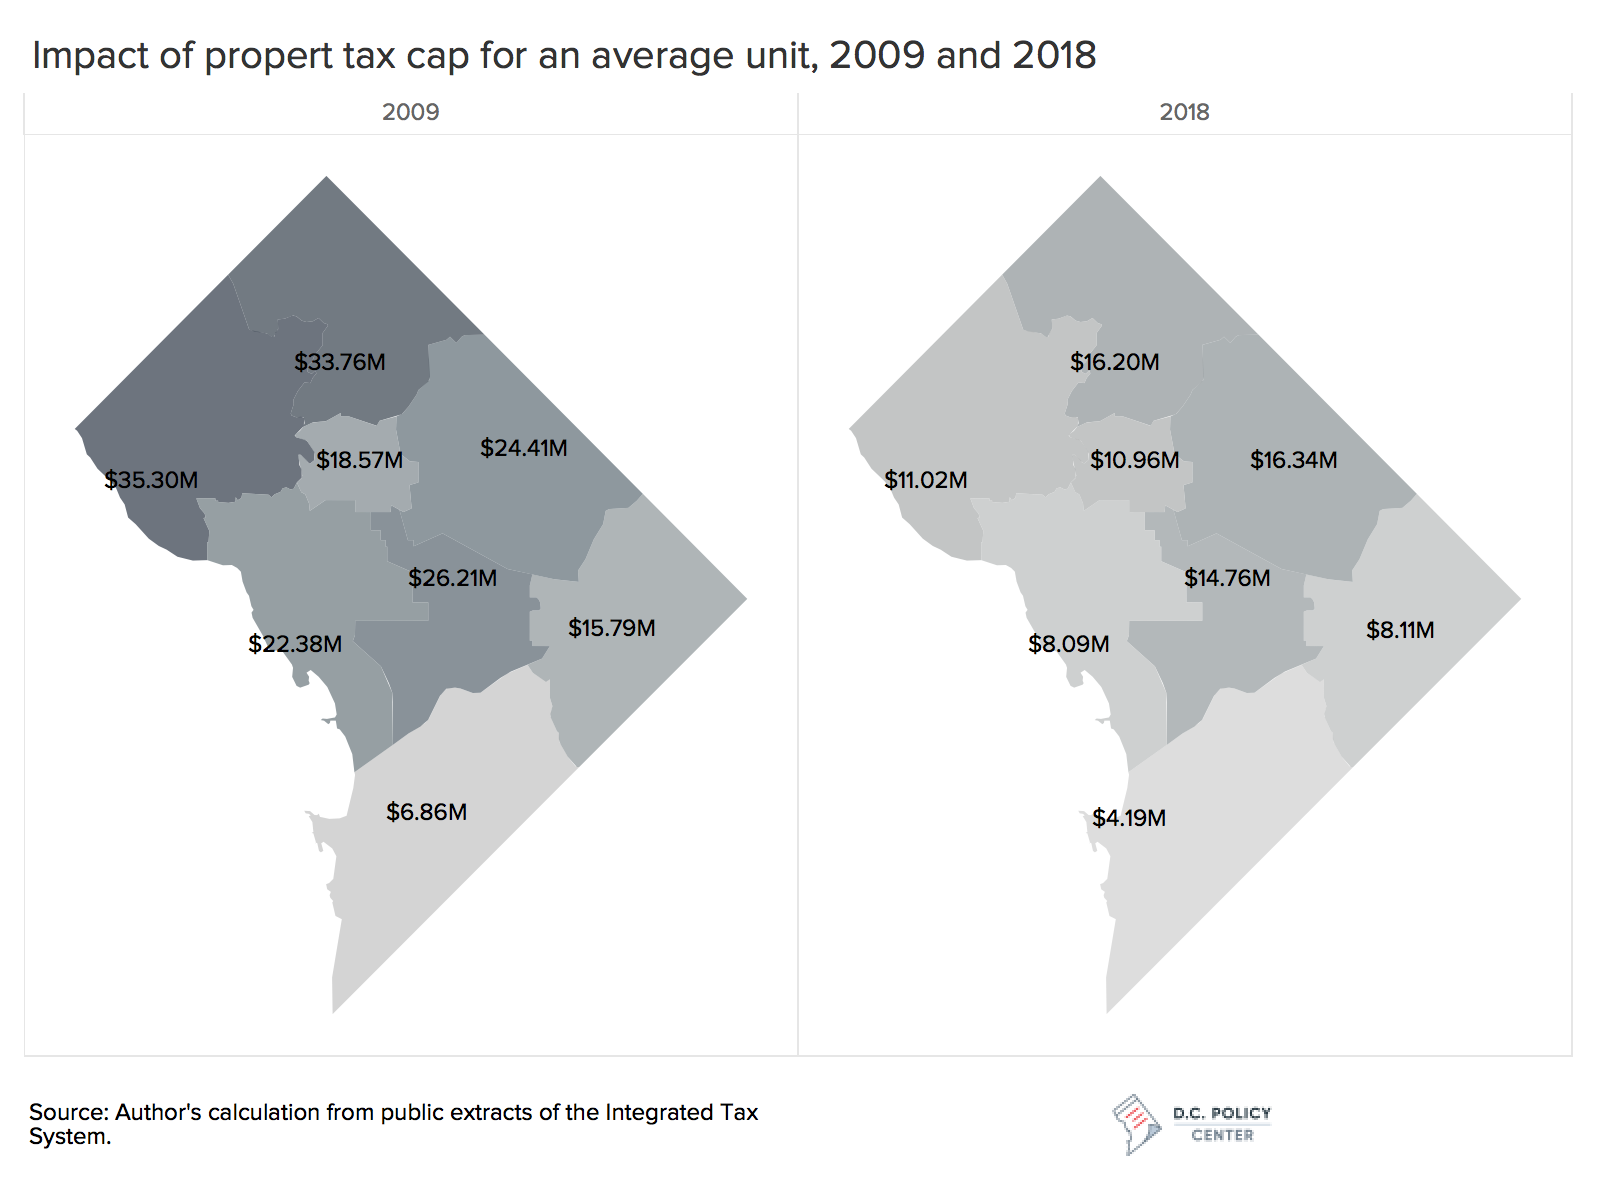
Importantly these benefits are more concentrated in parts of the District where home ownership (and wealth accumulation associated with it) is higher. This is shown in the maps below. In both 2009 (the last year before the Great Recession) and 2018, the benefits of these tax exemptions accumulated in relatively high-income neighborhoods reflecting the higher concentration of home ownership. It is important to note that since 2009, the value of these tax expenditures declined in part because of the Great Recession’s dampening effect on home prices.[10] But more importantly, the value of the homestead/property tax cap expenditures have shifted from Wards 2 and 3 to Wards 4, 5, and 6. In 2018, 53 percent of the value of the tax expenditures associated with the homestead deduction and property tax cap benefited the rapidly gentrifying Wards of 4, 5, and 6.
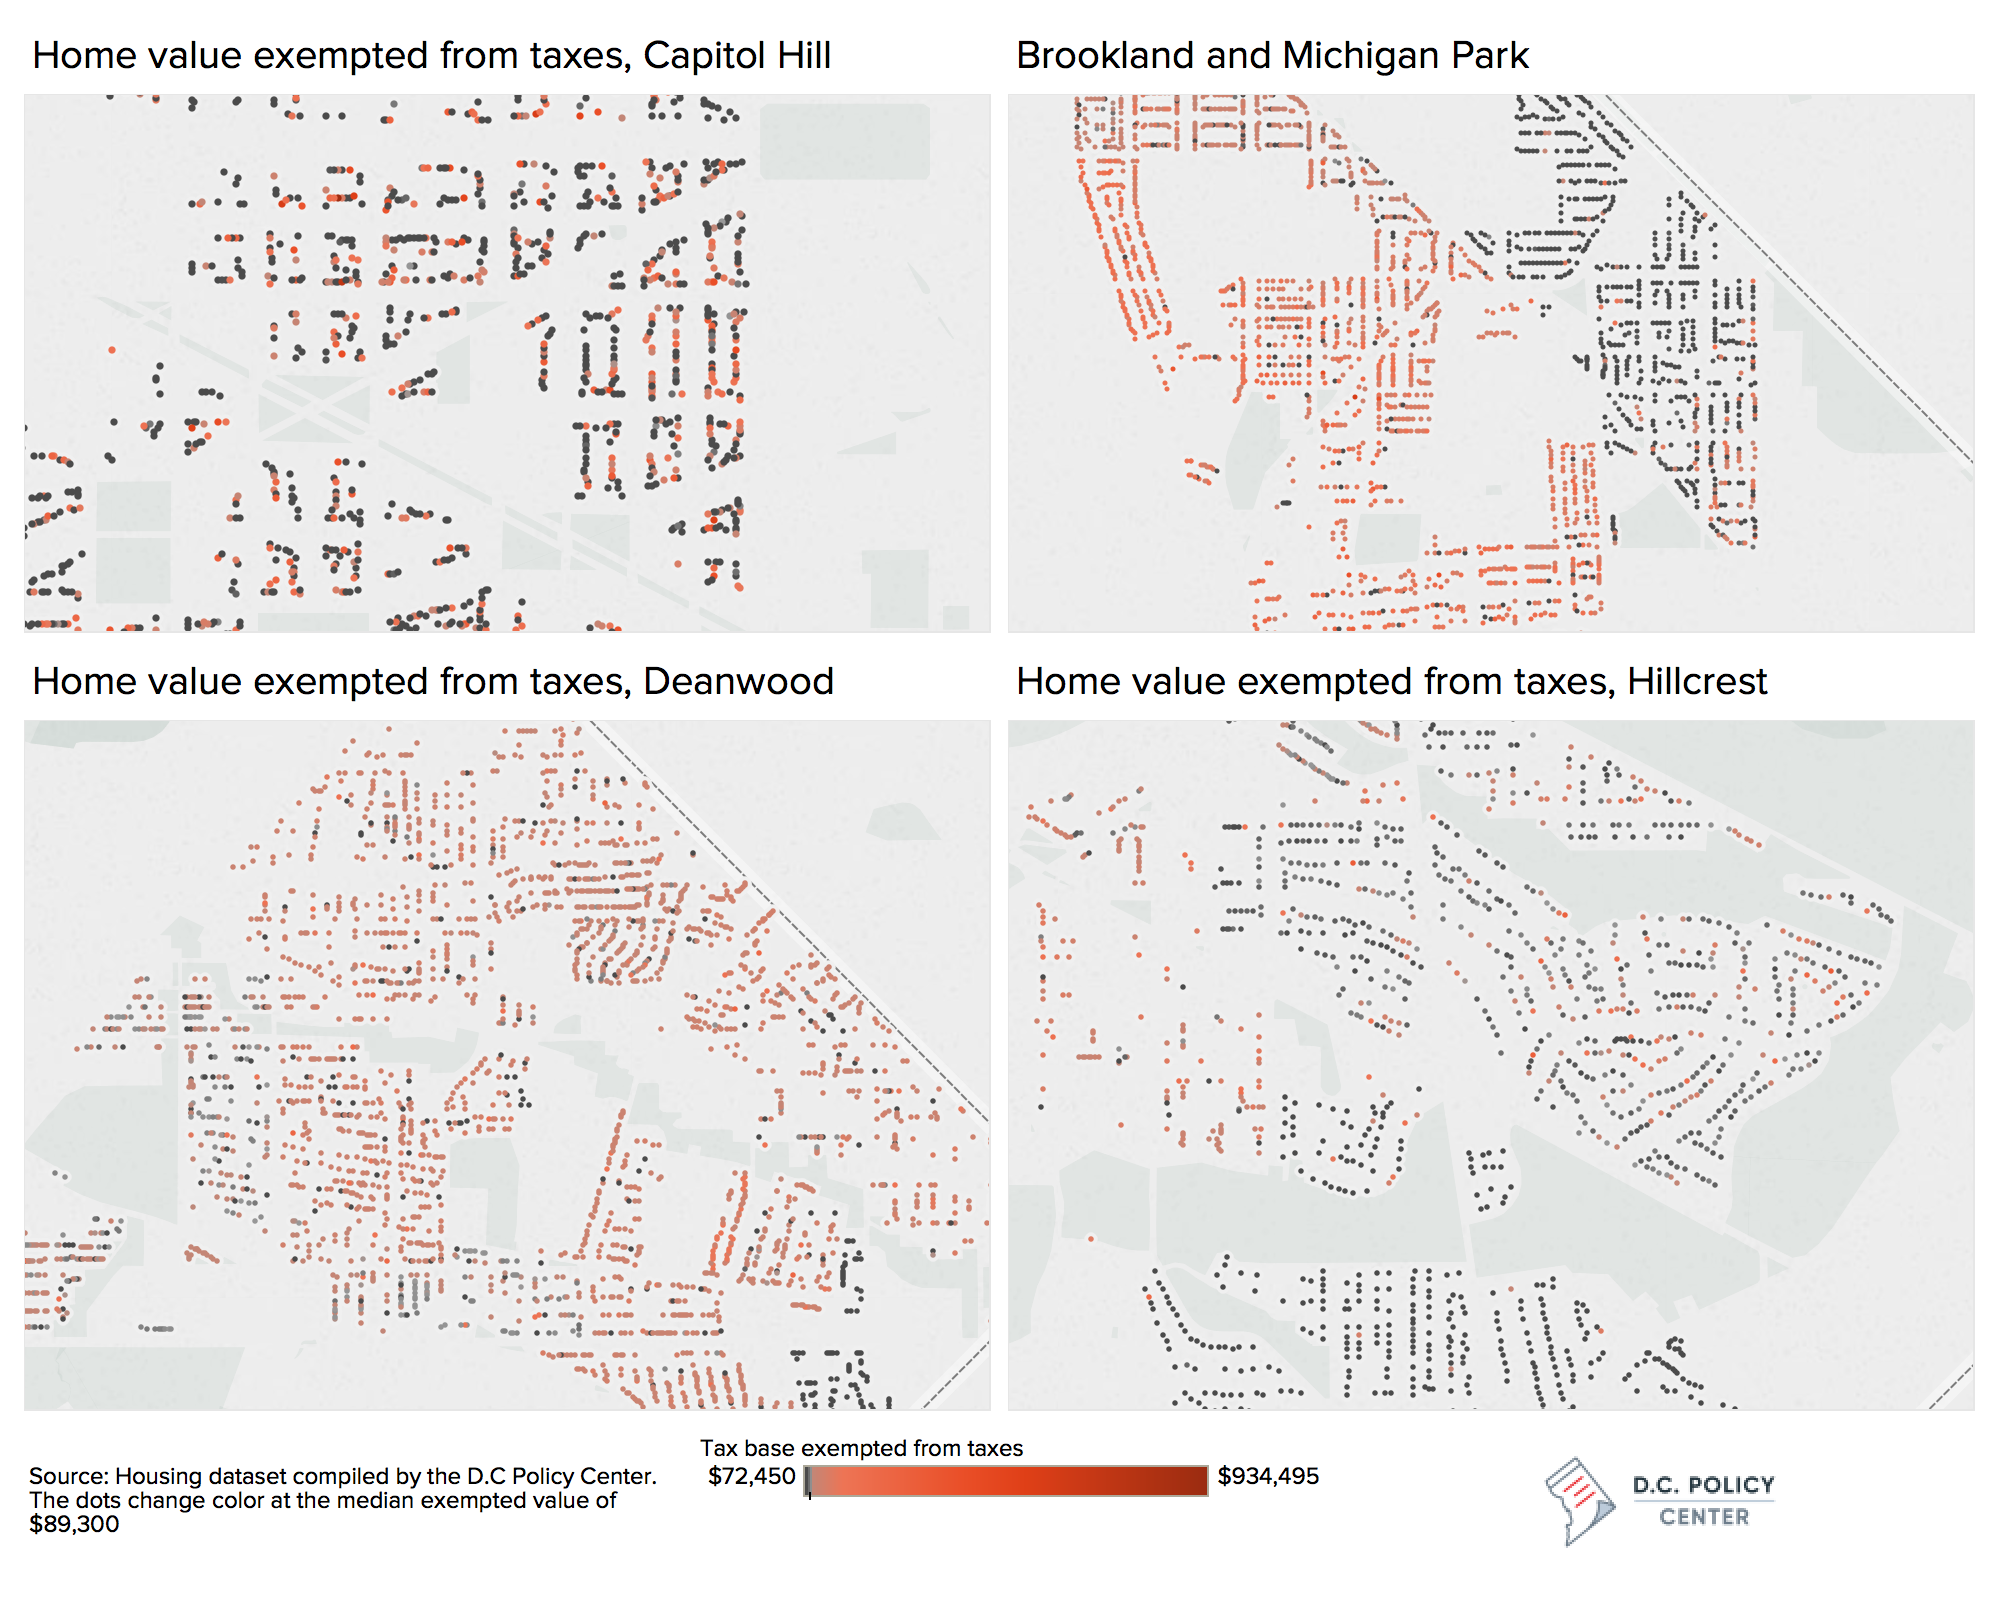
The homestead deduction and property tax cap create inequalities within neighborhoods, too. The maps below show the amount of value exempted from taxes for each owner-occupied unit within the same neighborhood for four neighborhoods for tax year 2017. Each dot represents a house, and the color changes from red to black at the median value of the exempted property value ($83,900 for 2017). In places like Capitol Hill, two homes next to each other could have similar value and very different tax assessments. In contrast, in Michigan Park, very few people benefit from the cap because the value increases that residents of neighboring Brookland experienced has have eluded this part of the city. The same can be said for Hillcrest.
The tax policies that support homeownership could have good intentions, but they result in amplified inequalities which are sharper along racial lines. This is an important example of why we should care about the racial equity implications of our policies, including tax policies. Once these benefits associated with home ownership are created, they are baked into the home price, and the gains are transitionary—accruing to the person who sold the house at the most opportune time. But the wealth implications last generations, further amplifying the divide communities of color face in building wealth and improving their lives.
This publication is made possible with support from the Consumer Health Foundation (consumerhealthfdn.org/about) and the Meyer Foundation (meyerfoundation.org/about-us). It is part of a broader series of essays about racial equity in D.C., available at dcpolicycenter.org/racialequity.
About the Data
This analysis relies on data from snapshots of the District’s Integrated Tax System Public Extract for years 2006 through 2018. We are grateful to the Office of Revenue Analysis for providing this data. The analysis includes taxable properties only (Excludes residential units that are exempted from taxes) classified as residential. Thus it covers the following property types:
| Use Code | Description | We classify as |
| 2 | Residential Multi Family (NC) | Apartments, including mixed use |
| 15 | Residential Mixed Use | Apartments, including mixed use |
| 21 | Residential Apartment Walk | Apartments, including mixed use |
| 22 | Residential Apartment Elevator | Apartments, including mixed use |
| 23 | Residential Flats Less than 5 | Apartments, including mixed use |
| 29 | Residential Multifamily, Misc | Apartments, including mixed use |
| 16 | Residential Condo Horizontal | Condo |
| 17 | Residential Condo Vertical | Condo |
| 117 | Condo Vertical Combined | Condo |
| 216 | Condo Investment Horizontal | Condo |
| 217 | Condo Investment Vertical | Condo |
| 316 | Condo Duplex | Condo |
| 417 | Condo Vertical Parking | Condo |
| 24 | Residential Conversions Less than 5 | Coop or conversions |
| 25 | Residential Conversion 5 units | Coop or conversions |
| 26 | Residential Cooperative Horizontal | Coop or conversions |
| 27 | Residential Cooperative Vertical | Coop or conversions |
| 28 | Residential Cooperative Mrth5 | Coop or conversions |
| 126 | Coop Horizontal Mixed Use | Coop or conversions |
| 127 | Coop Vertical Mixed Use | Coop or conversions |
| 1 | Residential Single Family (NC) | Single Family |
| 11 | Residential Row Single | Single Family |
| 12 | Residential Detached Single | Single Family |
| 13 | Residential Semi Detached | Single Family |
| 19 | Residential Single Family | Single Family |
