
Many sociologists have described the effects of concentrated poverty, but in speaking about concentrated poverty to audiences around the country, I’ve found it most helpful to use an analogy from nuclear physics.
All of us go through life with a certain level of stress that produces a level of background “radiation.” Usually, our stress level – our radiation level – is pretty low and manageable.
But things can happen to any of us – job loss, death of a family member, serious illness, divorce, etc. – that temporarily increase our stress level – our radioactivity.
If we’re surrounded by other people with low radioactivity levels themselves, the radioactivity level of our surroundings is low. That fact helps us get through our own temporary crisis.
But if we’re surrounded by other people with high radioactivity levels, the high level of community radioactivity can compound our own radioactivity and make it more difficult to return to a low radioactivity state.
Reaching Critical Mass – a Social Meltdown
Poverty creates a high level of radioactivity. If, however, you’re a poor family but living within a solid working class, middle class community – a low radioactivity environment – your own poverty may be a temporary condition. There are many opportunities for you or your children to escape poverty – a good local job market and more connections to those job opportunities through neighbors, higher performing schools, access to better health services and nutrition choices, greater safety and security, and so forth.
But if you’re a poor family and living in a higher poverty area with fewer and fewer more stable, low-radioactivity neighbors, many exit doors from poverty are closed. Beyond a certain concentration of poverty, your community reaches critical mass, a chain reaction – a social meltdown – little job access, low performing schools, rising addiction levels to drugs and alcohol, poor access to health care, a food desert, high crime levels (both property and violent), etc.
A neighborhood can reach a critical mass of poverty because greater numbers of poor, high radioactivity families move in. However, the more common phenomenon in American society is that neighborhood poverty rates rise because low radioactivity working class/middle class families move out. (Middle class exodus is akin to removing the control rods from a nuclear pile.) In short, concentrated neighborhood poverty increases not because the neighborhood has more poor people than before but because it has fewer of everybody else.
Concentrated Poverty in Greater Washington
Demographers generally term a neighborhood with a poverty rate of 20 percent or more as a “poverty neighborhood” and classify a neighborhood with a poverty rate of 40 percent or more as a “high poverty neighborhood.” The figure below examines trends in the number of such neighborhoods (approximated by census tracts) in metro Washington, DC over 45 years.
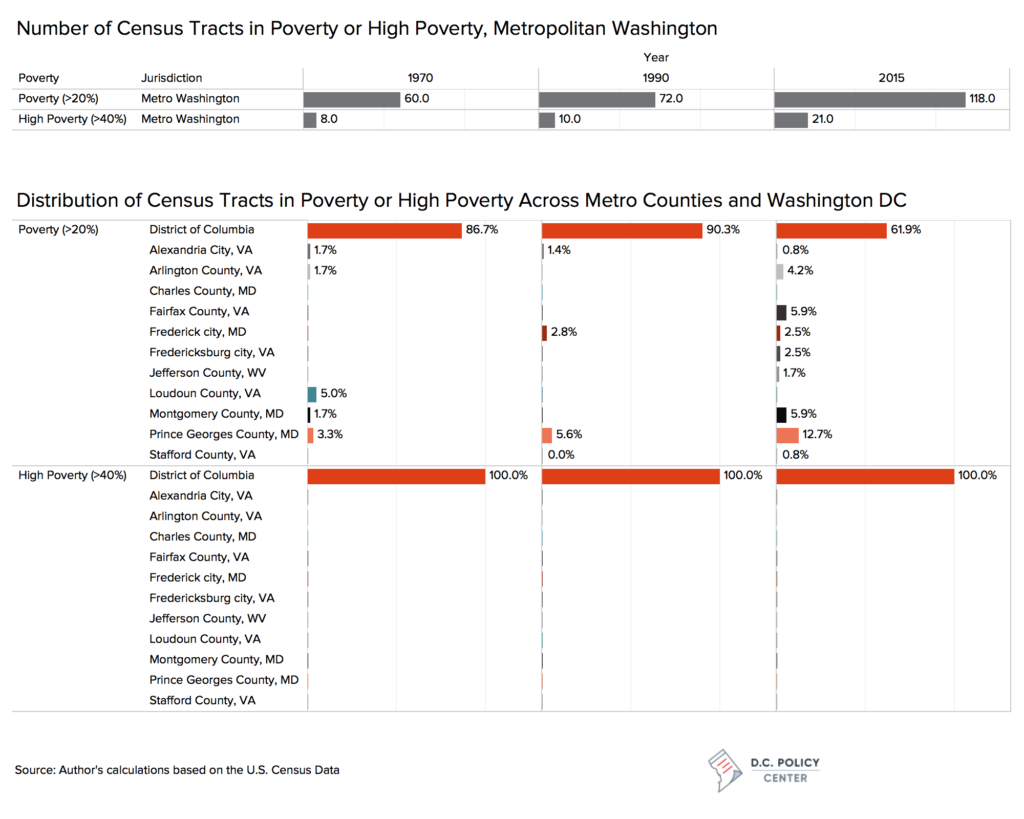
What are the major trends shown by table I?
- Between 1970 and 2015 the number of poverty neighborhoods nearly doubled from 60 to 118 (though 10 such neighborhoods in 2015 were in jurisdictions that were not even part of Metro Washington in 1970).
- In 1970 poverty neighborhoods were overwhelmingly concentrated in the central city, Washington, DC, itself (i.e. 52 of 60, or 87 percent).
- By 2015, from a regional perspective, poverty concentrations had somewhat suburbanized; the central city accounted for only 62 percent of all poverty neighborhoods (73 of 118) while the suburban ring accounted for 38 percent (45 of 118).
- Poverty concentration in the suburbs really reflected three trends.
First, suburbanization of DC’s poor was a significant factor in creating concentrations of poverty in the inner suburbs (Prince Georges County and Montgomery County in Maryland; Alexandria city and Arlington County and Fairfax County in Virginia.
Second, though they officially qualified as parts of the metro area by commuter patterns, vestigial rural poverty was reflected in poverty concentrations in Loudoun County (as late as 1970), Stafford County VA, Charles County MD, and Jefferson County, WV; and,
Third, poor families were left more isolated as middle class families moved out of suburban towns (Frederick MD and Fredericksburg VA) into new subdivisions in their surrounding counties.
- High poverty neighborhoods are strictly a central city phenomenon whether in 1970 (8 of 8 in DC), 1990 (10 of 10 in DC) or 2015 (21 of 21 in DC). As will be shown in a later article, federal housing policy is very responsible for such high concentrations of poverty: almost all high poverty neighborhoods have federal public housing projects located in or adjacent to them and federal Housing Choice Vouchers continue to be concentrated in higher poverty, lower opportunity areas.
Concentrated Poverty Is Racially Coded
In “The Great Sort” series of articles (Part I, II, and III), I showed that over the decades the poorest households and most affluent households increasingly live in different neighborhoods, but that the separating out has occurred to the greatest degree within the Black population. The following figures break down who lives in poverty and high poverty neighborhoods by income status and racial group for Whites (that is, non-Hispanic Whites), Blacks, and Hispanics (of all races).
The next table examines the degree to which Anglo, Black, and Hispanic poor are concentrated in poverty and high poverty neighborhoods.
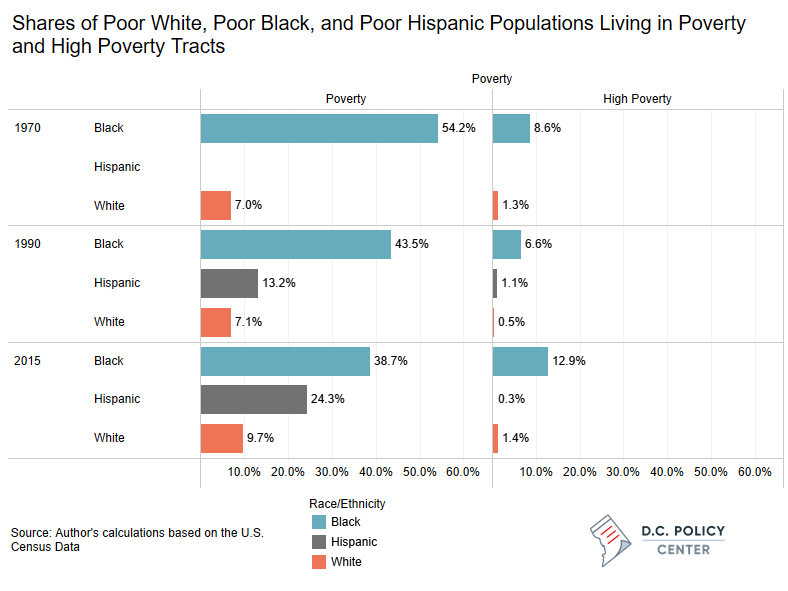
The figure shows:
- Over the 45 years the percentages of poor Whites living in poverty neighborhoods (7.0 percent to 9.7 percent) and high poverty neighborhoods (0.5 percent to 1.5 percent) have been low and relatively stable.
- Among poor Blacks the percentage living in poverty neighborhoods has been high but has decreased steadily (54.2 percent to 38.7 percent) but the percentage of poor blacks living in high poverty neighborhoods has increased somewhat (8.6 percent to 12.9 percent).
- Over 25 years (1990 to 2015) the growing influx of Hispanics in Metro Washington resulted in an increase in the percentage of poor Hispanics living in poverty neighborhoods (13.2 percent to 24.3 percent) but not in high poverty neighborhoods (1.5 percent to 0.4 percent).
Turning to all income levels within the racial groups (which, of course, include each group’s poor) the patterns are the same – just much lower percentages.
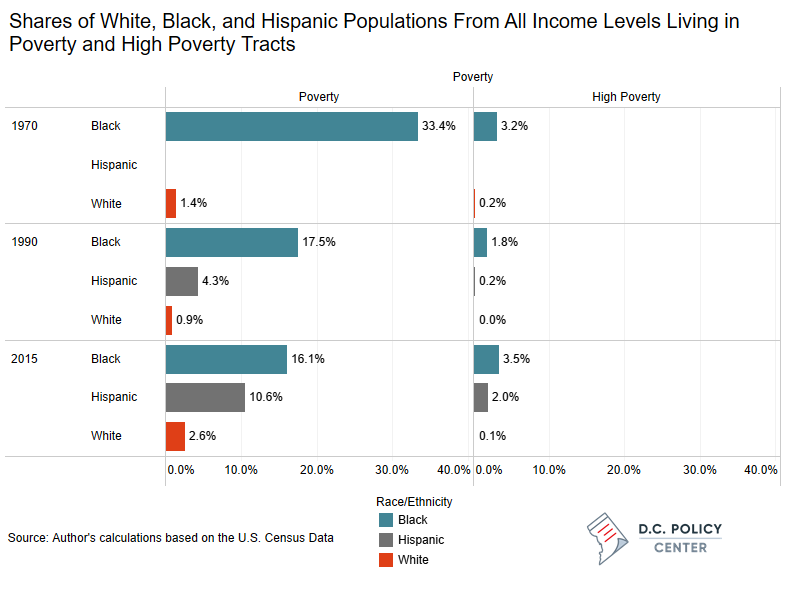
This figure shows:
- Small (0.9 percent to 2.6 percent) to minuscule (0.03 percent to 0.17 percent) of all Whites lived in poverty and high poverty neighborhoods, respectively.
- With the continuing suburbanization of Blacks, the percentage of all Blacks living in poverty neighborhoods was halved from 33.4 percent to 16.1 percent. The even lower percentage of all Blacks living in high poverty neighborhoods was essentially stable (3.2 percent in 1970 and 3.5 percent in 2015).
- Trends for all Hispanics tracked to trends for poor Hispanics.
In summary, by 2015 over 90 percent of poor Whites did not live in poor neighborhoods. By contrast, while over half (54.2 percent) of poor Blacks lived in poor neighborhoods in 1970 and four in ten still did by 2015. The uptick in poverty concentration among Hispanics may be a function of recent immigration into initial ports of call neighborhoods.
The bottom line: concentrated poverty in Metro Washington is not a problem experienced by the White population in general but is still a significant problem for Blacks. Hispanics must guard against continued barrio-ization.
The next article will assess Metro Washington’s trends in concentrated poverty against its peer metro areas nationwide.
Feature photo by Ted Eytan (Source).
David Rusk is a Senior Fellow at the D.C. Policy Center. Rusk is a former federal Labor Department official, New Mexico legislator, and mayor of Albuquerque, the USA’s 32nd largest city. He is also the author of Cities without Suburbs. Now a consultant on urban policy, Rusk has worked in over 130 US communities in 35 states. Abroad, Rusk has lectured on urban problems in Canada, England, Germany, South Africa, and The Netherlands.