
How do enrollment trends differ across different areas of D.C.? We find that while the number of births decreased across all wards, some wards saw larger declines than others. These declines have varying levels of significance for enrollment trends as the relationship between the number of births and where students live and where they enroll in school varies across the city. While we can look to births and cohort retention ratios to project future public school enrollment by grade, it is very challenging to do so by ward.
One complication is that 43 percent of students attend school outside their ward of residence. In addition, families may move to a different ward within D.C. However, if previous trends continue, it seems that most wards will experience a decline in enrollment at their schools, with Ward 8 potentially having the largest decrease.
Other publications in this series:
In our recently released report, Declining births and lower demand: Charting the future of public school enrollment in D.C., we examined the changes to the two main drivers of enrollment – (1) births in D.C. and (2) the preference for families to live in D.C. and choose its public schools. Because of declines seen in both drivers, that report analyzes several enrollment scenarios that public schools in D.C. may experience in future years. In it, we project that despite a previous decade of steady growth, enrollment in D.C.’s public schools may remain stagnant at pre-pandemic levels or may continue to decline.
In last week’s follow-up article, we investigated trends by race to see how demographic trends informed what we were seeing. We found that in recent years the share of students who are Black enrolled in D.C.’s public schools has declined across all grade bands – due in part to fewer births to mothers who are Black and weaker preferences for pre-kindergarten during the pandemic.
This week, we’re examining how birth and enrollment trends differ across different areas of D.C. We find that while the number of births decreased across all wards, some wards saw larger declines than others. These declines have varying levels of significance for enrollment trends as the relationship between the number of births and where students live and where they enroll in school varies across the city. While we can look to births and cohort retention ratios to project future public school enrollment by grade, it is very challenging to do so by ward. One complicating factor is that 43 percent of students attend school outside their ward of residence. In addition, families may move to a different ward within D.C. while their children are in school. However, if previous trends continue, it seems that most wards will experience a decline in enrollment at their schools, with Ward 8 potentially having the largest decrease. [i]
Enrollment trends by ward
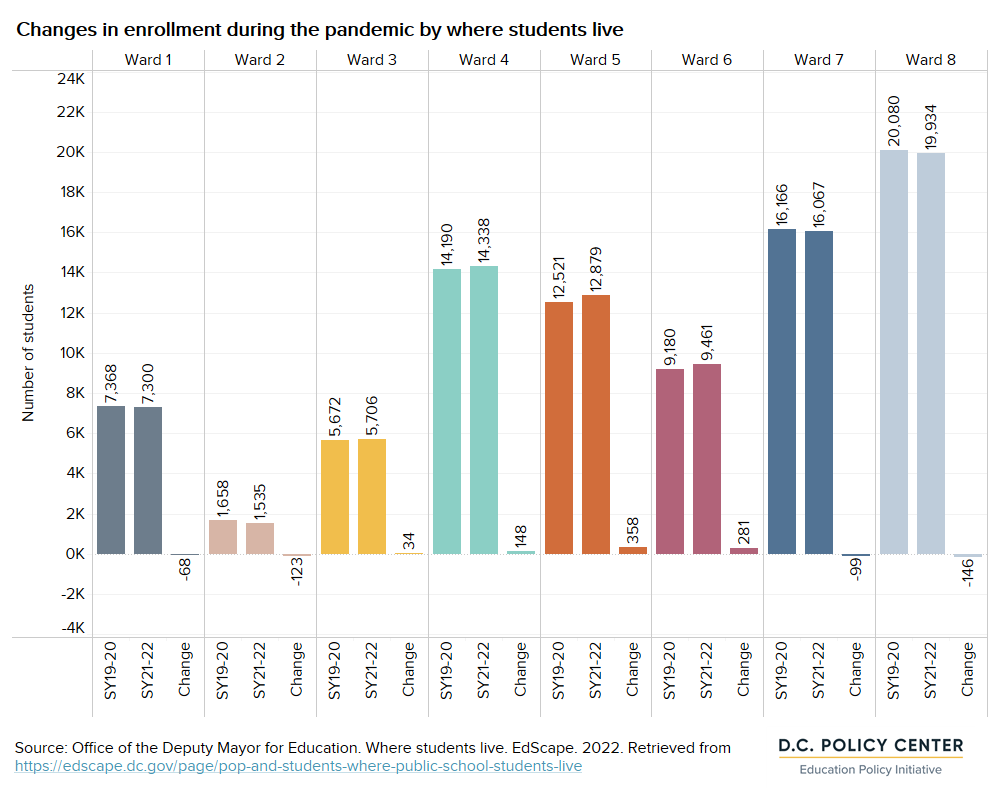
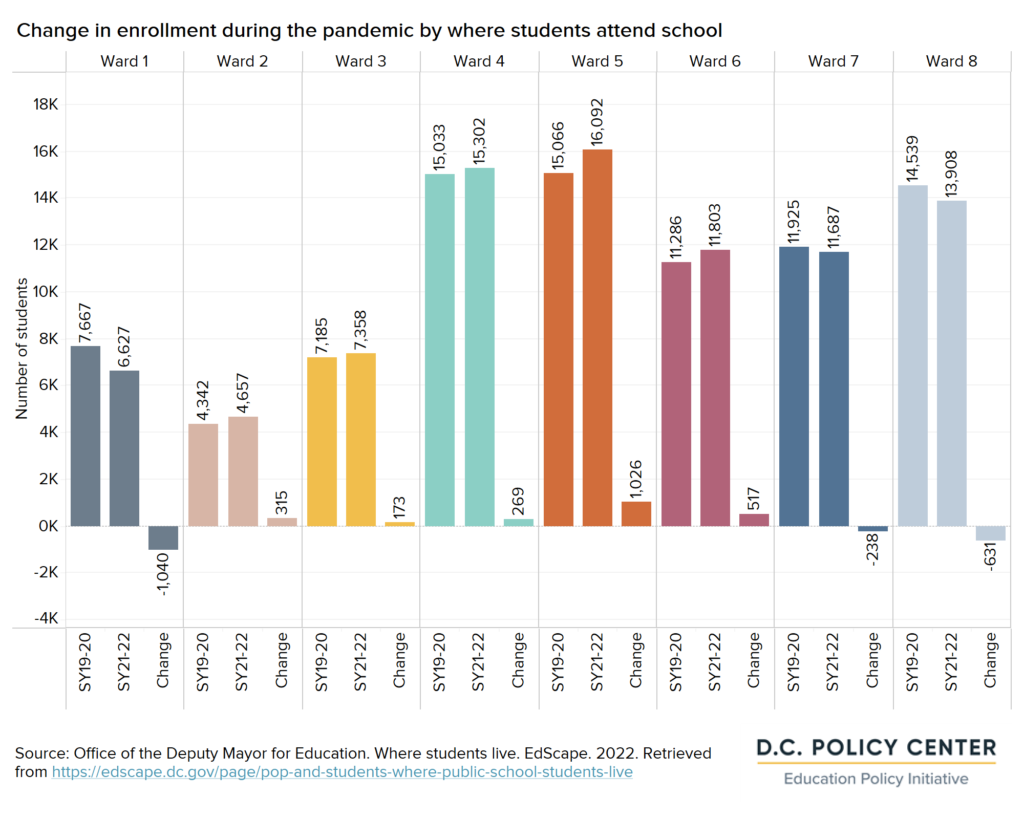
After decades of growth, enrollment in D.C.’s public schools has stagnated, and in earlier grades, even declined. Between school years 2019-20 and 2021-22, total enrollment grew by just 29 students on average. Although the total number of students did not change during the pandemic, by ward, there were small residential shifts of up to 400 students, and more noticeable changes in enrollment by school location of up to 1,000 students.
Enrollment trends by ward of residence
The distribution of school enrollment based on where students live shifted by a very small amount during the pandemic. Between school years 2019-20 and 2021-22, Wards 5 and 6 saw a slight increase of three percent in student residents, which could indicate more residential moves for families on net to these areas during the pandemic (likely not a lot of new families opting into D.C. and its public schools as enrollment across the city did not increase). Ward 2 (with the smallest enrollment) experienced a decrease of seven percent, or 200 students, which could mean more families leaving the area on net or opting for other school choices.
Enrollment trends by school location
By school location, there were some larger shifts in enrollment. Wards 2, 5, and 6 experienced gains of at least five percent. The enrollment increase at schools located in Wards 5 and 6 was in parallel to a small gain of student residents, and Ward 2 opened a new school during this time. Wards 1 and 8 had decreases of at least four percent in student enrollment at their schools without a corresponding decrease in student population, which could indicate a shift in school preferences for students who usually attend schools in these wards (either from within or outside of the ward). In Ward 1, at least one school closed during this time as well.[ii]
During the pandemic, there have been some small shifts within the city for student enrollment, more so for school location than student residence. Enrollment by ward of residence and school location is helpful for planning, but can be difficult to predict. Births and cohort retention ratios can provide some information on how enrollment by ward of residence and school might change in the coming years.
Birth trends by ward
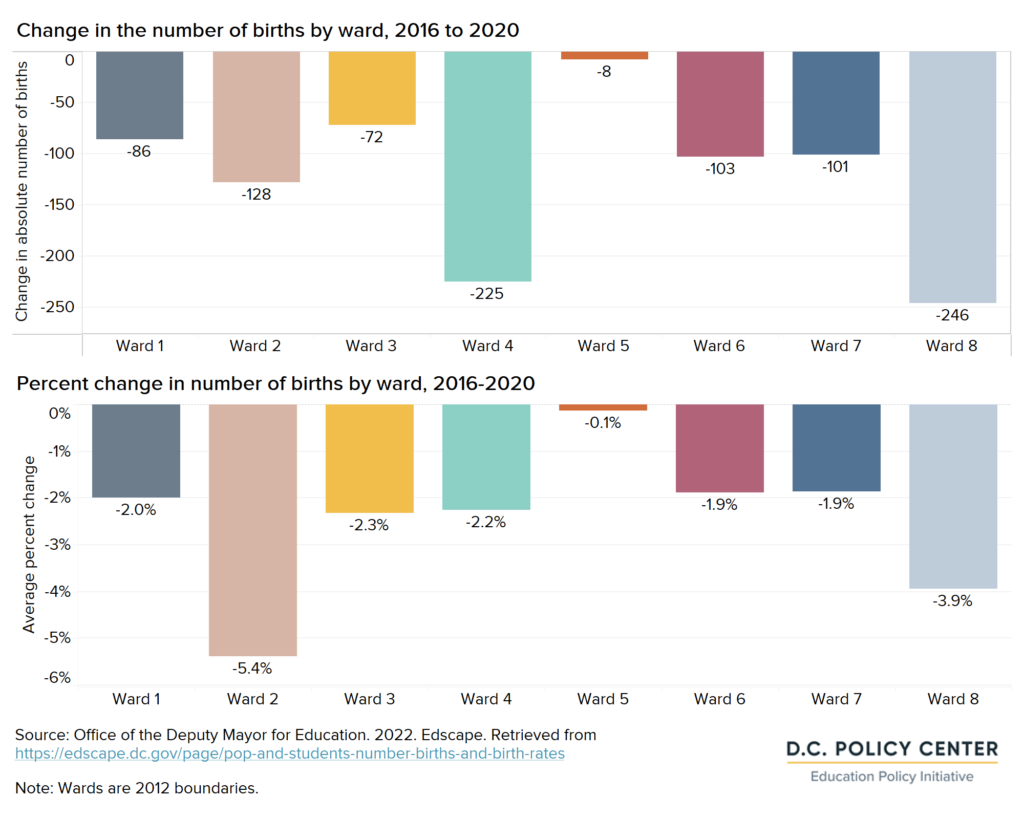
The total number of births in D.C. peaked in 2016 at 9,858 births and has declined by 2.3 percent every year since. Mirroring these District-wide trends, most wards experienced a peak in the number of births in either 2016 or in the following year of 2017. While all wards have experienced fewer births per year since this time, the rates of this change differ across the District. Wards 2, 4, and 8 experienced the largest declines of at least 120 births, while Ward 5 births remained almost the same with just eight fewer births. Families may move after babies are born, but if past migration trends continue, this could mean fewer young children living in Wards 2, 4, and 8 especially in the coming years.
Cohort retention trends by ward
Cohort retention ratios, or the percentage of the number of babies born in D.C. and attend public schools in a future year on net, is one way to measure the preference for families to live in D.C. and choose its public schools. This analysis focuses on cohort retention ratio by ward of residence and ward of school location. While this figure does not show whether specific babies ended up attending pre-kindergarten or kindergarten in their home ward, it does give a sense of enrollment trends across the city.
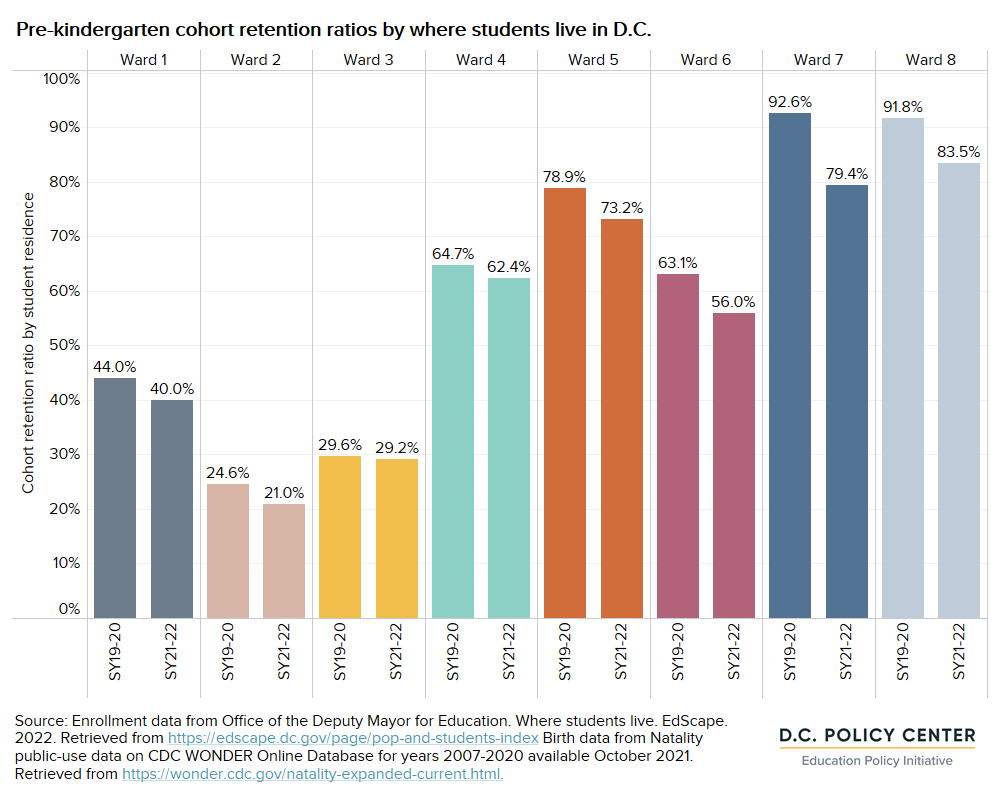
Cohort retention by ward of residence
Cohort retention ratios measure the extent to which babies born in a certain ward continue to live in their ward and enroll in public schools regardless of school location. This metric could be useful for planning new school locations or providing new transit options. For this part of the analysis, we focus on pre-kindergarten as the grade band that saw the biggest decrease in enrollment during the pandemic and the grade band with data availability. Comparing births to pre-kindergarten enrollment suggests that children born in Wards 7 and 8 tend to live in their ward of birth and go to public school, while Wards 2 and 3 experience a lot of exit either through residential moves or opting for non-public school options for early grades. During the pandemic, the cohort retention ratio has decreased or stayed constant for most wards. Notably, Wards 2 and 3 kept their pre-kindergarten cohort retention stable while Ward 7’s ratio decreased by 13.2 percentage points and Ward 8’s declined by 8.3 percentage points.
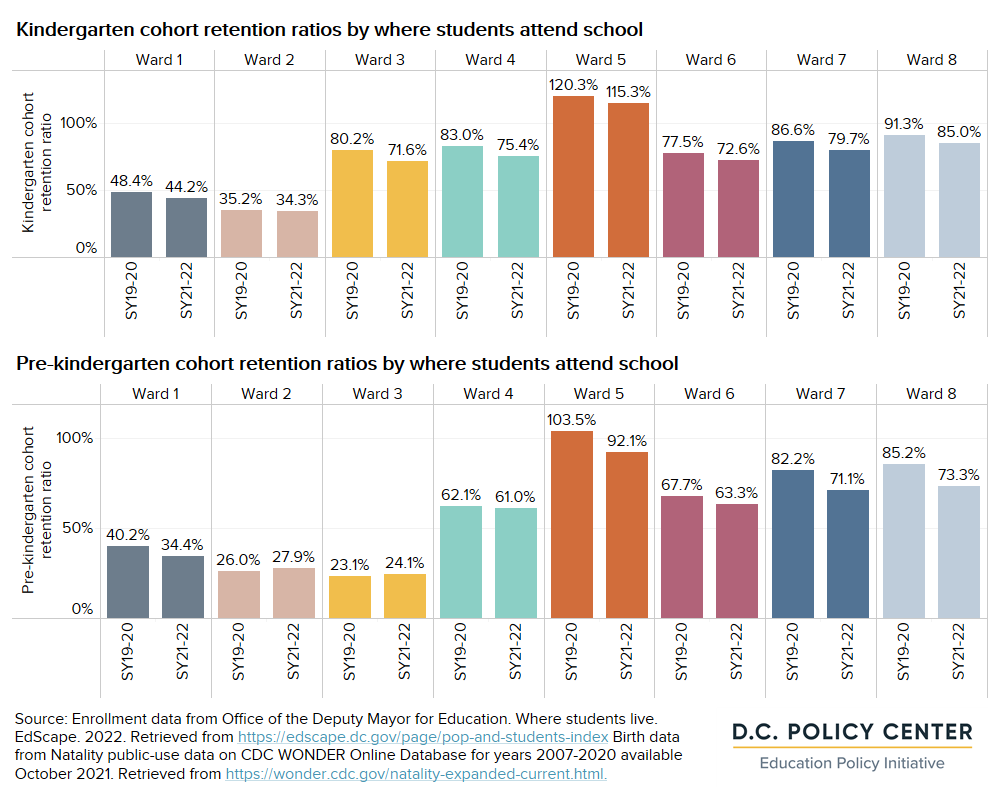
Cohort retention ratios by school location
The cohort retention ratio by school location measures the net inflows to schools in a particular ward compared to the number of births to residents in that ward in a previous year. This measure could be helpful for future school planning to know how to consider the impact of a decrease in births for a ward. This ratio can be influenced by the geographic distribution of schools: Ward 5, for example, has more schools than any other ward and the highest retention ratio by school location, drawing in students from across the city and pushing its cohort retention ratio over 100 percent for kindergarten. In Wards 2 and 3, where several elementary schools do not offer pre-kindergarten for three-year-old students (generally offered in other wards), cohort retention ratios for pre-kindergarten are below 30 percent. Overall, the cohort retention ratio increases as students move from non-compulsory pre-kindergarten grades to kindergarten, with the largest increase seen in Ward 3.
During the pandemic, trends largely mirror cohort retention ratios for where students live. All wards experienced a decrease in students attending schools within the ward, with the largest declines in Wards 5, 7, and 8 and more stability in Wards 2 and 3 for pre-kindergarten. Interestingly, Ward 3 saw a larger decrease than Wards 7 and 8 for kindergarten, which may indicate less enrollment, either fewer students coming from outside the ward, or more students moving out of Ward 3 or choosing private elementary school.
Implications
In Declining births and lower demand: Charting the future of public school enrollment in D.C., we project how enrollment will likely shift in D.C. While enrollment District-wide continues to change, it is difficult to project how these changes will manifest across different wards. As of yet, the distribution of students living and attending school across D.C. has not changed greatly during the pandemic.
Birth trends may have an impact on future enrollment, as many students commute across the city for school. Births are starting to decline in Ward 8, which may have a citywide impact as only 58 percent of students living in Ward 8 attend school in the same ward. By the same measure, the decline in births in Ward 2 may have larger implications for enrollment in that ward.
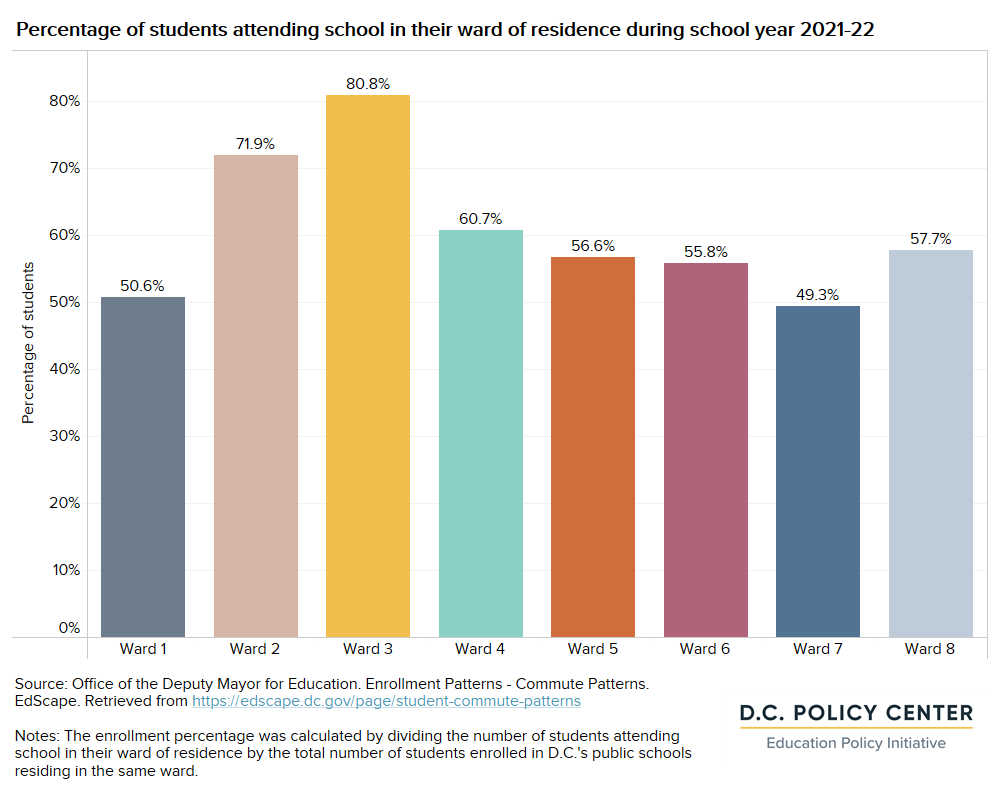
Making it challenging to interpret what changes in these drivers may mean for enrollment by location, many students in D.C. travel outside of their home ward to attend school. In school year 2021-22, 57 percent of D.C. public school students traveled outside of their ward of residence to attend schools. Where a student lives carries more weight in relation to enrollment patterns depending on the ward. For example, 81 percent of the students who live in Ward 3 also attend school there, while only 49 percent of students who live in Ward 7 attend school in their home ward. While these trends should be incorporated into future enrollment planning, it will be difficult to predict how demographic shifts will impact individual ward enrollment with D.C.’s flexible public school choice policies.