This article is adapted from “The 2017 State of Business in the District of Columbia: Twenty Years of Change Since the Revitalization Act,” a report D.C. Policy Center prepared for the DC Chamber of Commerce.
The 1990s were not a good decade for the District of Columbia.
The nation was rocked by a recession in the early 1990s, and D.C. lost 21,000 jobs by 1992. Elsewhere in the country, jobs rebounded beginning 1991, but a federally engineered local recession, in the form of federal job cuts, kept the District struggling. What followed was a period of fiscal indiscipline that devastated the city’s finances and pushed more residents and businesses out of the District. Between 1990 and 1997 the District lost 63,000 jobs (9.1 percent of total employment) and 75,000 residents (12 percent of its population). The 1990s produced a lost economic decade, with repercussions still seen in comparisons between the District and the Metro area.
The National Capital Revitalization and Self-Government Improvement Act of 1997, known as the Revitalization Act, was enacted in August 1997, and it proved a turning point for the District. Two years earlier, the District had lost control over its finances to the Control Board when the city’s budget deficit reached $722 million. With the Revitalization Act, the city gave up the yearly federal payment it received from the federal government, but in return, the feds assumed the responsibility for the city’s debts and its underfunded employee pensions (the city is responsible for pension obligations since 1997), took over the management of the courts and prisons, and increased the Medicaid reimbursement rate. (This last bit is not in the Revitalization Act, but is generally seen as a part of the deal.) Much of today’s economic dynamism in the District of Columbia is the result of that difficult and politically fraught decision to transfer financial control of certain District responsibilities to the federal government.
August 5, 2017 marked the twentieth anniversary of the Revitalization Act, and these twenty years have been transformative. Job recovery began in 1998, and today’s total employment exceeds 791,000 workers, an increase of 25 percent since 1997. The District’s population boomed in the last 11 years and added more than 114,000 net new residents. The population now stands at 681,000. The District’s economy stayed resilient during the Great Recession with only minimal job losses as housing prices soared, incomes increased, and, with a strong tax base, the District’s finances showed tremendous improvements. Today the District has higher income and population growth then the rest of the region, and continues to attract educated, high-skilled residents from the rest of the country. Since the Great Recession, the city has surpassed the nation and the metro area in economic growth.
Economic growth has been strong, especially since 1999
Economic growth in the District has been strong since the Revitalization Act, and particularly strong in the private sector. The city has benefited from robust growth in jobs, population, and incomes. Gross District Product—the value of goods and services produced in the District—stood at $127 billion in 2016. This value grew by 46 percent, or at an average annual growth rate of 2.4 percent since 1997 after adjusting for inflation, outpacing the growth in the nation and the metropolitan area.
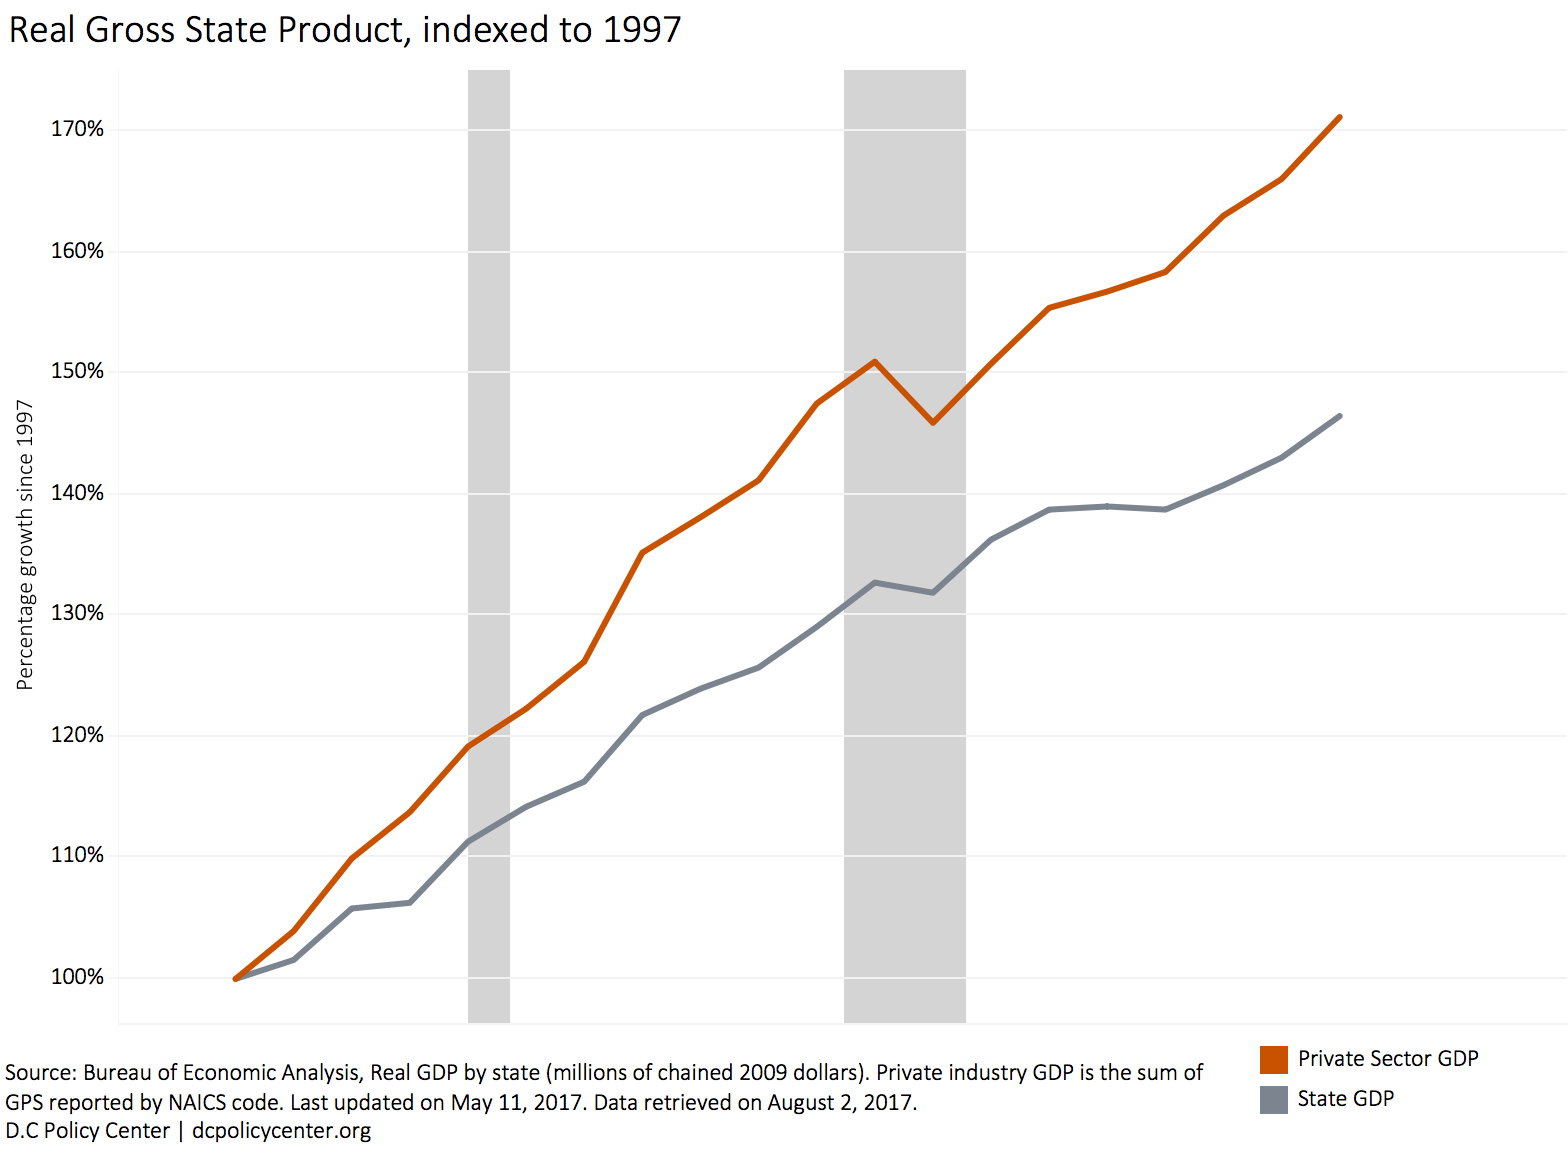
It is customary to use the metric of Gross State Product (GSP), the total value of goods and services produced in a state, as a measure of economic activity, but in the case of the District, GSP could be a misleading measure. The GSP would include the value created by the federal government agencies, including procurement made in the District, even when these dollars could be spent elsewhere in the country.
Thus, GSP overstates the total economic activity in the District. It also understates the economic growth. To wit, in 2016, GSP attributable to the private sector was valued at nearly $84 billion, representing a real growth of 71 percent (average annual rate of 3.6 percent) since 1997. Private sector growth was strongest between two recessions, at an annualized rate of about 4 percent. Since the Great Recession, the city’s private sector grew at 2 percent, outpacing the metro area, which grew at 1.9 percent.
Another metric of economic activity, earnings in the District, grew by more than 73 percent in real terms since 1997. In 2016, total earnings in the District, including earnings by non-D.C. residents, stood at $96 billion, and net earnings (earnings after contributions to pension and insurance plans) was $86 billion. Resident earnings—earning by all D.C. residents regardless of where they work—grew even faster, by 87 percent during the same period, reducing the impact of the “commuter bite,” (the share of income earned by non-residents.)
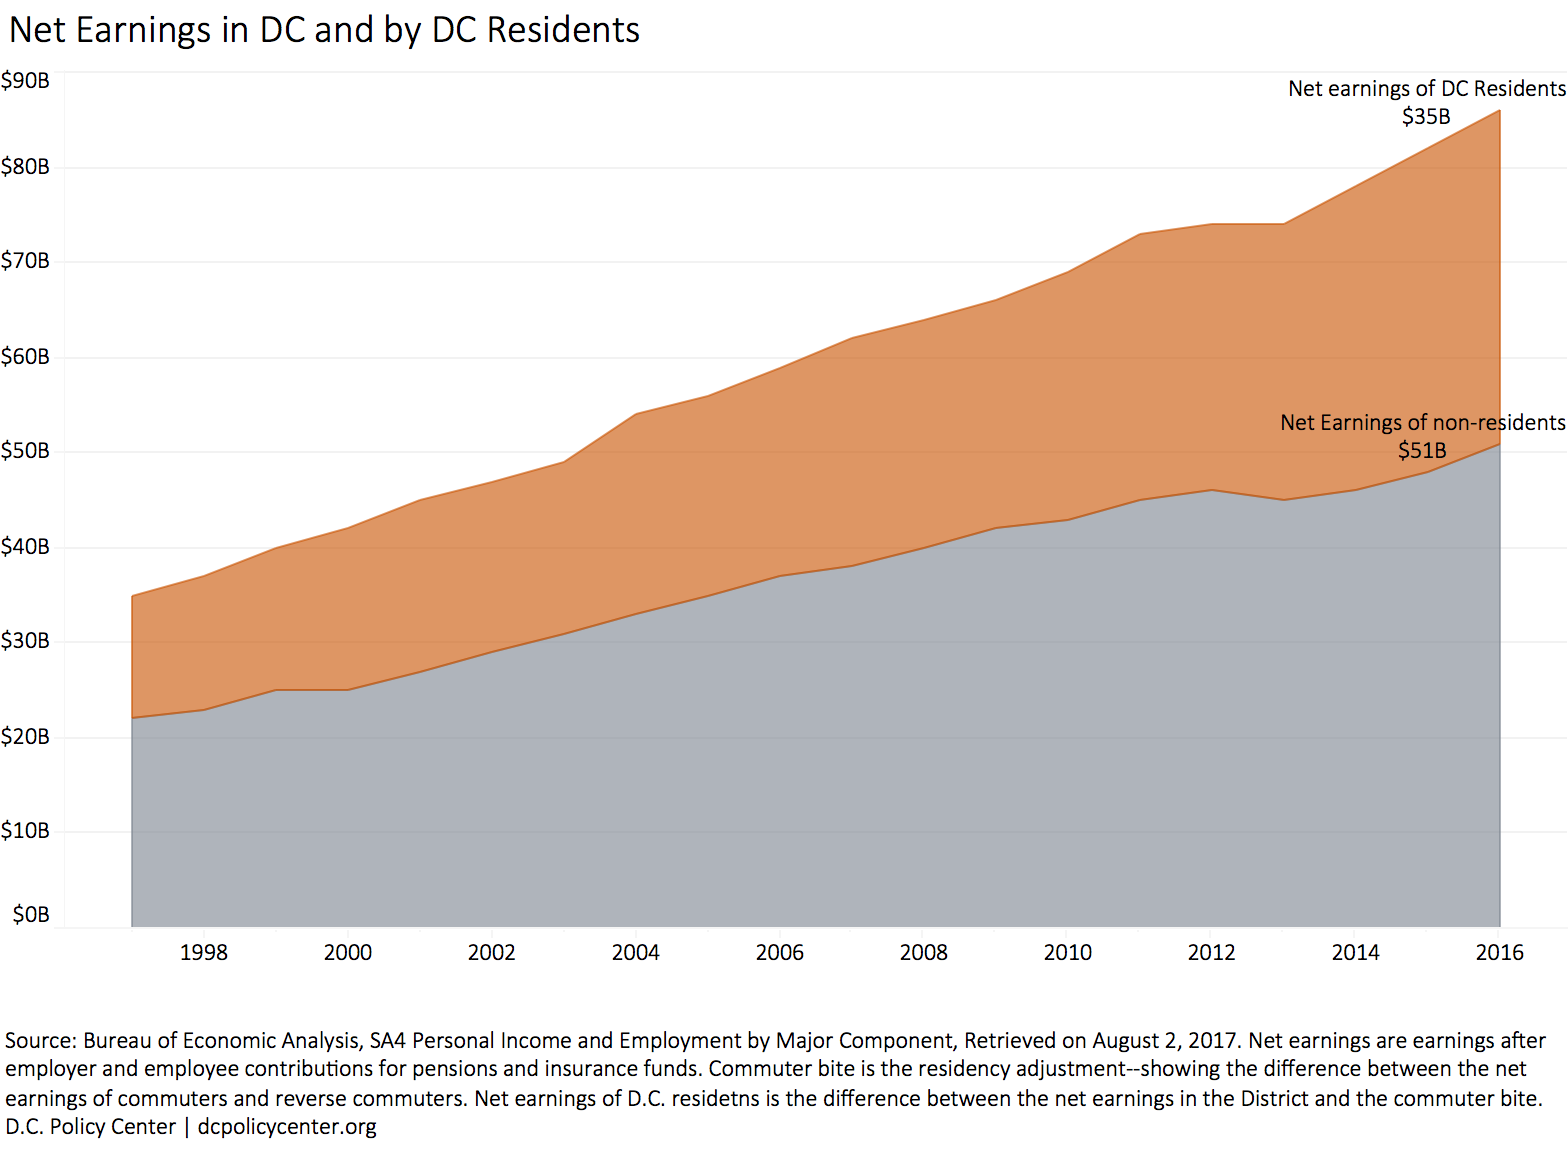
The commuter bite is important because the District cannot tax this income, although it is earned within city boundaries. In 2016 District residents claimed $35 billion of D.C.’s net earnings, and commuters claimed $51 billion. That is, the commuter bite consumed 59 percent of all earnings in D.C. in 2016. At the time of the Revitalization Act, the commuter bite was much higher, at 64 percent. The commuter bite is declining because the District’s population is increasing, and more people who work in the city are also now choosing to live in the city. Additionally, reverse commuters—those who live in the city but work in the suburbs—are changing in nature. They now hold higher-paying jobs than the reverse commuters of the late 1990s and early 2000s.
There are more jobs in the private sector.
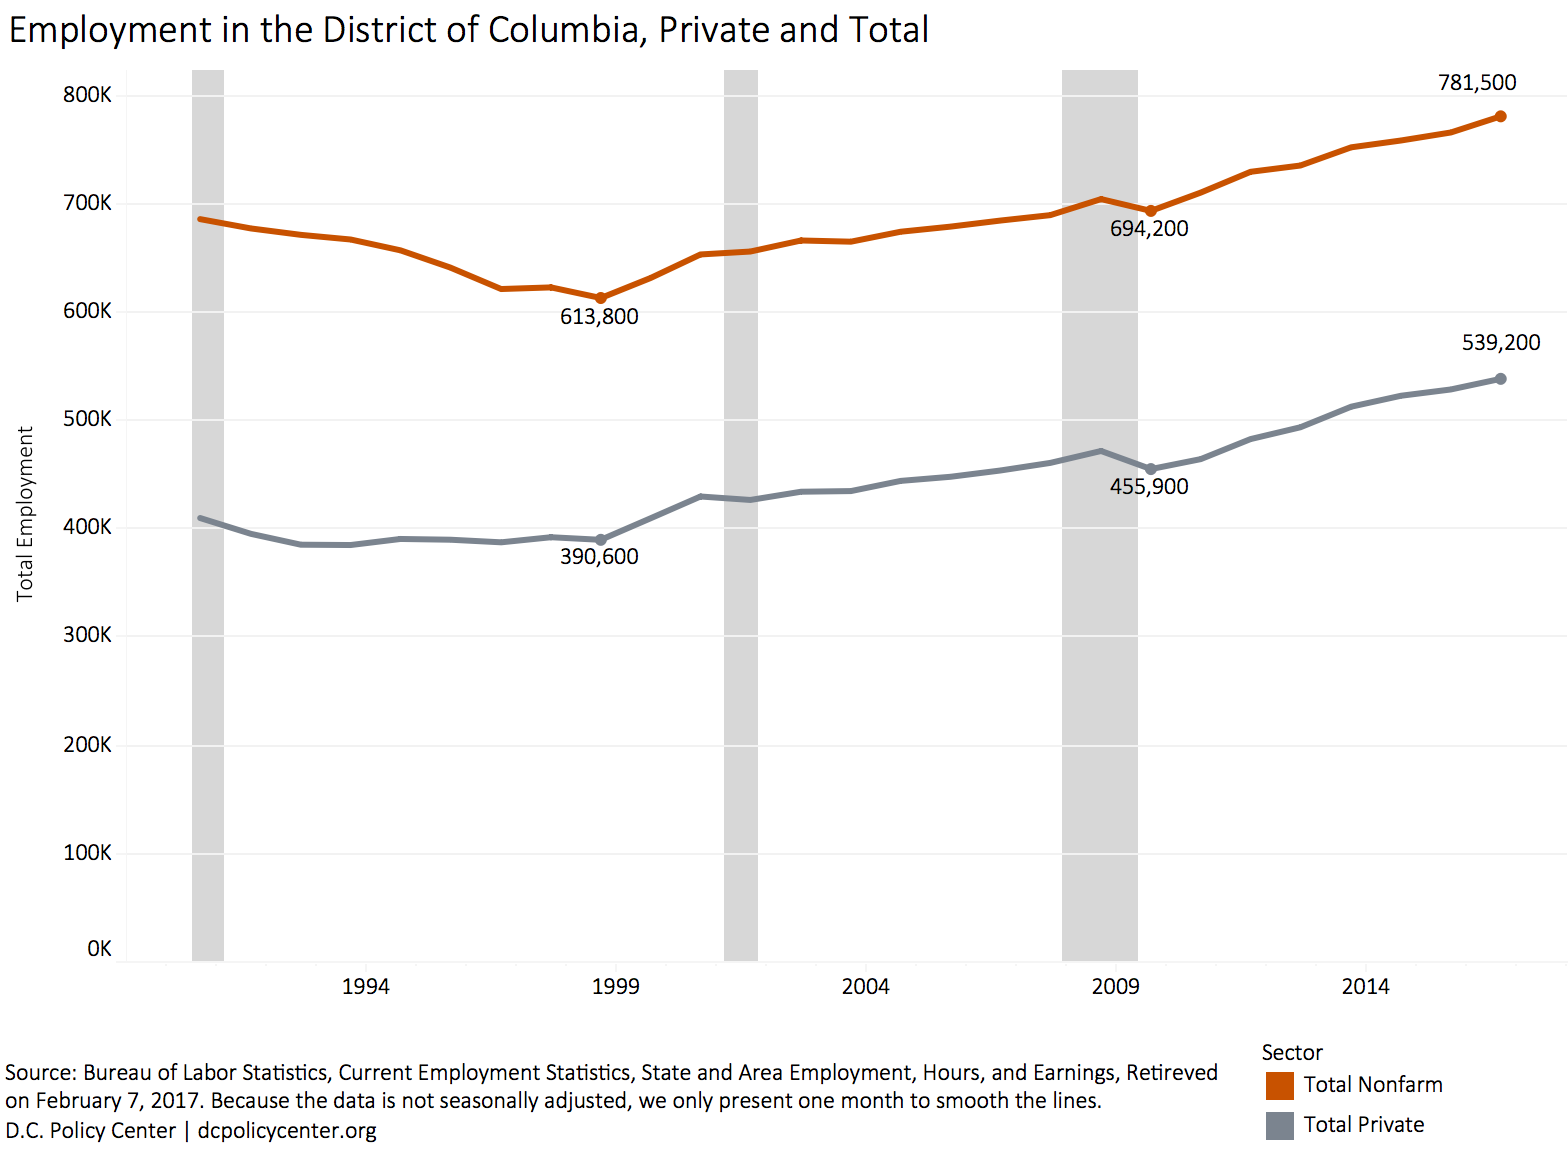
For the District, the 1990s proved to be a lost decade for employment, one from which the city is still trying to recover. The decade began with a national recession, continued with a federally-engineered recession as the federal government reduced its spending in the city, and, finally, a self-inflicted budgetary wound that led to the Revitalization Act. By the end of 1997, jobs in the District had shrunk by 5 percent, whereas jobs in the metro area had grown by 10 percent. Only in 2000 did the District bounce back to the same level of employment it had in 1990. The big gap in job increases since 1990 is entirely due to the District’s underperformance in this lost decade.
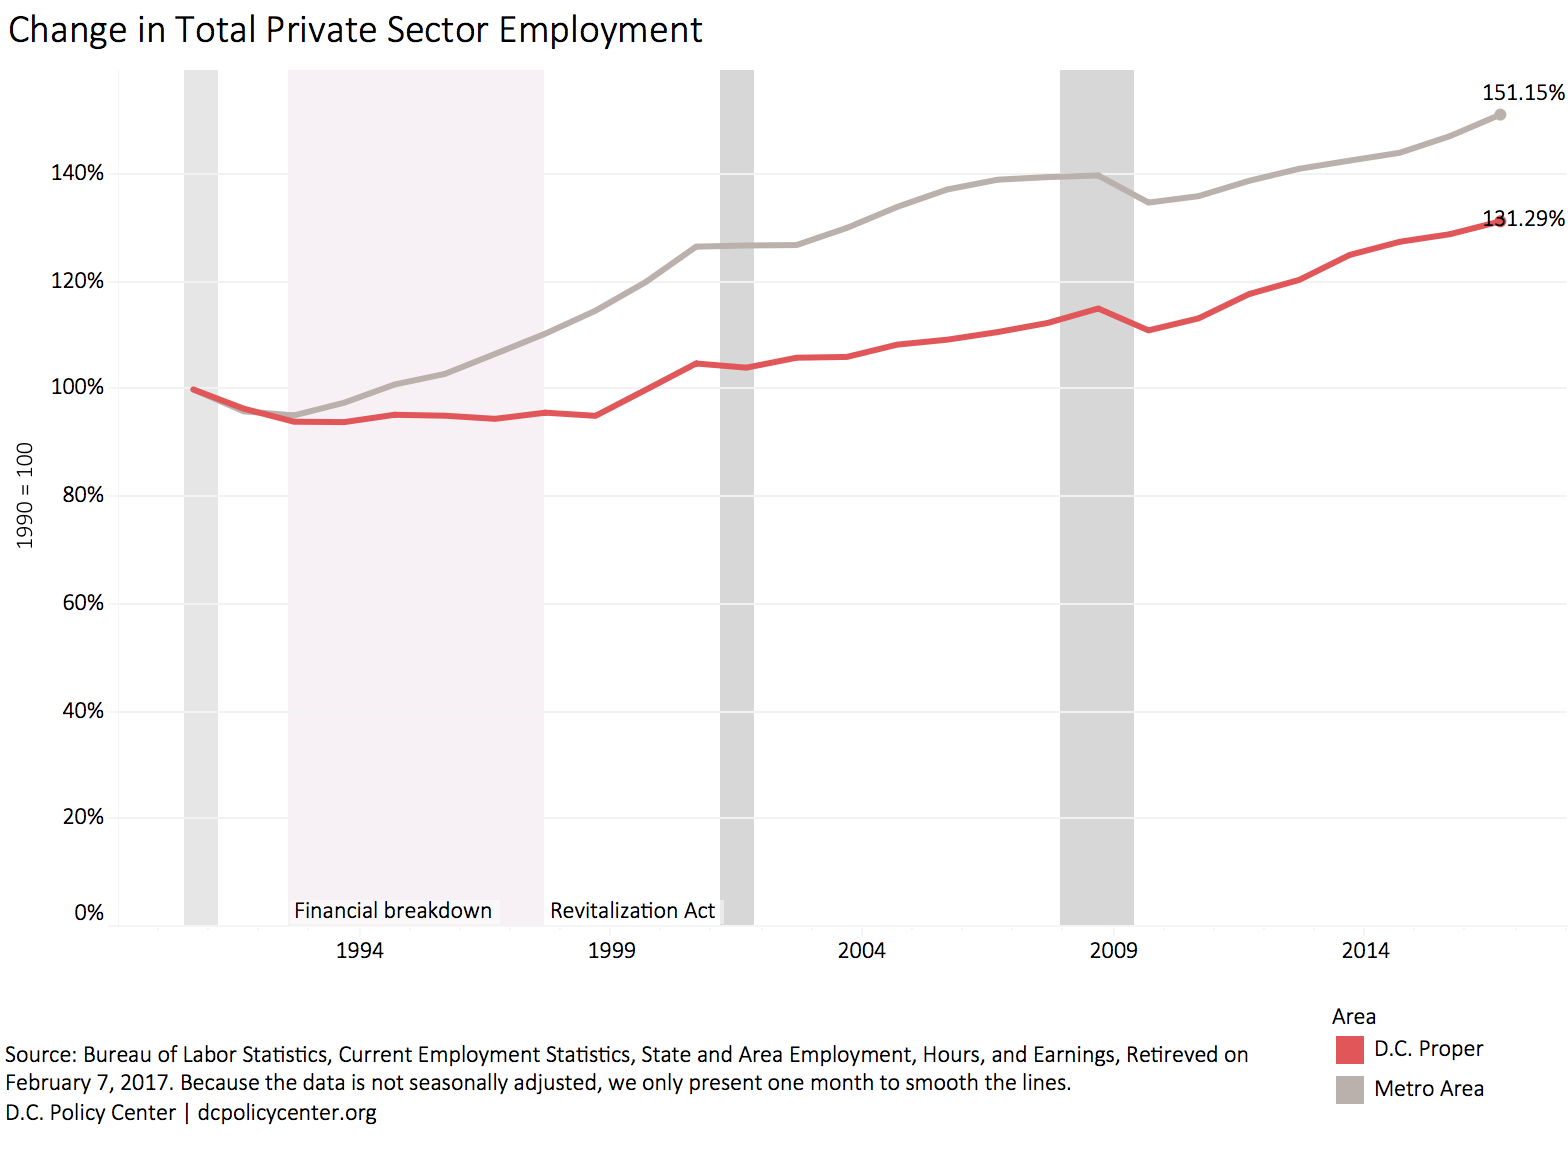
Since the Revitalization Act, the District experienced high job growth, especially in the private sector, consistently outperforming the growth of the greater metropolitan area. At the end of 2016, the District’s establishments collectively hired over 780,000 employees, with 60 percent working in the private sector. Private sector employment has increased by more than 25 percent since 1998, the first year after the Revitalization Act was enacted and the low point for D.C. employment. There has been positive job growth in the private sector every year except for 2009 (which saw a decline of 7,600 jobs). But even that year, total job losses were tempered by the expansion of federal employment, resulting in a net reduction of only 2,100 jobs. Private sector employment growth has been particularly strong since 2011. During the six post-recession years, the city has added nearly 70,000 private sector jobs, accounting for over half the growth in employment since 1998. Public sector growth during the same period has been nearly flat. In 1997, the federal and District governments combined hired 233,200 workers; in 2016, public employment was at 239,400. The public sector is still the largest source of employment in the District, but its share has declined from 37 percent at the time of the Revitalization Act to 31 percent today.
The health and education sectors have been leading the growth in employment in the District, adding 52,000 jobs (64 percent growth rate) since the Revitalization Act. Most of this expansion took place after the Great Recession. Since then, these two sectors have added over 4,000 jobs per year, increasing their share in all private sector employment to 24 percent (from 21 percent in 1998). Professional and business services—the largest sector in metro employment—grew by 46,000 jobs, but job growth has softened since 2009, with an annual average job increase of 2,500. Leisure and hospitality sectors, mainly hotels and restaurants, added 32,800 jobs (a 77 percent increase) and is now the third largest source of employment in the city. Other services, which include lobbying, associations, and personal services, added 17,000 jobs. The information, transportation, and utilities sectors all shrank, both in the District and the entire metropolitan area.
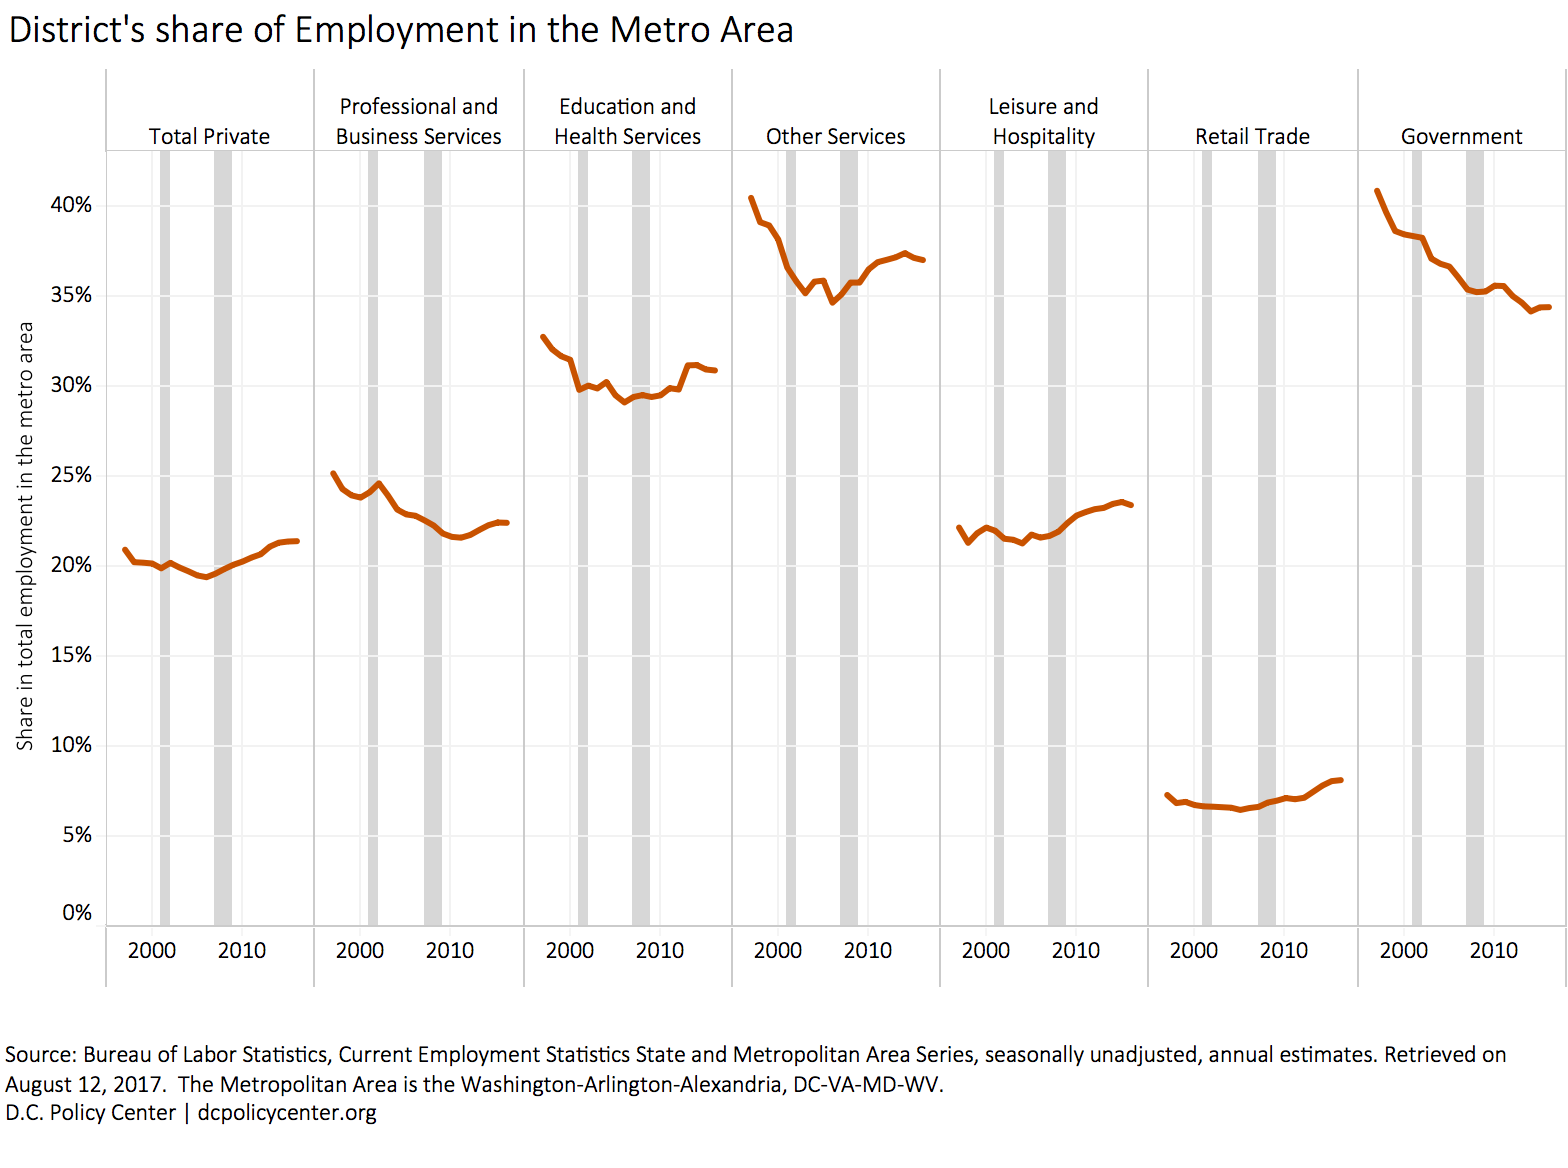
While employment is increasing faster than the metro area, we are losing our relative strength in some of the higher-paying industries to the suburbs. The District still holds about 21 percent of all private sector jobs in the metro area, but its employment growth relative to the region has occurred in industries that pay lower salaries. The professional and business services sector, where the District is losing ground, pays significantly more ($92,500, according to the Bureau of Labor Statistic estimates) relative to other key sectors, such as education ($40,290), health and social assistance ($47,840), restaurants ($22,700), hotels ($37,200), retail trade ($25,810), and other services ($68,700).
The District has access to a talented workforce.
The District draws its workforce from the larger metropolitan area, and the city attracts an educated workforce from all around the country. In 2016, 828,000 people worked in the District, including those who are self-employed. Among these workers, only 267,100 (32 percent) were D.C. residents. The remainder commute from Maryland (327,400 workers, or 40 percent of the workforce) or Virginia (234,200 workers, or 28 percent of the workforce). In addition, many D.C. residents in the District’s workforce are newcomers. Between 2000 and 2015, the District received nearly 185,000 new residents who moved into the city because they got a job in the District or their job was relocated to the District. Another 67,000 moved here to attend college or because they had just graduated and found the District to be an attractive job market. Not all of these newcomers stayed, but over 42 percent of District residents who moved to the city sometime in the previous 12-month period, did so for their careers.
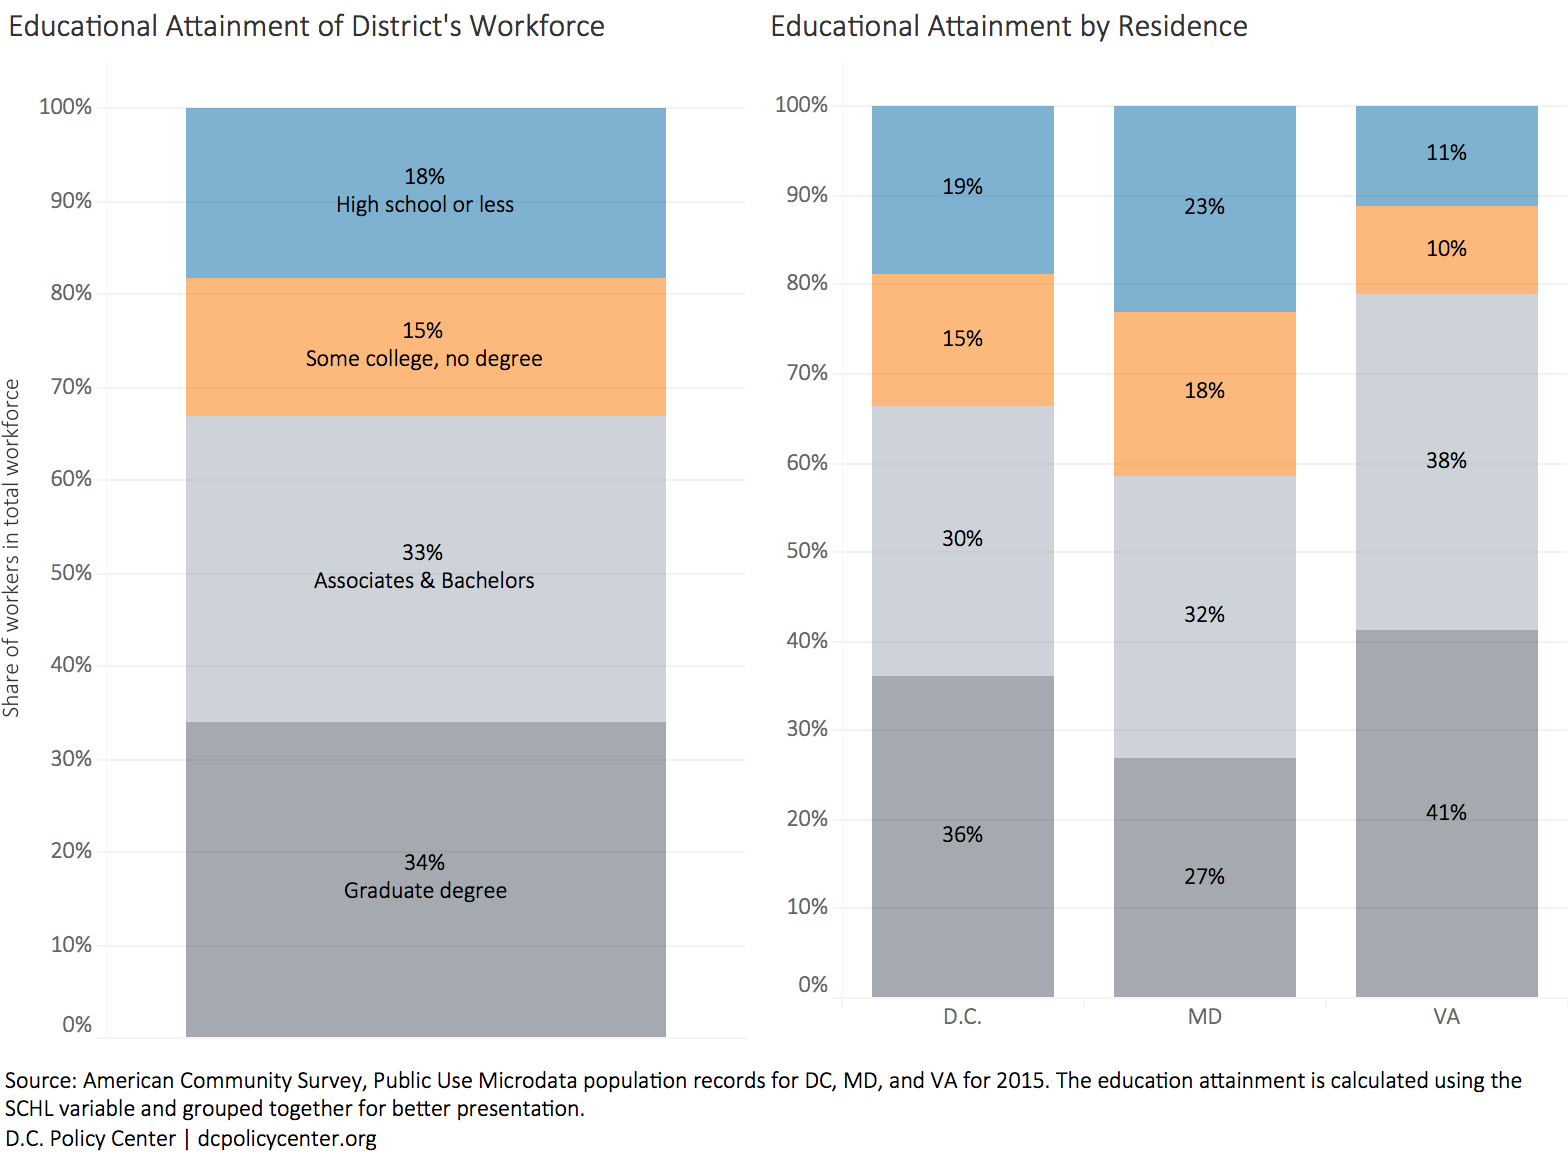
The District benefits from one of the most educated workforces in the country. One third of the District’s workers hold a graduate degree (doctorate, master’s or a professional degree); one third have a college degree; 15 percent have attended some college but did not receive a degree; and 18 percent have a high school degree or less. Educational attainment is highest among commuters from Virginia. Among Virginia workers, 41 percent have graduate degrees, and 21 percent lack a college degree. In contrast, 41 percent of commuters from Maryland do not have a college degree. Many of these workers from Maryland, especially from Prince George’s County, are former D.C. residents who have been priced out of the District’s housing market. Prince George’s County has the highest number of migrants from the District. In 2015, for example, nearly 10,000 D.C. residents, mostly from Wards 7 and 8, moved there to access cheaper housing or an easier commute.
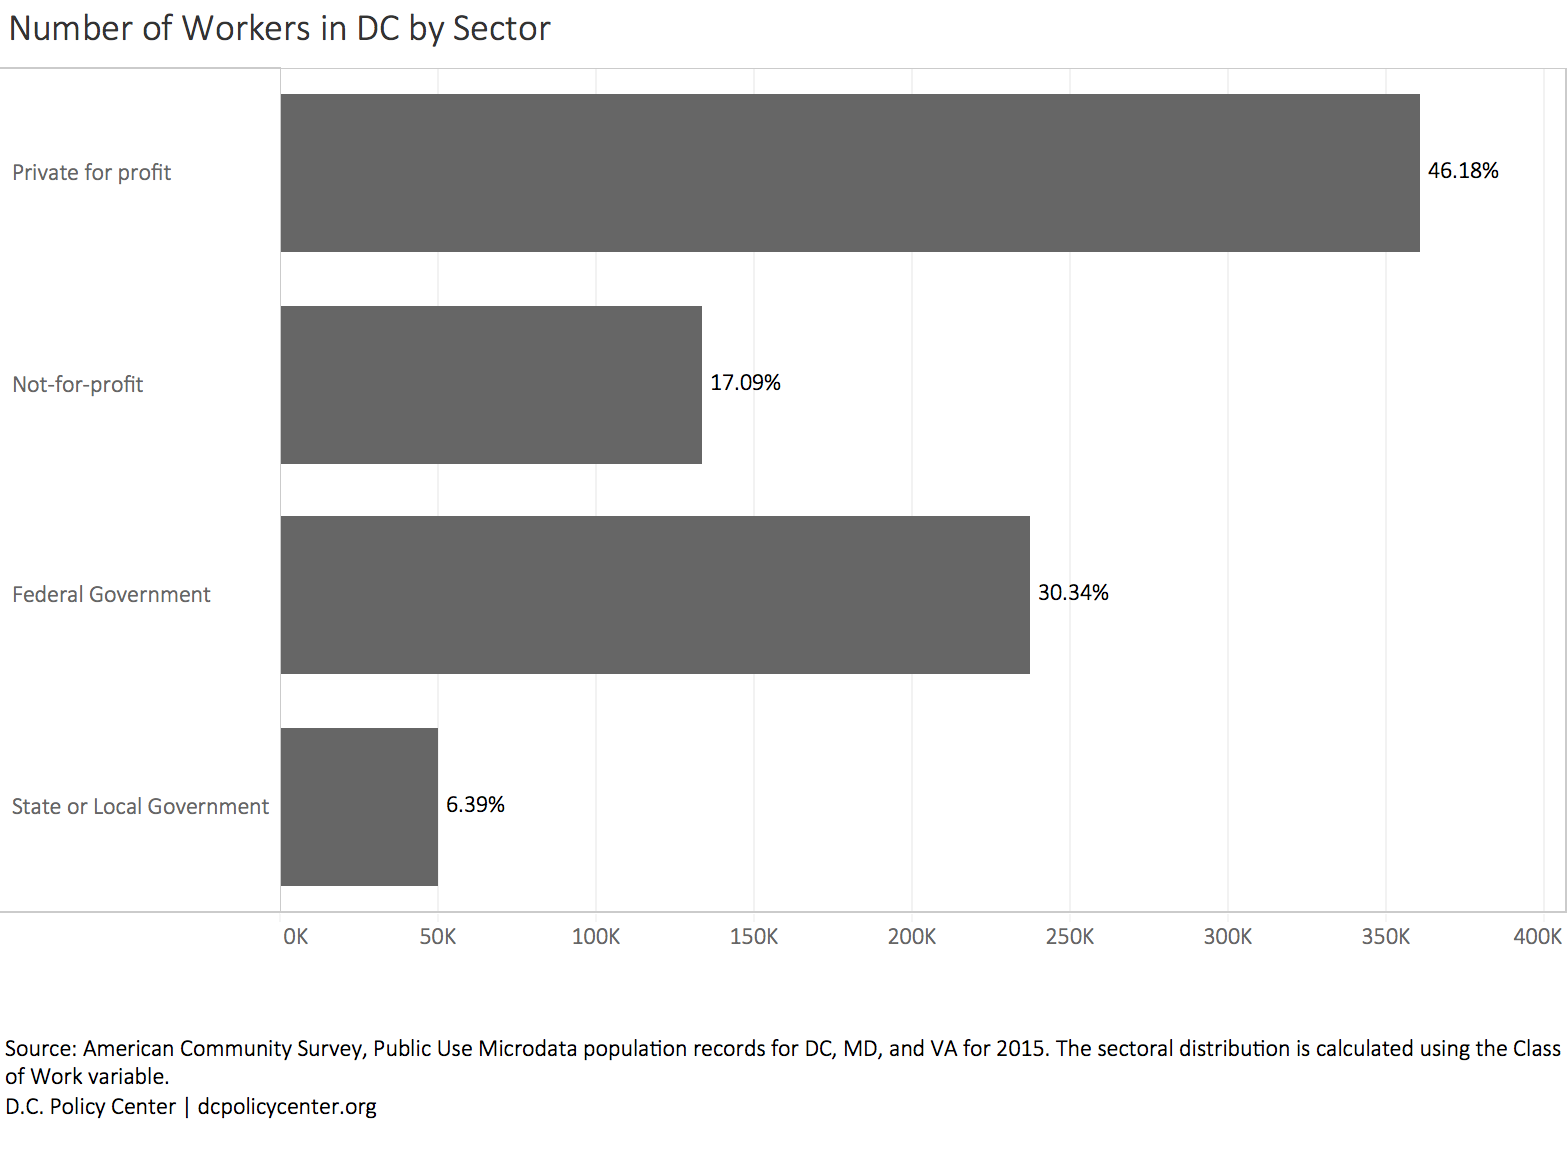
Wages and salaries paid in the District are among the highest in the nation. In 2016, the median salary paid in the District was $82,950, 1.7 times the median salary in the United States (reported at $49,630), according to the Bureau of Labor Statistics. One explanation for high wages and salaries is the presence of the federal government as an employer. In 2016, the federal government employed 237,300 workers in the District, which accounts for 30 percent of the District’s 782,000 jobs. The median salary for federal workers was $112,000. District residents held about 50,000 of these jobs, and the remainder were filled by commuters from Maryland and Virginia. Median salaries in the private sector, in comparison, were much lower at $61,000 in the not-for-profit sector (17 percent of the workforce), and $48,000 in the for-profit sector (46 percent of the workforce).
District residents who work in the city hold a disproportionate share of the lower-paying jobs: 44 percent of jobs that pay a wage of $30,000 or less are held by D.C. residents, compared to 32 percent of all jobs in the District. Virginia residents tend to hold a larger proportion of higher-paying jobs (28 percent of jobs in the District and nearly 40 percent of all jobs that pay $100,000 or more.)
While the federal government presence has had a positive impact on wages and salaries, it is important to note that the District attracts a workforce with skills that are valued nationally. This can be seen in the occupational mix of the city. The District has one of the highest concentrations of management, professional, and technical occupations in the country. Managerial, professional, and technical occupations, which tend to pay higher wages, are the largest source of employment in the District. In 2016 these occupations—across all industries—were filled by 305,000 employees, accounting for 49 percent of all employment in the District, compared to 39 percent in 2001 (the earliest year for which there is comparable data). By comparison, management and professional occupations make up only 16 percent of jobs nationally. In addition, within the metro area, more of these jobs are in the District proper. The share of management, professional, and technical jobs in the greater metro area is 47 percent—higher than other metro areas with a similar workforce composition. These professionals have high levels of abstract skills, such as data analysis, creative thinking, and interpreting data for others, which are the most highly valued skills in the labor market.
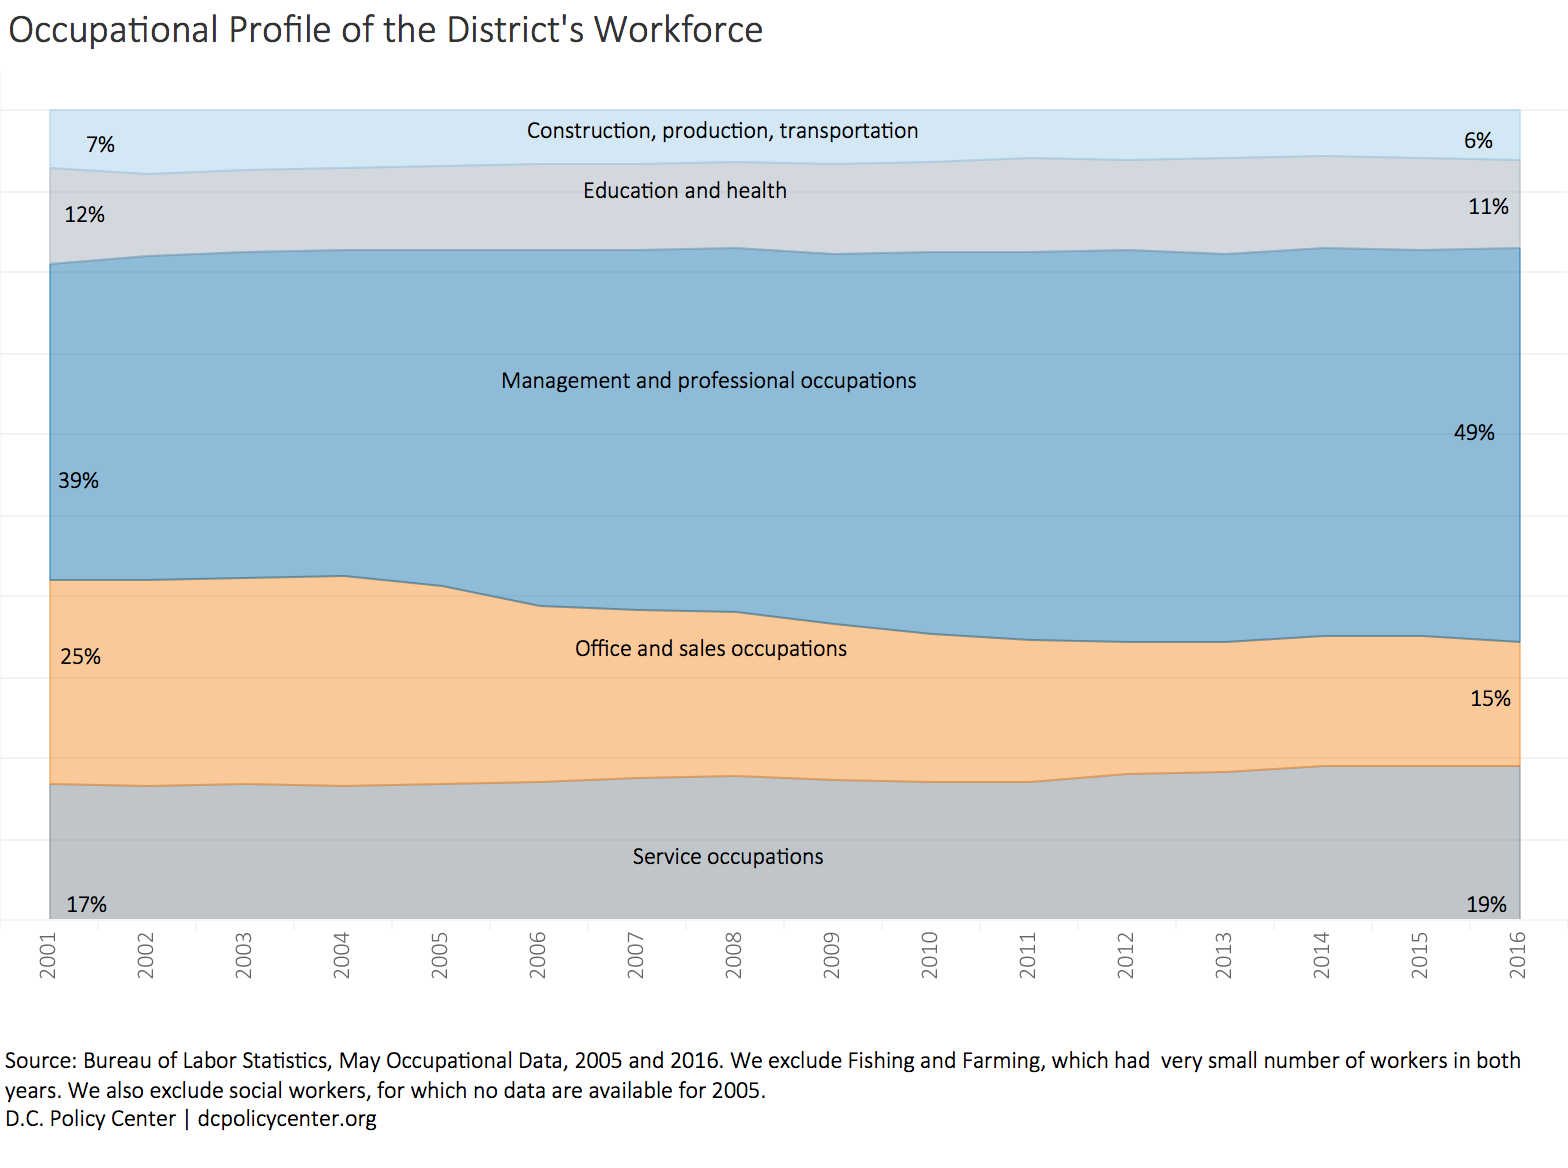
The second largest group of workers in the District is in service occupations. In 2001, service occupations, with 101,000 jobs, accounted for 17 percent of all District employment. Fifteen years later, these occupations accounted for 128,500 jobs, or 19 percent of all jobs in the city. The biggest gain in employment among service occupations has been in food preparation and food service—chefs, kitchen staff, and wait staff—which increased from 33,900 to 55,600 (57 percent growth) between 2001 and 2016. Personal care and service occupations added 7,200 new jobs, an 89 percent increase. Service occupations are higher in demand largely because of D.C.’s growing population. There are more restaurants, dry-cleaners, spas, hair salons, pet groomers, and gyms in the District, serving the city’s growing and increasingly affluent population. In contrast, the city is losing ground in office and sales occupations—the bread and butter of middle-class employment. Office and sales occupations, at 107,800 employees, now account for 15 percent of all jobs in the city. This is a decline of 46,000 jobs (or 10 percentage points in share). All the job losses in this occupational group are due to the decline in office and administrative support jobs. In 2016, 80,600 District workers held such support jobs, a decrease of 45,000 support jobs from 2001.
Several factors can help explain the decline in office jobs. First, decline in office and administrative support occupations is not unique to the District. Jobs for these occupations are disappearing everywhere and being replaced by automation and computerization. Technology has simplified administrative tasks, from managing communications to maintaining file rooms to keeping accounts, and most businesses rely on a much smaller support staff. In the greater metro area, for example, 75,000 such jobs disappeared. But the decline in the District has been faster, and more than half the losses in the region were in the District. This may have to do with increasing rents, which force many businesses to relocate their back-office operations (together with the support staff who manage these operations) to the suburbs and beyond.
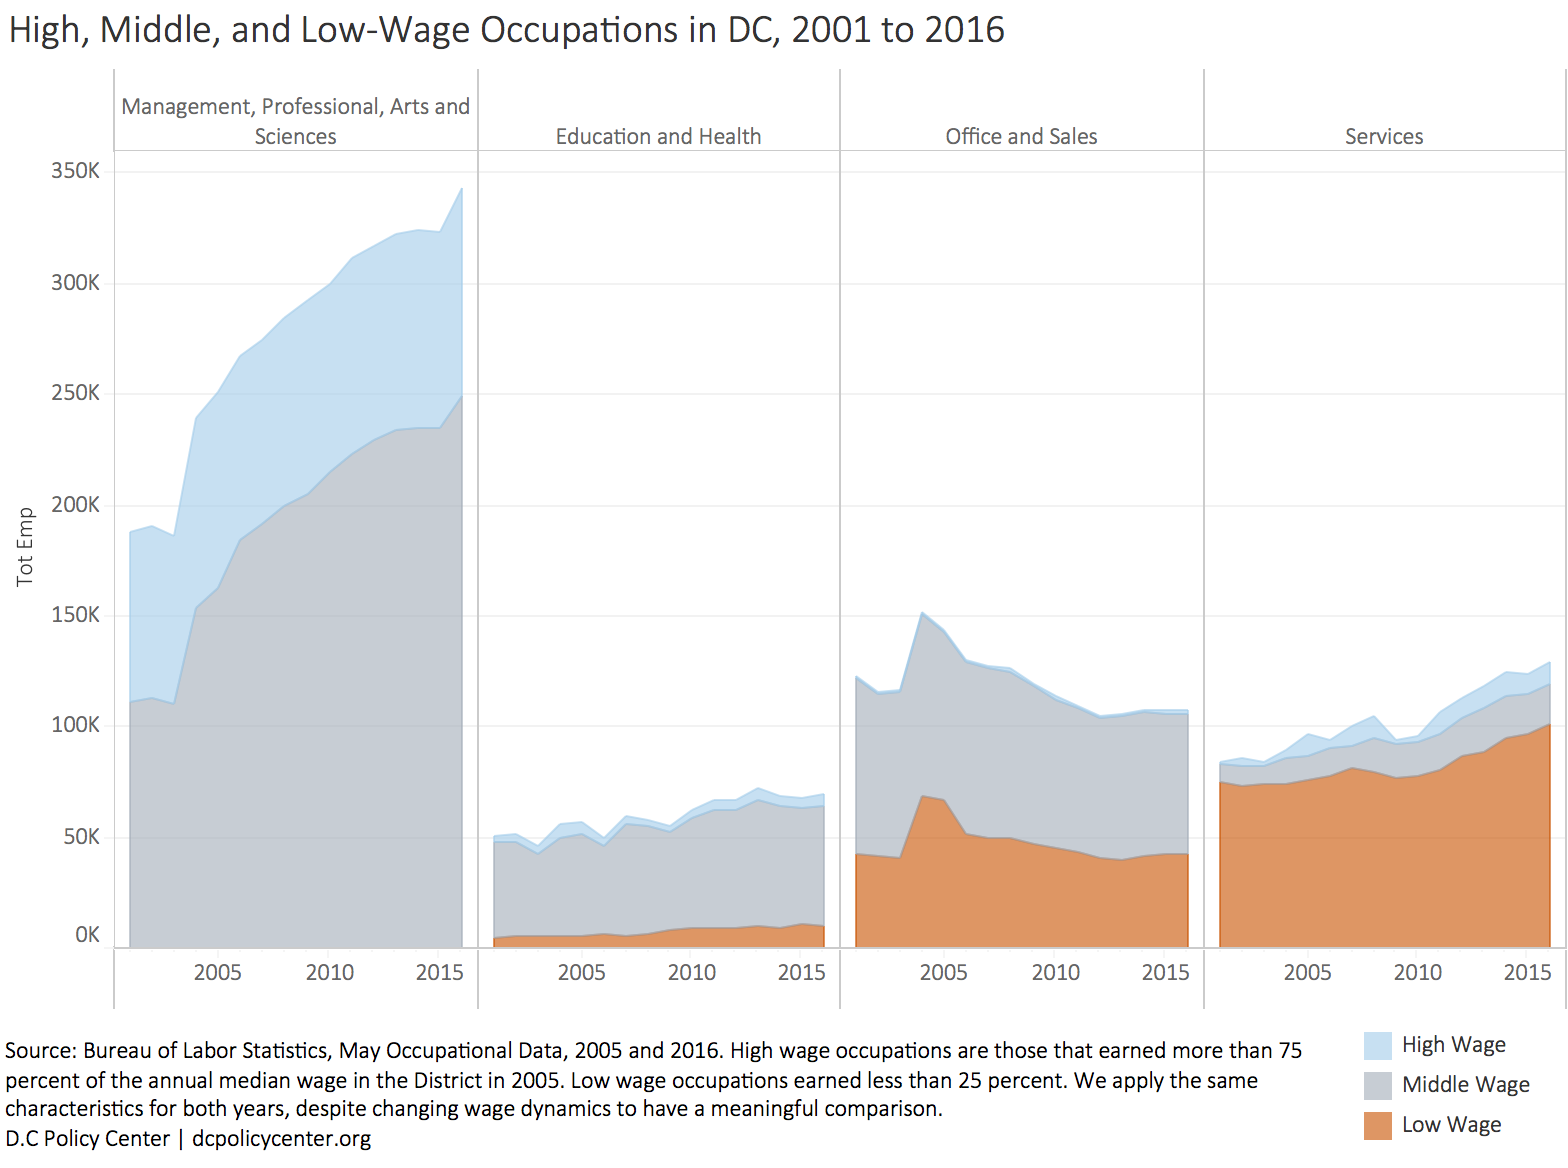
Despite strong job growth, the District is losing relative ground when it comes to high-wage jobs, especially high-wage jobs in professional, management, and technical occupations. In 2001, of the 186,000 jobs occupied by professionals, managers, and technical staff, 76,000 (or 41 percent) were high-paying jobs. In 2016 the share of high-wage jobs among professionals and managers decreased to 27 percent. While there are more jobs for high-wage occupations compared to 2001 (17,000 more), middle-wage jobs increased even faster (128,000 more). In all other major occupational groups with a large presence in the District (education, health, office, sales, and service occupations), high-paying jobs increased marginally (by 12,000 jobs combined). In these sectors, the losses are in middle-wage occupations, which have declined in share (from 51 percent to 45 percent), while low-wage jobs increased their share from 47 percent to 50 percent.
Economic segregation is on the rise.
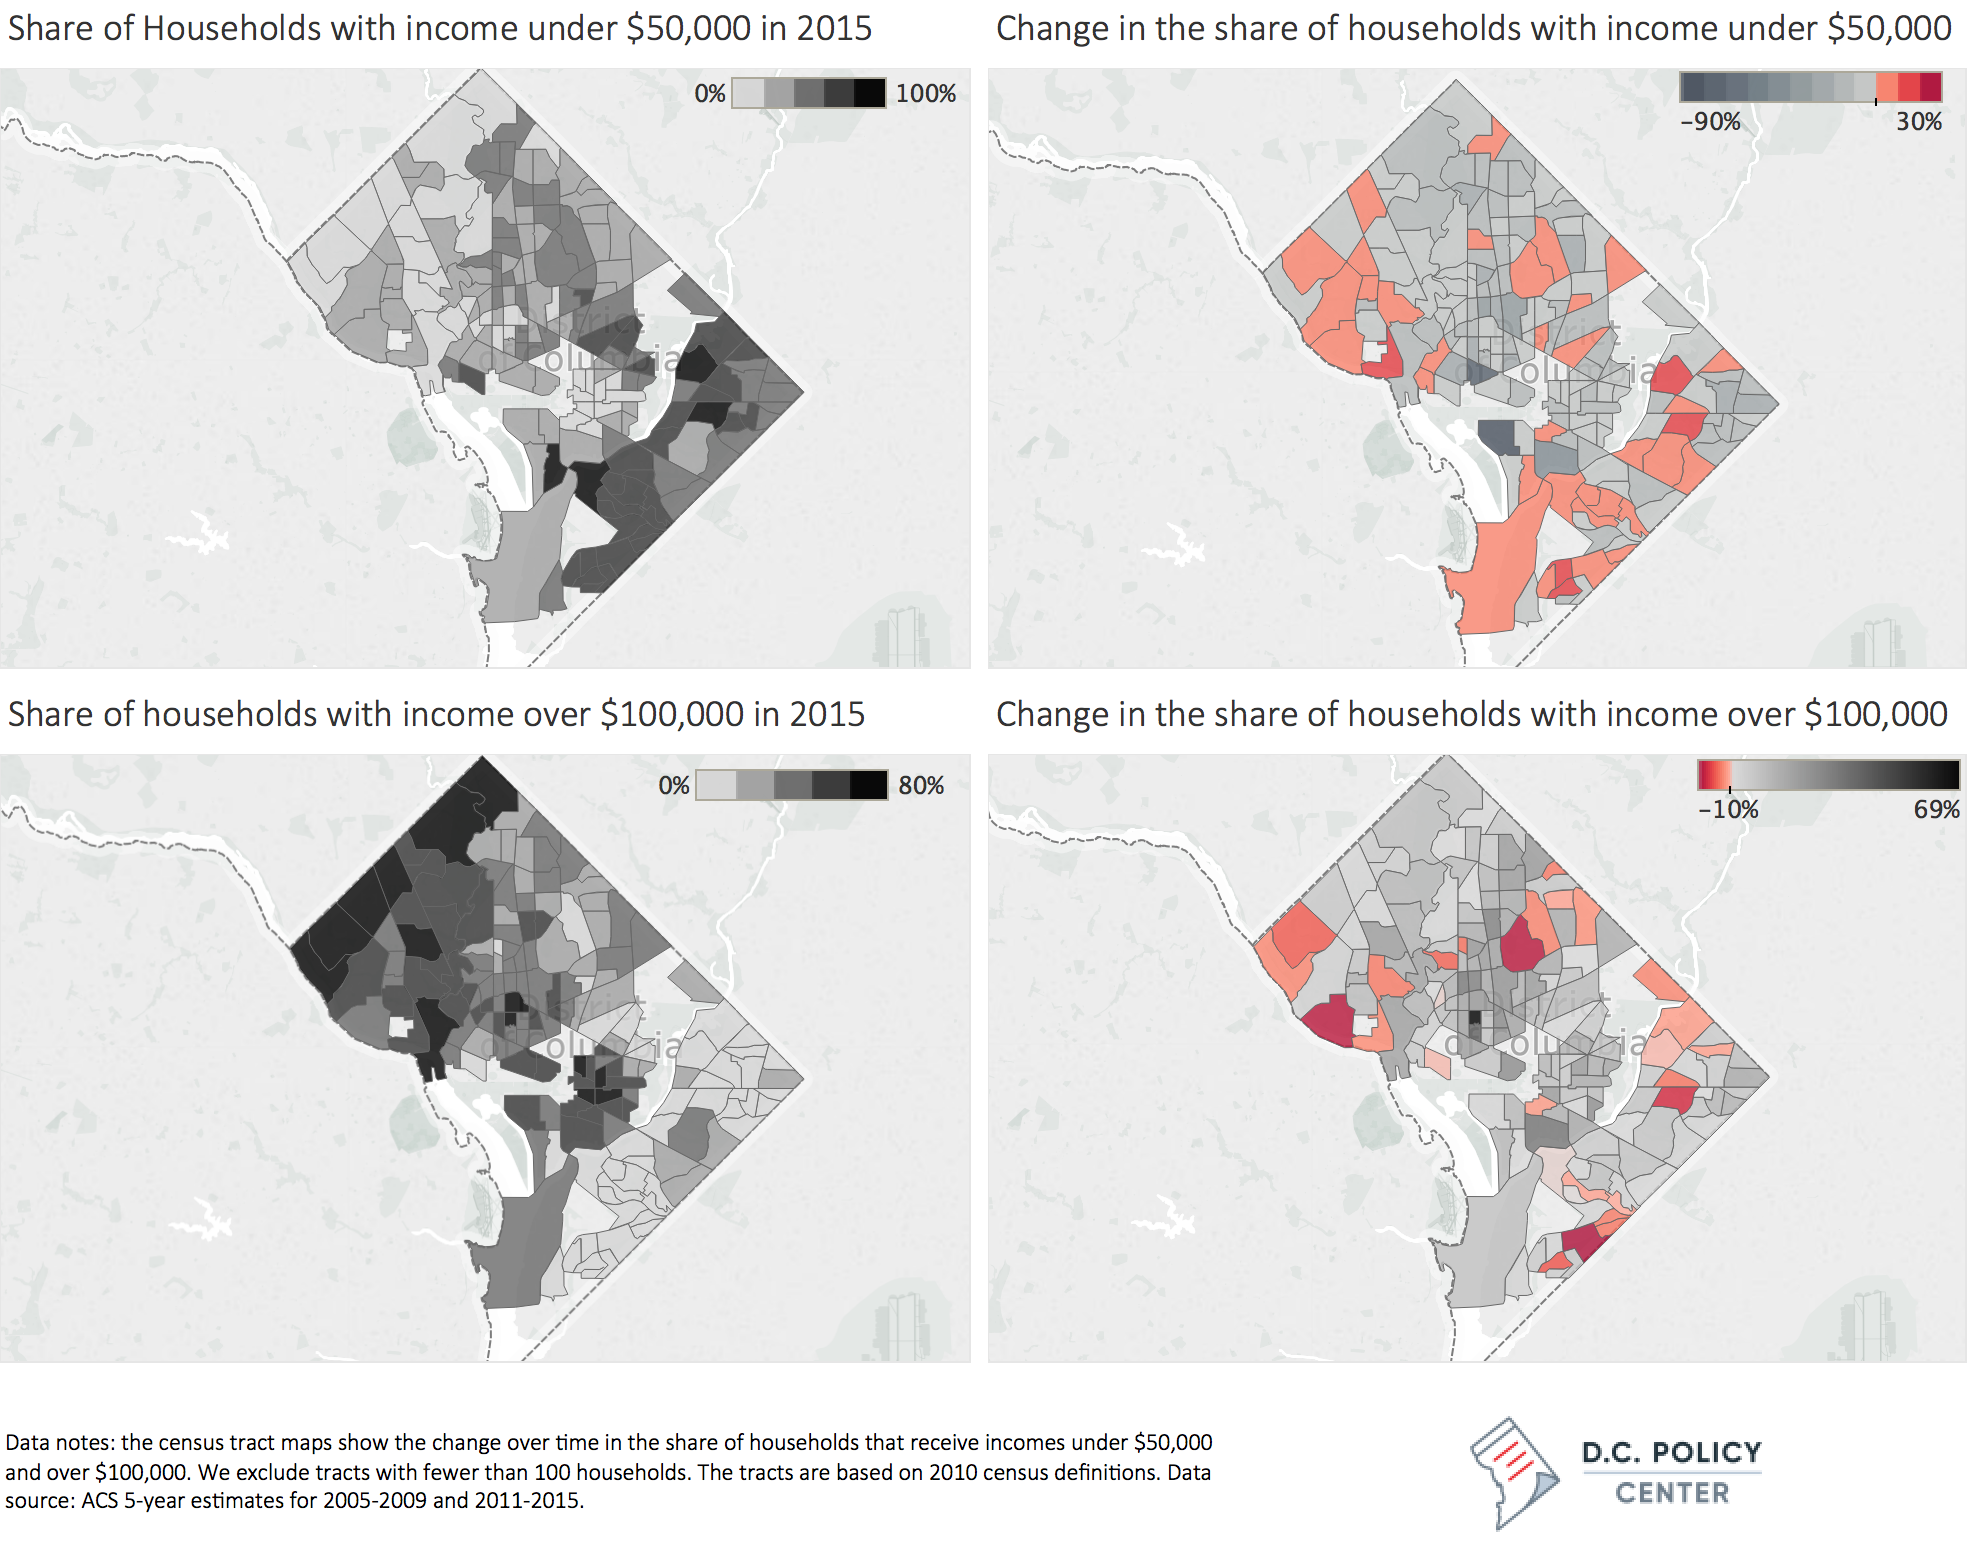
While incomes have increased, so has economic segregation. Not everyone has benefited from the economic growth the same way, and income gaps between our richest and poorest residents have increased. While incomes more than tripled in the central corridor, they have declined, especially among the families, in east of the river. The District is whiter and richer – share of blacks is now 47 percent compared to 55 percent in 2000—but racial and economic divides across neighborhoods have also become deeper. The metropolitan Washington area provides many opportunities for upward economic mobility, enticing the middle class out of the city. As measured by the proportion of children who went on to make more money than their parents later in life, D.C metro area has one if the highest rates of upward mobility, ranking 13th in the 50 largest U.S. metro areas in upward mobility. However, upward mobility within the District is among the lowest of all counties in the country. The District offers its own push factor: faced with high costs of housing, and sometimes lack of amenities such as grocery stores in their immediate neighborhoods, many low-income residents are moving to the suburbs. Protectionism and NIMBYism are also on the rise, limiting opportunities for lower income residents and future generations from sharing the growing wealth in the city.
A few things to watch in the economy
Today, the District is a very different city. More of the economic activity shifted from the public to the private sector. Earnings increased by 73 percent in real terms and earnings by D.C. residents grew even faster, by 87 percent during the same period. Since the end of the Great Recession, the District has been outperforming the metropolitan area in employment, jobs, and output growth. Since 2011, resident employment has grown faster than jobs in D.C., suggesting that more and more residents are living in the city and working elsewhere. The District’s economy also weathered the Great Recession with smaller losses than many other jurisdictions in the area. The city’s general revenue has risen fast enough to fully implement a major tax-reduction package approved in 2013, while increasing public spending on key areas such as education and housing. As a result, the District has become more competitive with surrounding jurisdictions. However, despite these successes, some economic pitfalls remain.
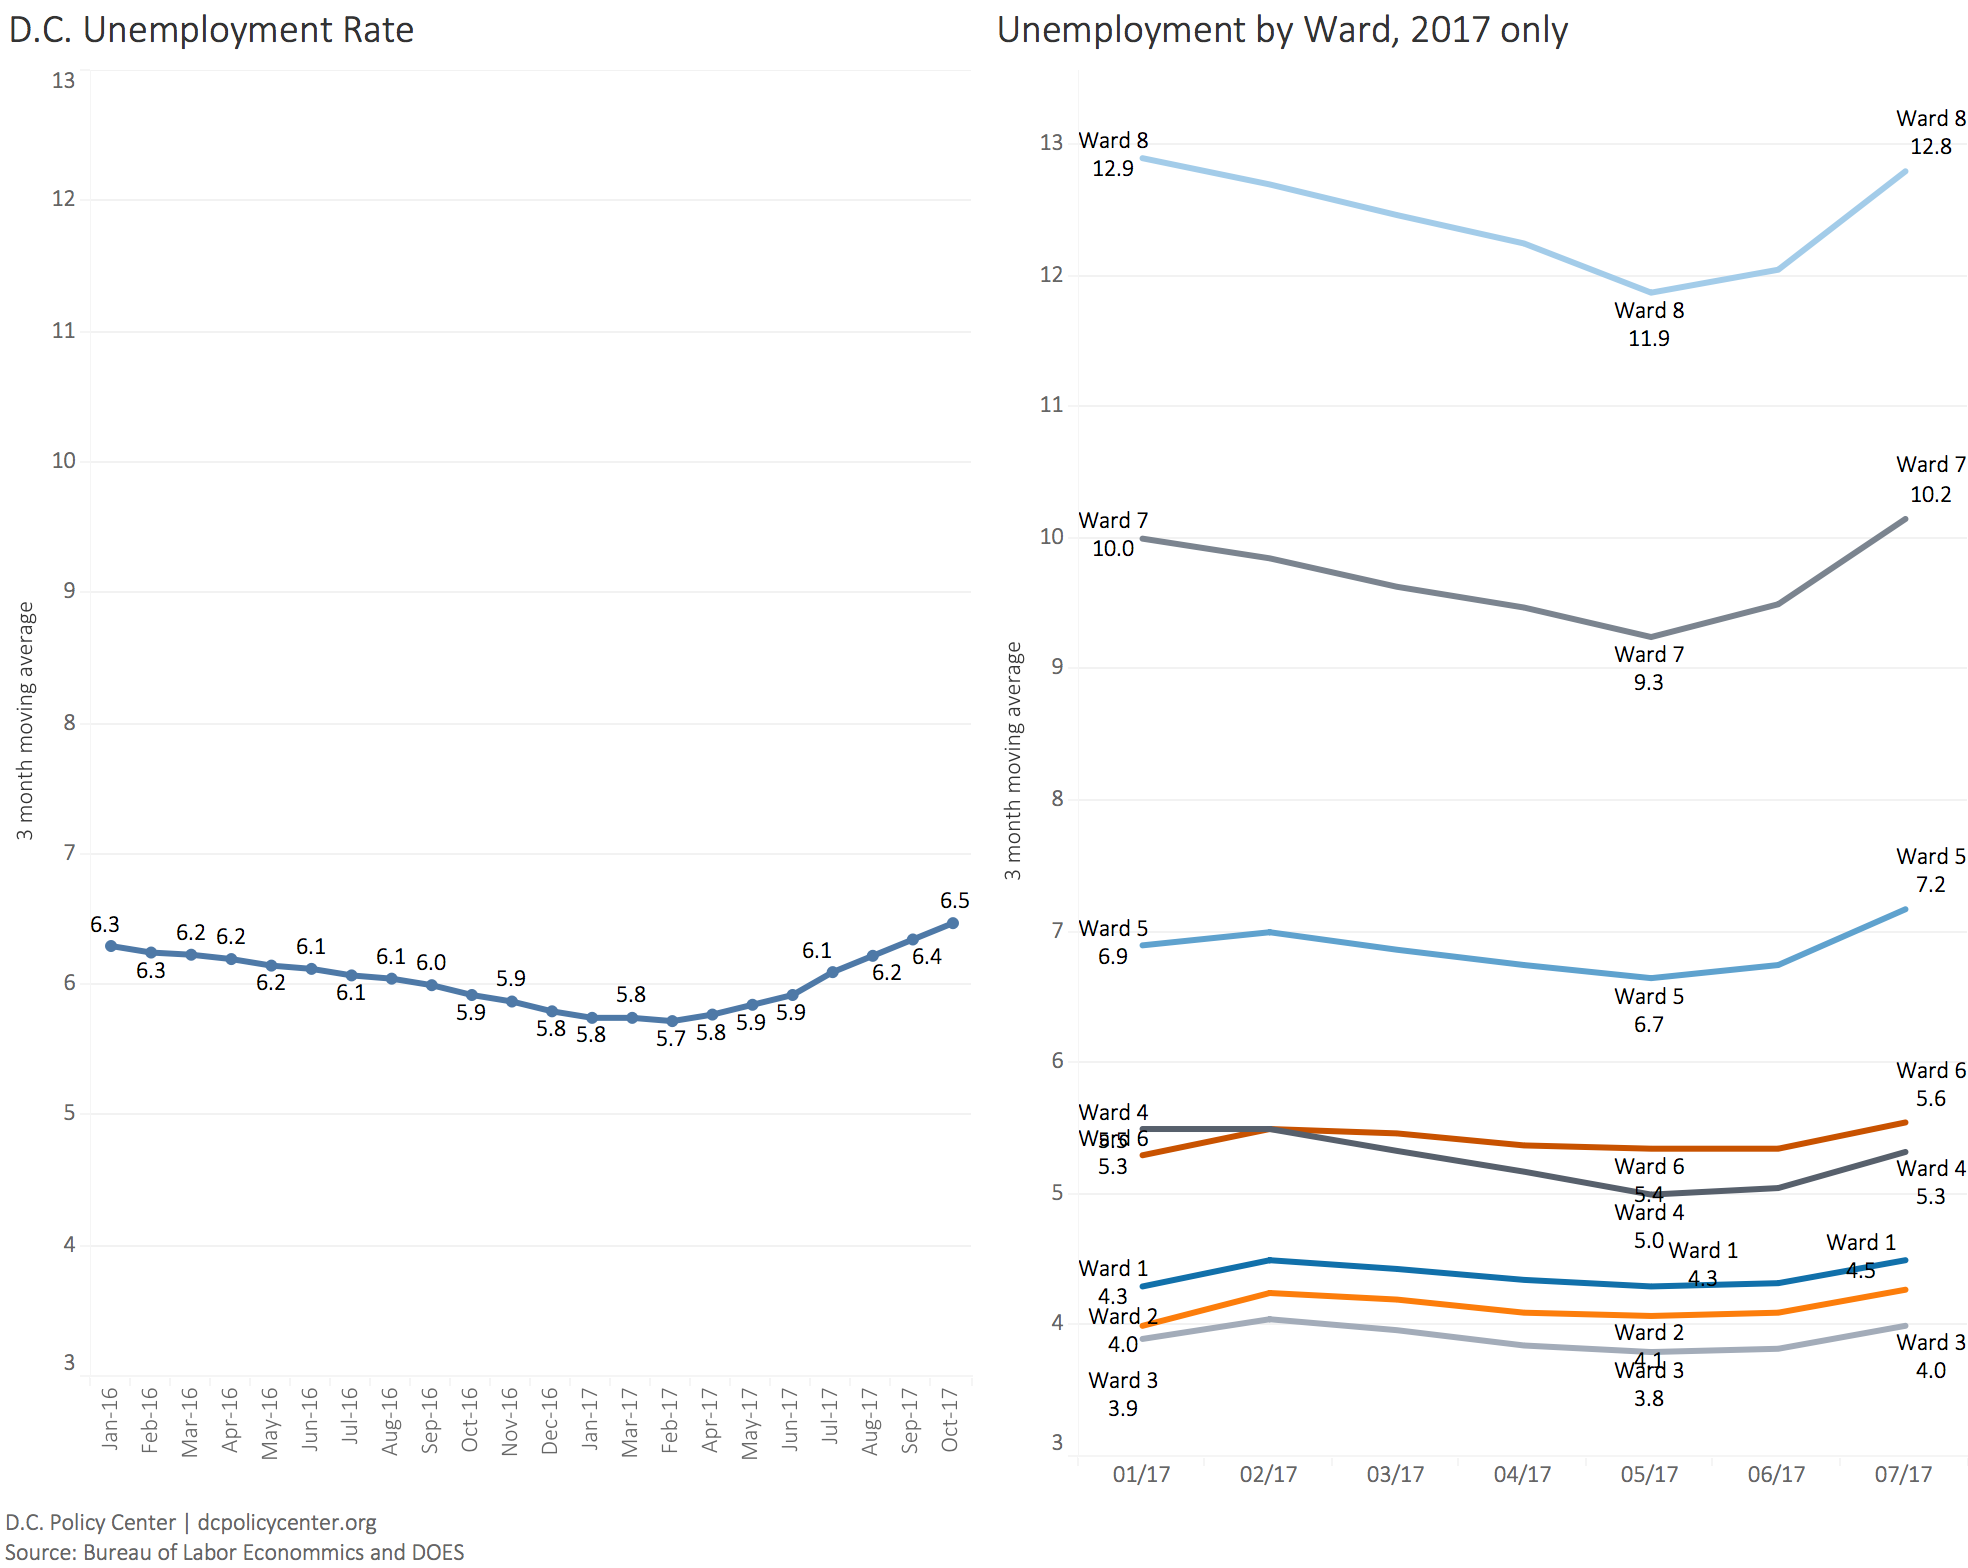
First,while total employment is on the rise, job stability appears to be going down. In 2016, of every 25 jobs that opened, 24 made up for a job lost elsewhere in the city. The increasing job churn usually signals that unemployment rate is going to increase. This has indeed been the case in the District: since the beginning of 2017, unemployment rate increased from 5.7 percent (3-month moving average in March) to 6.5 percent. The increase in unemployment has been affecting all wards, but especially Wards 7 and 8, where unemployment rate spiked up nearly a full percentage point. Upcoming increases in the minimum wage and the implementation of the universal paid leave will likely up additional stress on the labor markets, especially for residents with low-paying jobs.
Second, high-wage and middle-wage job creation has slowed down as private sector activity is increasingly shifting to services. New jobs are coming from retail and hospitality, two of the lowest paying industries in the District. The first wave of losses in high-paying jobs happened in the public sector before the mid-2000s, as the federal government moved more of its operations and employment out of the District. The city now holds 34 percent of all government jobs in the area compared to 40 percent in 1997. The more recent wave of losses in high-wage jobs are in professional, management, and technical occupations. But more importantly, the District is losing middle-wage jobs in areas that are typically seen as the backbone of middle-class white-collar employment, especially in office support and sales occupations.
Third, jurisdictional fragmentation and tensions among the localities that make up the metro area threaten growth. Collaboration with surrounding jurisdictions is weak. Transportation is the prime example as the region struggles to find a stable, long-lasting solution to the financial woes of the Metro system. It is not clear if the markets have yet priced in the risks associated with a failing Metro, but if leaders cannot develop a solution, the region could see shifting patterns in employment. Almost no other efforts exist between the District and its neighboring jurisdictions to collaborate on housing, workforce development, labor laws, or social safety nets—areas where such collaboration would be most meaningful.
This article is adapted from a chapter of the 2017 State of Business in the District of Columbia: Twenty Years of Change Since the Revitalization Act.