
Since the mid-2000s, the District of Columbia has experienced a population boom accompanied by rising housing values—and, in recent years, more students in public schools. In most cities with similar population growth, housing prices rise in tandem with the number of school-age children in neighborhoods with schools that are perceived as high-quality. However, due to D.C.’s high degree of public school choice, schools appear to be less of a factor in families’ housing decisions, as a recent D.C. Policy Center report showed; several neighborhoods have seen school enrollment levels increase far faster than the number of school-aged children living there, and many neighborhoods with the greatest gains in school enrollment have not had the largest increases in housing prices.
This is not to say that families are indifferent to schools when choosing where to live. Most notably, as a 2018 D.C. Policy Center report showed, families currently living in the feeder pattern for Woodrow Wilson High School overwhelmingly send their children to in-boundary schools over other options in DCPS or at public charter schools, across all grade levels.[1] However, neighborhoods within the Wilson High School boundary area are not expected to see large increases in their school-age populations going forward, which means that any future growth is expected to happen in areas of the city where relatively few children attend an in-boundary neighborhood school.
However, D.C.’s school-age population and public school enrollment have been growing at different paces, with larger gains in students attending early grades and younger children. This analysis takes a closer look at the data to examine whether the connection between housing and school decisions varies by grade band (pre-kindergarten, elementary, middle, and high school) and corresponding ages, and finds no patterns at these narrower slices either.
Changes in early grades and younger ages
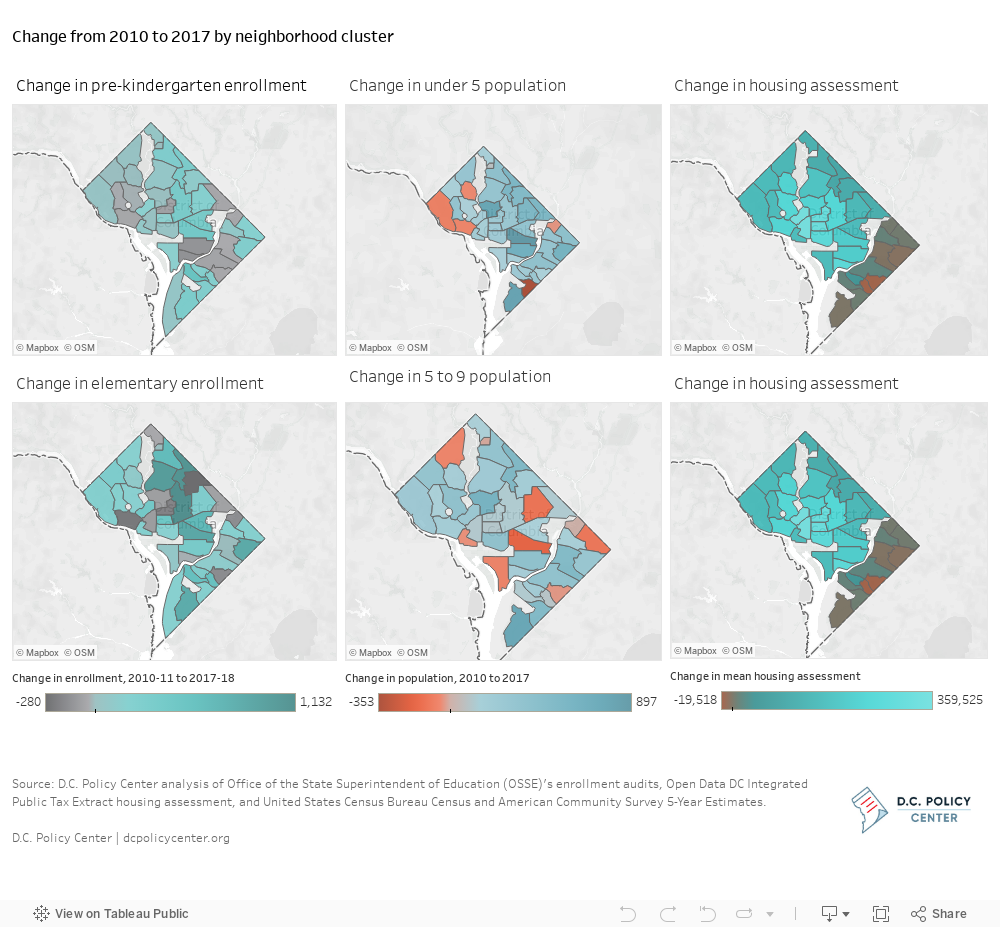
Focusing first on younger ages and earlier grades where the city has seen the most growth in recent years, changes in enrollment are not aligned with changes in the school-age population or appreciations in housing assessment. Enrollment in pre-kindergarten and elementary grades increased in most neighborhood clusters. There are a few areas of the city where pre-kindergarten enrollment decreased (five clusters near Capitol Hill and three clusters near Cleveland Park), whereas elementary school enrollment change occurred neighborhood by neighborhood in many cases. Michigan Park, the cluster that lost the most elementary school students, is even adjacent to the Edgewood cluster that gained the most elementary students. By comparison, values of single-family homes tended to change along with those in contiguous clusters, rising more in the center of the city and declining east of the Anacostia River. And the population in corresponding age ranges increased in most clusters, with decreases scattered across the city in clusters that are different from those with declining enrollment.
Changes in enrollment by grade band
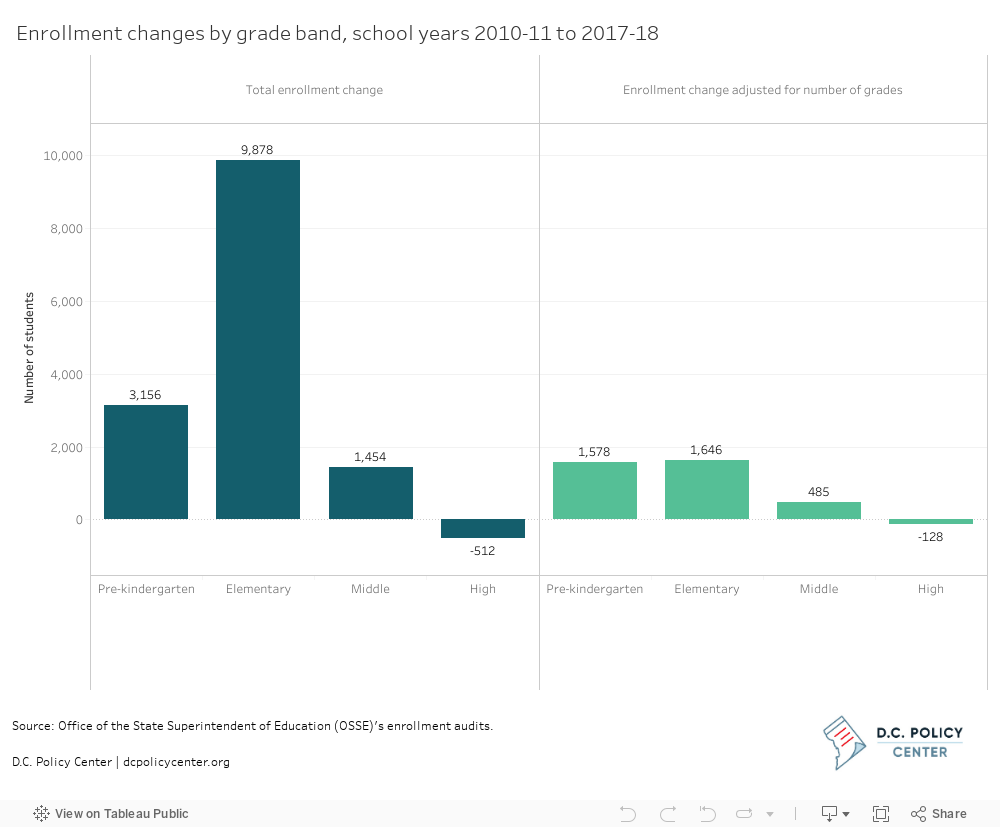
Looking across all grades, public school enrollment has grown the fastest in pre-kindergarten and elementary grades at around 1,600 students per grade since 2010. Middle school grades have also grown by about 500 students each, while high school grades have slightly declined in enrollment. This is consistent with findings that families are opting into D.C.’s public schools at higher rates through grade 5, and more families are also staying with public schools through middle school grades. As the current elementary school cohorts rise through upper grades, the city could also experience consistent gains in high school enrollment.
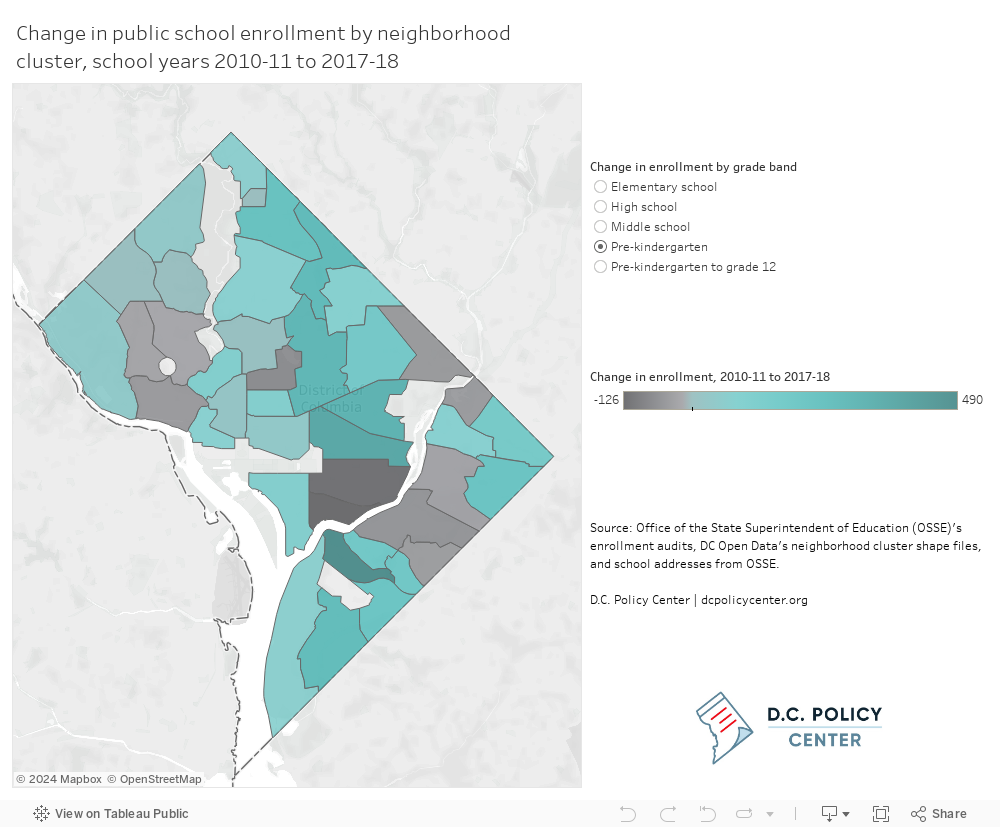
Enrollment increases were spread across most neighborhood clusters with schools serving students in pre-kindergarten, elementary, and middle grades from school years 2010-11 to 2017-18. For pre-kindergarten grades, the Barry Farms cluster experienced the largest gain in enrollment of 490 students, adding one new school and substantial capacity at two existing schools. Similar changes did not happen in nearby clusters, some of which lost enrollment in the same grades. Elementary school grades in the contiguous clusters around Petworth, Fort Totten, and Bloomingdale grew the most, with four new schools and gains across both District of Columbia Public Schools (DCPS) and public charter schools. Middle school enrollment rose the most in the Friendship Heights cluster, driven by expansion of enrollment at Deal Middle School. Among neighborhood clusters that have a high school, high school enrollment went down for all except for two clusters around Foggy Bottom and Petworth that gained around 500 students.
Changes in population by age group
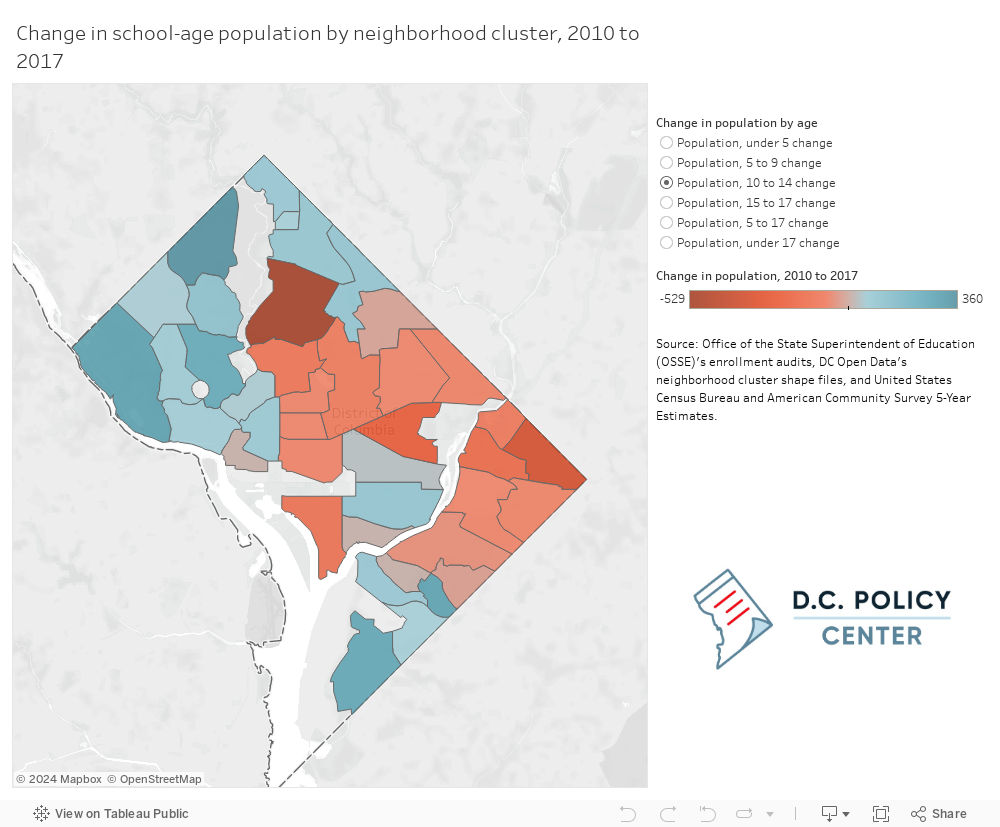
From 2010 to 2017, D.C.’s child population up to age 17 has increased by more than 17,000. The number of children under the age of 5 (closest in comparison to pre-kindergarten years) grew by the most, followed by those age 5 to 9 (closest in comparison to elementary grades). The number of children age 10 to 14 (approximately middle school ages) grew by a little bit, and those ages 15 to 17 and most likely to be in high school declined. These changes are happening at the city level in parallel with similar changes in public school enrollment in younger grades.
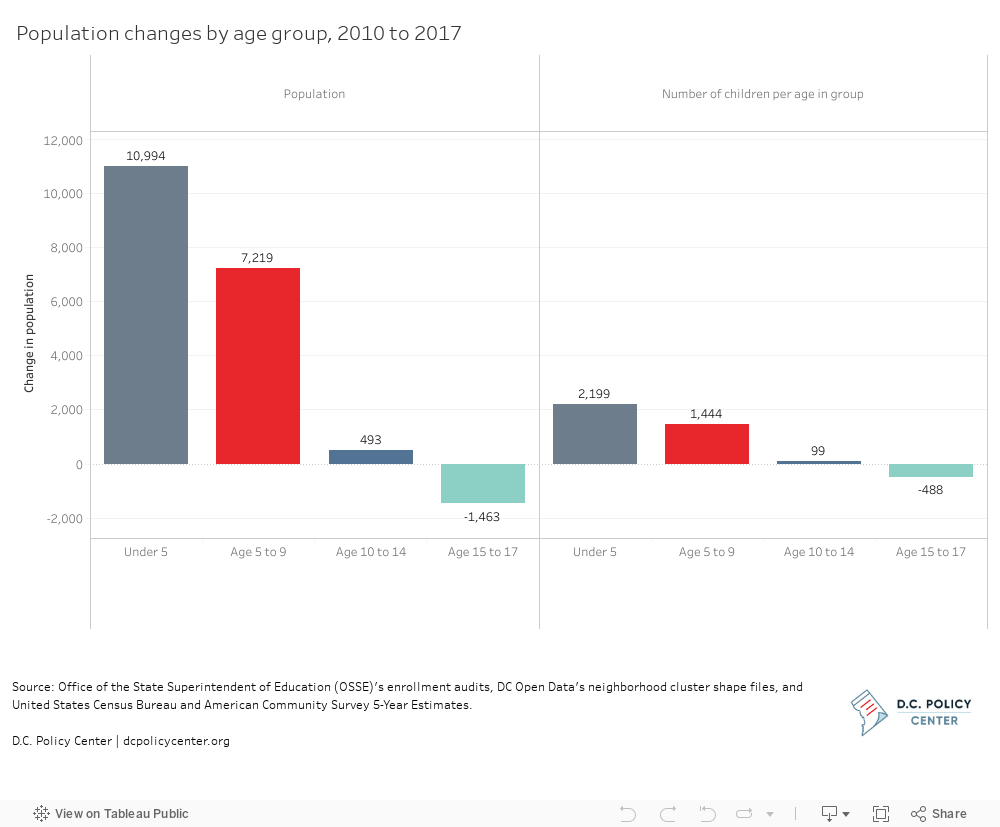
The number of neighborhoods that experience population growth declines with age. All but four neighborhood clusters added at least 50 new residents under age 5. In contrast, population growth among middle school-aged students have skipped 18 neighborhoods from Petworth in the north to Deanwood in the east and Hillcrest to the south. About half of neighborhood clusters had decreases in the high school-aged population, although the losses are distributed throughout the city.
Changes in housing values
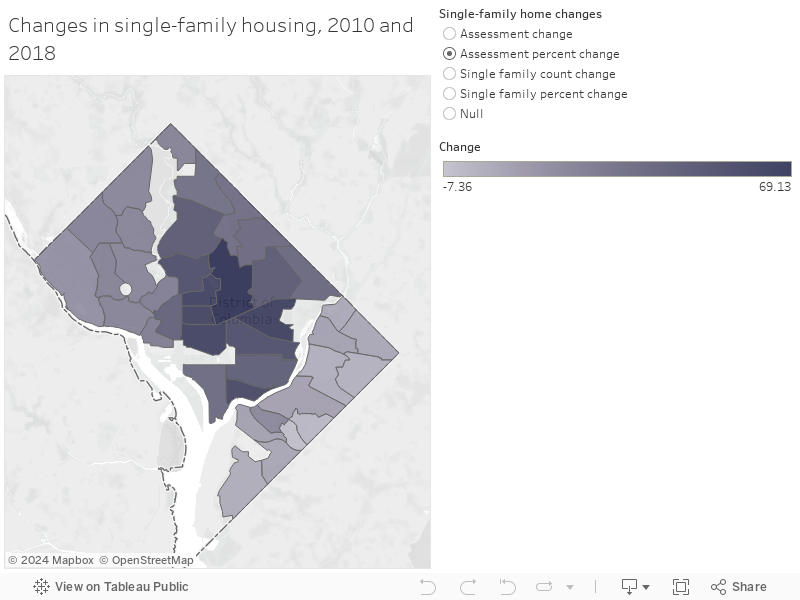
Housing assessments for single-family houses[2] increased by an average of $153,140, or 27 percent, in nominal terms for the neighborhood clusters with housing from 2010 to 2018 in D.C. By neighborhood, single-family homes appreciated the most (comparing level of changes) in the center of the city, and the least east of the Anacostia River. Some of these price changes could be influenced by decrease in the number of single-family homes as some are divided into condominiums.
Changes in enrollment by grade are not related to changes in the corresponding school-age population or housing assessments
The D.C. Policy Center examination of changes in public school enrollment, school-age population, and housing assessment by neighborhood cluster found that these changes are only weakly correlated at the neighborhood cluster level even though they are all moving in the same direction for the city as a whole. One factor explaining this disconnect is the high degree of choice in public schools available to D.C. families. With choice, parents can make housing decisions separately from decisions about where they will send their children.
Another factor could be that enrollment and school-age population are changing differently for different ages: D.C. has more younger children and students and pre-kindergarten or elementary students, but its high school population and enrollment has declined in recent years. School-age populations do not perfect align with grade bands due to data limitations, but pre-kindergarten enrollment can be compared to the population under 5, elementary school enrollment can be compared to ages 5 to 9, middle school enrollment can be compared to age 10 to 14, and high school enrollment can be compared to ages 15 to 17.
However, a closer look at these ranges for grades and ages shows that all correlations between enrollment and population or housing assessments are weak neighborhood by neighborhood (0.3 or less in in all cases). This confirms the broader analysis and suggests that other neighborhood attributes are driving changes in enrollment, population, and housing values.
About the data
The education data in this analysis are from the Office of the State Superintendent for Education (OSSE)’s enrollment audits, the National Center for Education Statistics’ Common Core of Data, and the DC Public Charter School Board Annual Report for 2011. Throughout this analysis, the term “public schools” is used to refer to both traditional public schools and public charter schools.
The housing data in this analysis are from Open Data DC’s Integrated Public Tax System Extract.
The population data in this analysis are from the United States Census Bureau and American Community Survey 5-Year Estimates.
Notes
[1] Six other in-boundary elementary schools (four in Capitol Hill, one downtown, and one in Dupont Circle) also have high boundary participation rates, but these rates dissipate beginning in the middle school years.
[2] D.C.’s housing stock is comprised of apartments (40 percent of units in 2017), single-family homes (31 percent), condominiums (21 percent), and co-operative housing (8 percent).[2] Many families will rent instead of buy, but this analysis focuses on single-family homes because of available data on capacity and assessments. Comparing data from Zillow on median two-bedroom rents with costs associated with home ownership from the D.C. Policy Center’s Taking Stock database[2] suggests that rental prices are likely to be similar to housing costs in neighborhoods where a two-bedroom single-family home costs less than $3,400 per month.[2] However, it is not possible to ascertain apartment capacity per unit with the data currently available,[2] limiting a full analysis of the rental market. Condominiums, another category of housing, are unlikely to have child residents and therefore less relevant to a study related to public school enrollment. An analysis of the Public Use Microdata Sample for the 2013-2017 American Community Survey 5-Year Estimates shows that 97 percent of households who pay condo fees in D.C. do not have children as residents. This is confirmed by the Deputy Mayor for Education’s EdScape tool, which estimates a yield of 7 public school students for every 100 condominiums, compared to 40 for single-family homes and 32 for apartments.
Chelsea Coffin is the Director of the Education Policy Initiative at the D.C. Policy Center.
Feature photo of Teacher Appreciation visit to Oyster Adams courtesy of US Department of Education (Source).