
Understanding D.C.’s criminal justice system is imperative as the city works toward racial equity, statehood, and attempts to make changes to D.C.’s system including the recent overhaul of D.C.’s criminal code. The federalization of D.C.’s criminal justice system, the direct result of the Revitalization Act, makes it uniquely complicated and has far reaching impacts on residents of the District of Columbia.
Amid ongoing work toward D.C. statehood, an outstanding question is the cost of the District fully re-assuming responsibility for its criminal justice system. One of the most talked-about components is that the District would need its own prison.
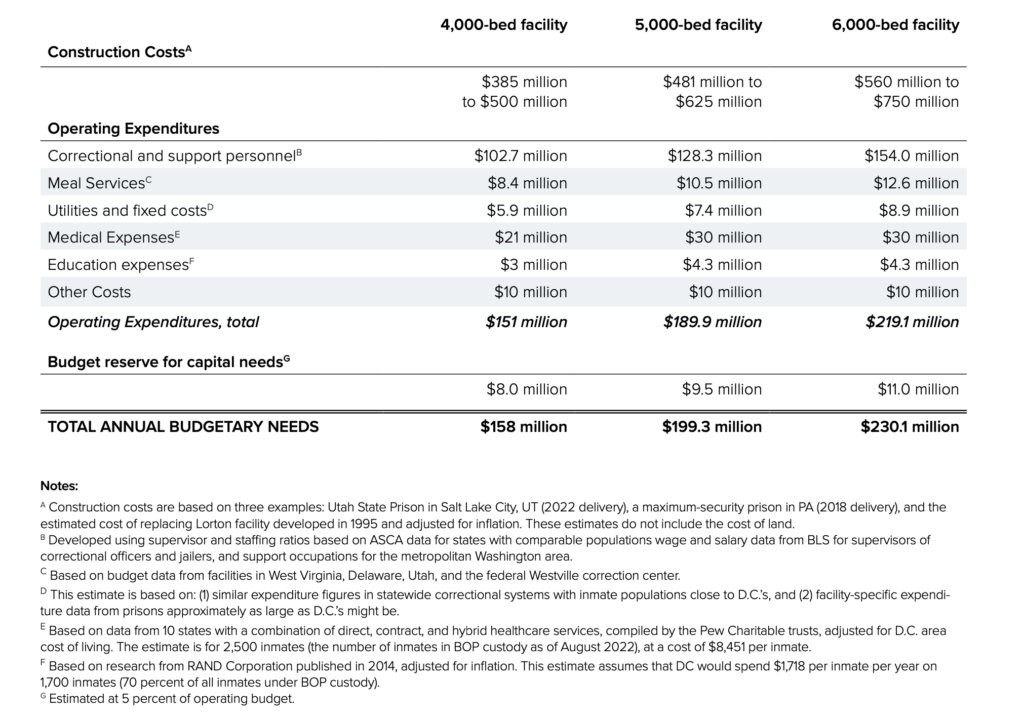
Our research suggests that building a new prison for 4,000 to 6,000 inmates could cost between $400 million and $750 million. The annual operating costs for such a facility would range between $180 million and $230 million.
About this series
This publication is part of the D.C. Policy Center’s Criminal Justice Week 2023, which explores various aspects of the District’s criminal justice system. Other publications in this series include:
- How D.C.’s criminal justice system has been shaped by the Revitalization Act
- Processing through D.C.’s criminal justice system: Agencies, roles, and jurisdiction
- A look at who is incarcerated in D.C.’s criminal justice system
- Map of the week: Where are D.C. Code offenders housed today? (forthcoming)
These publications are adapted from The District of Columbia’s Criminal Justice System under the Revitalization Act: How the system works, how it has changed, and how the changes impact the District of Columbia, commissioned by the District’s Criminal Justice Coordinating Council.
Today, thanks to the Revitalization Act, D.C. Code offenders serving terms of more than one year are incarcerated by the U.S. Bureau of Prisons. If the District were to take back responsibility for all D.C. Code offenders,1 it would have to build a new prison and operate it.
The cost of a new prison system would be highly dependent on the level of programing and other policy decisions the District makes, including the type of facility the District chooses to invest in, the policies it adopts in running the prison, and policies related to how the District builds the prison.
Options available to the District
One path open to the District of Columbia is to build a unified system for the entirety of its incarcerated population—including a state prison, a jail, Correctional Treatment Facility (CTF), and halfway homes. Six other states with populations similar to D.C.’s have such systems, including Alaska, Connecticut, Delaware, Hawaii, Rhode Island, and Vermont.2 This would allow city could leverage the Department of Corrections’ (DOC) existing budget, existing facilities, and even settle on policies that reduce the number of incarcerated D.C. residents.
The District could also choose, in the short term, to contract with nearby states and pay a daily fee for each incarcerated resident. However, if one goal of taking over the control of the prison system is to bring incarcerated people close to D.C., this option offers limited opportunities, given the limited availability of beds nearby: There are only 74 unfilled beds across Maryland and Virginia no longer appears to contract with other states.3 If the District were to lease these beds to house incarcerated D.C. residents, it would likely have to spend at least $35,791 per inmate per year or $2.65 million for all available beds.4 The next best alternative available to D.C. is West Virginia, which already houses the largest share of incarcerated D.C. residents.
To provide services to D.C. Code offenders and keep them close to the District, D.C.’s best option is to build a prison for incarcerated residents currently in Bureau of Prison (BOP) custody.
How large would the new prison need to be?
An important factor that would significantly impact costs is the size of the prison. At present, the total number of incarcerated D.C. Code offenders, including those in Central Detention Facility (CDF), CTF, and under BOP custody, or in halfway homes is approximately 5,200. This number has been declining over the years—it was over 8,000 in 2012—largely due to the reduction of the number of inmates under BOP custody, which itself has been driven by lower levels of violent and serious crime.
Further, as noted elsewhere, different sentencing guidelines adopted under statehood and a system that delivers less punitive parole decisions than currently handed out by USPC could significantly reduce the number of incarcerated residents, bringing the total incarcerated population to under 4,000.
For these reasons, this report will provide a range for estimated costs: one alternative with 4,000 beds and another with 6,000 beds. When possible, the estimates also include per bed costs.
Operating costs
Examples from other states suggest that the cost of building a new prison for 4,000 to 6,000 inmates could range between $400 million and $750 million. The annual operating costs for such a facility would range between $180 million and $230 million depending on the capacity.
To compare, the annual budget for the entire DOC including the expenditures for the two facilities it operates is approximately $180 million. Of this amount, about 20 percent is allocated to functions related to agency management, and the rest are directly spent on costs associated with incarceration.
This means that if the District builds a new facility that houses all incarcerated residents, including the current residents at the CTF and CDF, approximately $140 million of existing DOC budget can be used to pay for the operating costs of the new prison. This would cover somewhere between 65 to 85 percent of operating costs, but create two to three times the current capacity under DOC.
Estimated costs of operating a prison for the District of Columbia
Construction expenses
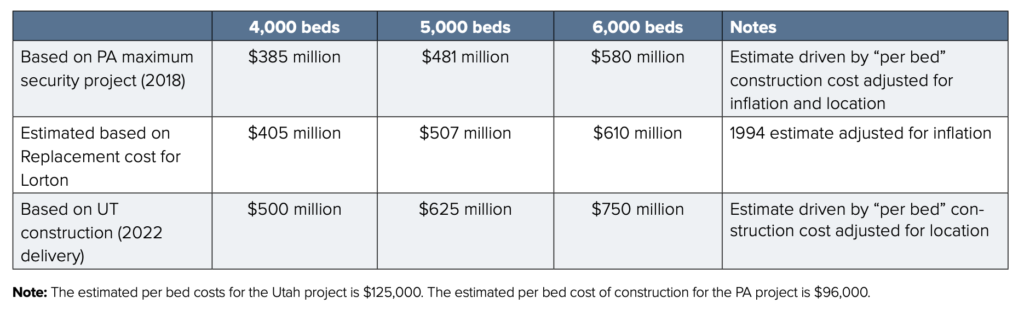
It is difficult to estimate the construction costs of this prison without any specific plans, but recent experience from other states show that these costs are substantial.5 When Congress began exploring closing the Lorton Prison and replacing it with a new one in 1995,6 one study from that time estimated that it would cost the District at least $300 million to build a new prison with a capacity of 5,000 beds, provided that the city can find free land.7 In today’s dollars, this would be $507 million.
Data from more recent prison construction projects show that the costs might be much higher than what was envisioned in 1995. Recently built prisons have generally integrated enhanced recreational amenities (gyms, classrooms, etc.) and modern technologies (keyless locks, etc.), raising construction costs.
One such example is the Utah State Prison in Salt Lake City, UT, which is expected to be completed in 2022. This is a facility with a planned bed capacity of 3,600.8 It is estimated to cost $592 million to construct, and the state is also paying $100 million to purchase the land.9 Project information suggests that construction costs are approximately $125,000 per bed. This would imply that a 4,000-bed facility would cost approximately $500 million to construct and a 6,000-bed facility would cost $750 million, when adjusted for the higher labor costs in the D.C. area.
Another example is the recently completed maximum security facility in Collegeville, PA, which has a bed capacity of 3,830 and cost the state of PA $350 million to construct (excluding the cost of land, which was $50 million). The PA construction costs suggest that replicating the project for a 4,000-bed facility would require $385 million and for a 6,000-bed facility, the cost would be $580 million. We estimate that the District would need to allocate $500 to $750 million to pay for the construction of a prison.
Estimated cost of construction for a new state prison, excluding land
Operating expenses
A prison will require ongoing operational expenses related to prison programs, ranging from healthcare to education. Expense predictions presented in this brief draw on cost data from: (1) corrections budgets in states with inmate populations comparable to D.C.’s,10 and (2) budgets specific to correctional facilities approximately as large as D.C.’s might be. This cost estimate falls within the range of corrections expenditure figures from states with comparable inmate populations.
Some operating costs would depend on the prison capacity and whether the District unifies the city jail, the Correctional Treatment Facility, and a state prison in a single building.11 These include the costs associated with staffing of correctional officers and day-to-day needs of individuals such as meals and uniforms.
Other operating costs would largely be driven by need. For example, health care services will likely be more targeted towards the state-prison population who would return from BOP custody to DOC custody under statehood. The current jail population would also need health services, but given that their average stay in D.C. jail is 31 days, this population would not be the main recipient of health (and especially mental health) services beyond what is already provided by DOC. Similarly, education services would largely target the longer-term population.
Staffing and personnel expenses
Across state prison systems, personnel expenses (excluding personnel related to medical care)—including salaries, overtime, and benefits —make up more than two-thirds (68 percent) of total spending.12 These costs depend on the inmate-to-personnel ratio and will also partly be driven by prison design. Research on other state prison systems shows that the typical inmate to correctional officer ratio could be as low as 3.5-to-1 (Maryland) and as high as 21-to-1 (California).
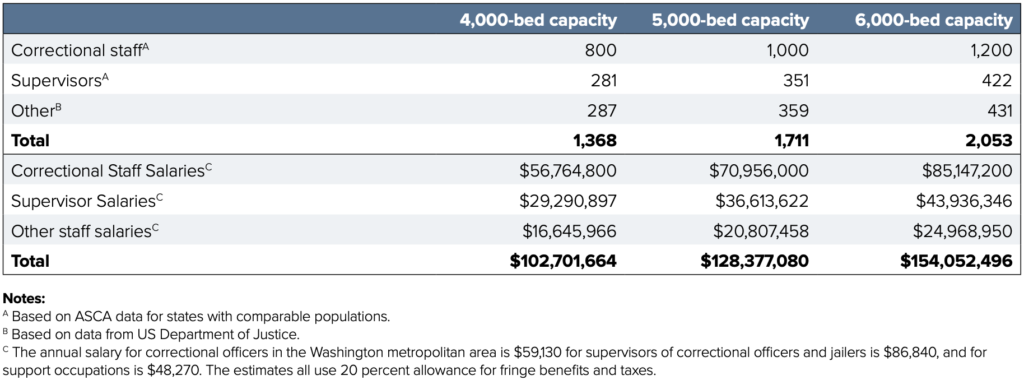
The nationwide average is 6.4-to-1 for correctional officers.13 However, this ratio is much lower—3.7—in states with inmate populations most comparable to D.C.14 Additionally, the prison would have to hire other non-correctional personnel.15 These ratios suggest that the District might have to hire anywhere between 1,368 and 2,053 employees for a new prison, including correctional officers, supervisors, and other employees that would fill support roles.
Based on the salaries that these occupations command in the region, the total personnel costs could range anywhere between $103 million and $154 million. These estimates are in line with what other states are spending on correctional personnel16 (excluding costs related to medical professionals in states that directly provide healthcare for the correctional system).17
Estimated personnel needs and cost (excluding healthcare providers) in the new prison
Healthcare expenses
All state prison systems provide healthcare services— including mental and behavioral care18—but each system organizes services differently. Some have in-house programs with paid staff and directly provide healthcare, others contract this function out, and others use a hybrid system.
Healthcare expenses include costs of compensating of medical professionals, equipment, and residential and continuing care initiatives such as substance abuse programs.19 The funding for these services can be also scattered around state budgets, recorded sometimes in correction agency budgets and other times in mental health or health department budgets.
An examination of these different arrangements for states with comparable prison populations suggest
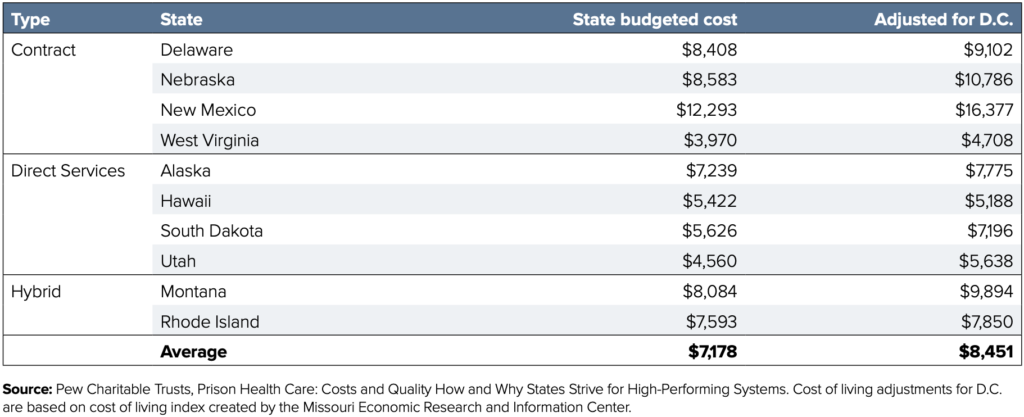
that states spend as little as $3,970 per year per inmate (West Virginia), and as much as $12,293 per inmate (New Mexico) on healthcare in prisons. The average cost of healthcare for the group is $7,178 per inmate per year.
However, many of these locations have lower costs-of-living than the District of Columbia. Adjusting these costs for the relatively higher cost in the area produces a per inmate annual cost estimate of $8,451. It is important to note that not all populations will have similar healthcare needs, especially if the District chooses a unified system that combines a jail with a prison.
Estimated cost of healthcare per inmate per year
If the main recipients of health care services are long-term incarcerated residents, which now stands at approximately 2,500, then the annual spending on health care will be approximately $21 million. This number could decline if the revised criminal code or a new parole board results in fewer incarcerated residents. It could also be higher if the health care needs of incarcerated D.C. residents are greater than the needs of prison populations in other states.
Educational expenses
In 2016, the U.S. Department of Education reported that over 70% of U.S. inmates wanted to pursue academic programs in 2014.20 While all did not ultimately enroll, the District would do well to offer educational options to as many interested inmates as possible. As the RAND Corporation noted in 2014, correctional education reduces recidivism; dollars spent on education in prison are dollars saved on reincarceration.21
D.C. could anticipate yearly educational programming expenses of roughly $3 million to meet the needs of its longer-term prison population. This estimate assumes that D.C. would spend $1,718 per inmate per year on 1,750 inmates (70 percent of all inmates under BOP custody). The yearly per-inmate expenditure figure reflects the median of the RAND Corporation’s 2014 estimate that educating an inmate for a year costs, on average, $1,400-1,744, adjusted for inflation.
Dining expenses
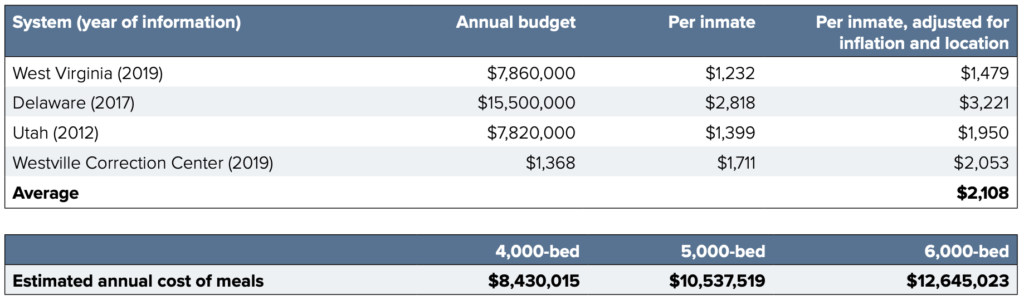
D.C. could anticipate dining services expenses of approximately $2,108 per inmate per year. This would require an annual expenditure of $8.4 million to $12.6 million, depending on the prison population. This estimate is based on: (1) food expenditure figures in statewide correctional systems with inmate populations close to D.C.’s, and (2) facility-specific expenditure data from prisons approximately as large as D.C.’s might be.
The estimate reflects a slight reduction of the average cost obtained using the data below, because the prisons and prison systems listed serve, on average, more inmates than D.C.’s would. The average food expenditure was $8.79 million for a population of 5,202 inmates.22
Estimated costs of meal services
Utilities and other fixed costs
D.C. could anticipate of $5.9 million to 8.9 million for utilities and other fixed costs, excluding capital investments and land related costs. This estimate is based on: (1) similar expenditure figures in statewide correctional systems with inmate populations close to D.C.’s, and (2) facility-specific expenditure data from prisons approximately as large as D.C.’s might be. Average overhead expenditures were $5.9 million for a population of 4,346 inmates.23
Other costs
Prisons incur miscellaneous costs unrelated to those listed above including uniform purchases, employee training, travel, and inmate labor compensation. These expenses vary substantially according to variables such as inmate population growth, employee turnover, and facility wear. For these reasons, as well as due to a dearth of sufficiently disaggregated data from other states, it would be difficult to offer accurate estimates of D.C.’s future expenses. $10 million serves as a placeholder estimate for miscellaneous expenses.
Capital reserve
The District would have to create a capital reserve to meet the longer-term upkeep of its prison. We used in our estimates a capital reserve equal about 5 percent of annual operating budget.
Conclusion
If the District were to take control of its criminal justice system, it would need to build and maintain a prison system. The estimates presented here are based on projects in other states with comparable incarcerated populations, adjusted for regional wages and prices. However, the actual costs of a prison would be dependent on several policy choices including the level of programing, the type of facility the District chooses to invest in, and how the District builds the prison. Information about D.C.’s current criminal justice system including programming, location, and security level of D.C. Code offenders in Bureau of Prison custody can be found in the main text of our report.
Endnotes
- Most D.C. Code offenders are D.C. residents, but also include people who do not live in D.C. but have been convicted of crimes in the District.
- Thigpen and Hutchinson, “A Review of the Jail Function within State Unified Corrections Systems.”
- Green, F. “Va. Accepts Prisoners from Virgin Islands under Old Contract.”
- Maryland’s correctional system has about 74 unfilled beds, all located at the medium-security Eastern Correctional Institution in Westover. Given current per- inmate expenses at that facility ($35,791 per inmate per year), to rent all 74 unfilled beds would cost at least $2.65 million yearly.
- This number of beds is based on current averages. It is possible with a different court and parole system that the average number of residents will decrease.
- U.S. Congress, “H.R. 461, Closing of Lorton Correctional Complex: Committee on Government Reform and Oversight .”
- Bureau of Justice Assistance, “Emerging Issues on Privatized Prisons.”
- Carlise, “New Utah Prison Is Running about 20% over Budget, 18 Months behind Schedule, and Will Hold Fewer Inmates than Planned.”
- DCFM, “Prison Development Budget.”
- The following states were considered whenever data was available. Inmate population figures are based on 2015 Pew estimates from Huh et al., “A Report from Prison Health Care: Costs and Quality How and Why States Strive for High-Performing Systems.”: Alaska: 5,997 inmates; Delaware: 6,860 inmates; Hawaii: 5,669 inmates; Montana: 4,591 inmates; Nebraska: 5,380 inmates; New Mexico: 6,996 inmates; Rhode Island: 3,182 inmates; South Dakota: 3,588 inmates; Utah: 6,973 inmates; West Virginia: 6,912 inmates
- While this is the most cost-effective solution, it is possible that separate prison and jail facilities would break up criminal networks and thus be more desirable as a system.
- Mai and Subramanian, “The Price of Prisons: Examining State Spending Trends, 2010-2015.”
- Association of State Corrections Administrators, “ASCA Responses: Staff to Inmate Ratio Survey.”
- Inmate-to-security officer ratios: Delaware: 3.7, Nebraska: 4.1, New Mexico: 2.9, West Virginia: 4.5, Rhode Island: 3.4, Montana: 3.6. The average security officer-to-inmate ratio among these states is 3.7.
- Zeng, “Jail Inmates in 2016.”
- Personnel expenses include salaries & overtime, as well as benefits and other expenses tied to prison employees.
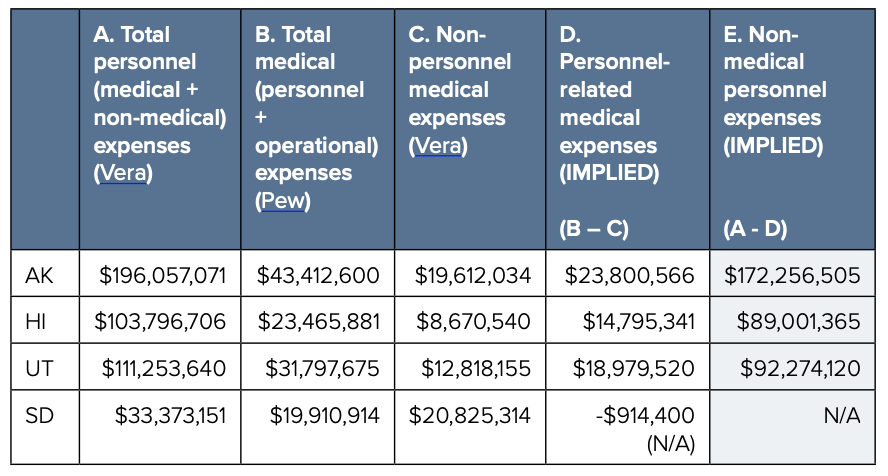
- It is important to note that this excludes healthcare personnel. Some states directly provide medical care, and Vera includes public medical professionals’ salaries and benefits within total personnel expenses. To isolate the expenses tied to salaries and benefits of non- medical public employees, the following calculations were made: 1. Subtracting Vera’s estimates of non-personnel- related medical expenses (column C) from Pew’s estimates of total medical expenses in those states (column B), to obtain personnel-driven medical expenses (column D). 2. Subtracting personnel-driven medical expenses (column D) from Vera’s estimate of total expenses related to public employees (column A).

Expense estimates offered by Vera and Pew are inconsistent, which prevented meaningful calculation. Based on this we estimate the following spending: Alaska: $172.2 million; Hawaii: $89 million; Utah: $92.3 million; Delaware: $131.6 million; New Mexico: $106.4 million; West Virginia: $99.9 million.
- Mental and behavioral health programming, which includes services ranging from psychiatric care to substance abuse treatment, is highly varied across the US. In designing its own service plans, D.C. could consider the following policies which have proven successful in other facilities: Respectful treatment of inmates, facilitated by highly educated staff and low staff-to-inmate ratios; Opportunities for community engagement, ranging from peer mentorship to membership on a resident committee that provides feedback to facility administrators; Promotion of inmates’ engagement with family members and community members outside of prison; Provision of reentry planning services; Implementation of positive incentives for good behavior and self-improvement; Preventing sustained vacancies in staff positions and maintaining diverse staff corps; Creating varied and flexible treatment plans, allowing patients access to group and individual treatment plans with appropriate levels of confidentiality; Reinforcing communication between doctors and patients, and improving patients’ awareness of their own treatment plans; Expanding extracurricular programming; Ensuring inmates’ access to high-quality amenities, such as libraries and commissaries; Using body cameras to increase behavioral accountability among both staff and residents; Ensuring stable and continuous care for inmates entering and leaving the facility
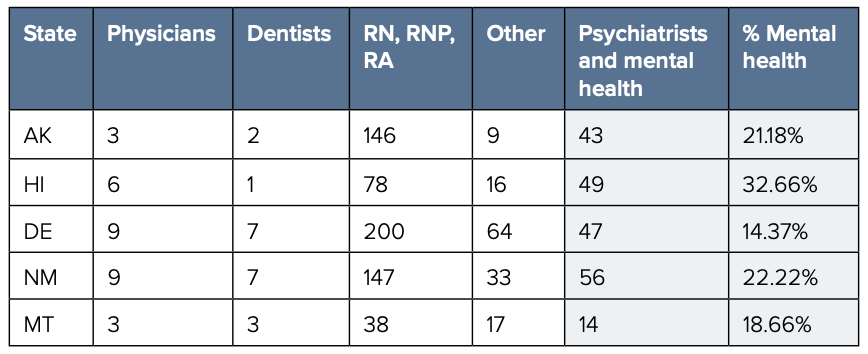
- Among the subset of these states offering Pew detailed employment breakdowns, mental healthcare providers held, on average, 22% of full-time medical provider positions.
- Rampey and Kieper, “Highlights from the U.S. PIAAC Survey of Incarcerated Adults: Their Skills, Work Experience, Education, and Training: Program for the International Assessment of Adult Competencies: 2014.”
- Davis et al., How Effective Is Correctional Education, and Where Do We Go from Here? The Results of a Comprehensive Evaluation.
- Food expenditures for selected statewide correctional systems: West Virginia state (6,830 inmates): $7.86 million (2019); Delaware (5,500 inmates): $15.5 million (2017); Utah (5,590 inmates): $7.82 million (2012). Facility-specific food expenditures: Westville Correctional Center (Indiana, 2,889 inmates): $3.98 (2019)
- General operational expenditures for statewide correctional systems: West Virginia state (6,830 inmates): $7.62 million (2019). Figure listed as specifically pertaining to “utilities”.; Delaware state (5,500 inmates): $8.3 million (2017). Figure listed as specifically pertaining to “energy”.; Facility-specific operational expenditures: Idaho (ISCC Boise, 2,164 beds): $5.6 million (2019); Indiana (Westville Correctional Center, 2,889 inmates): $2.09 million (2019).