TWO | THE LANDSCAPE OF RENTAL HOUSING IN THE DISTRICT OF COLUMBIA
The District of Columbia is largely a city of rentals. Of the estimated 322,000 housing units (excluding those owned by the federal government, foreign governments, universities, or charitable or religious organizations),[1] 114,550 are occupied by their owners.[2] The remainder—207,400 units, or 64 percent of the housing stock—are potentially rentals.[3]
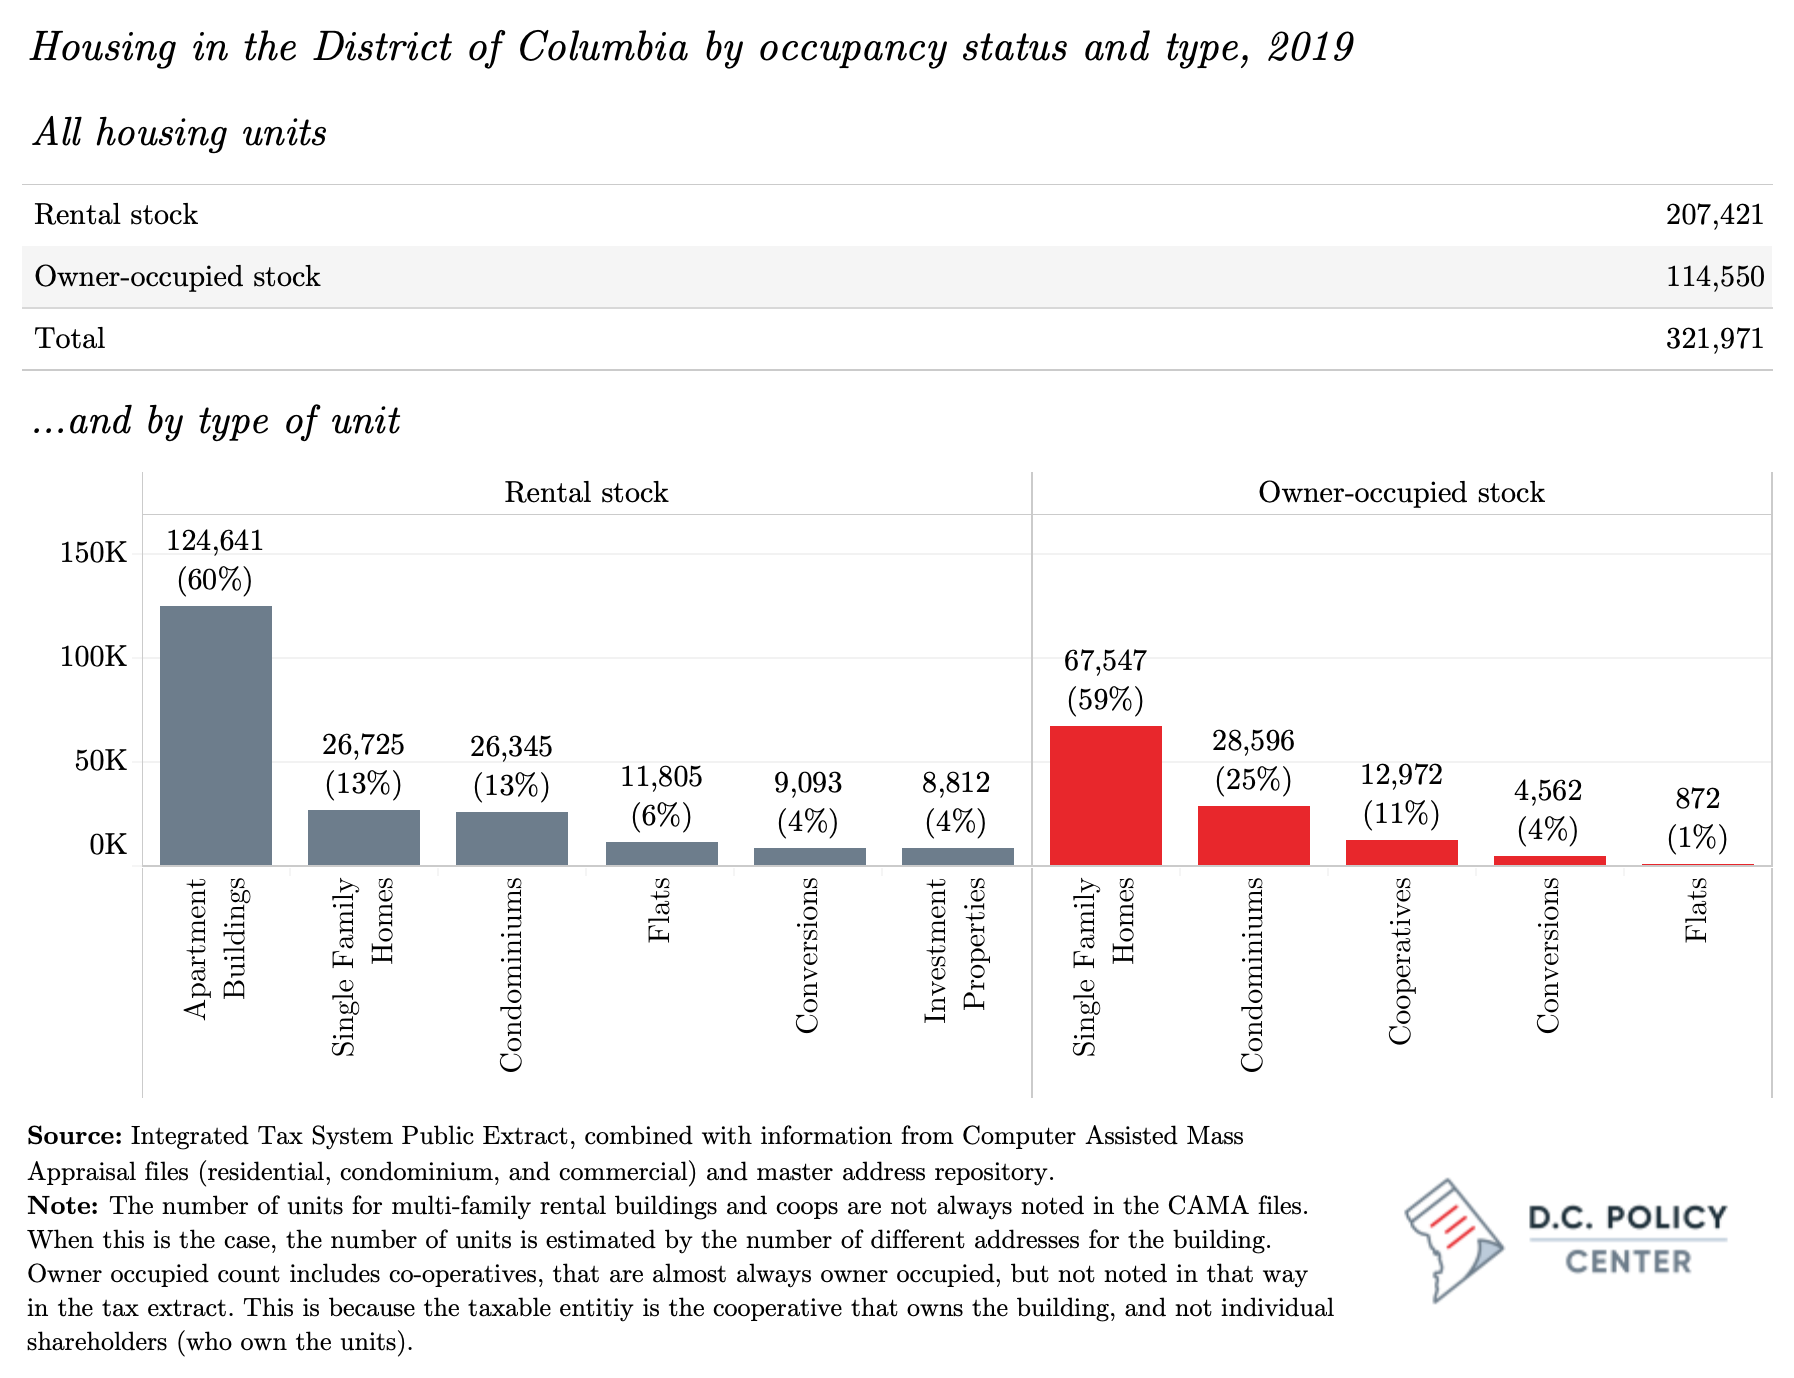
The primary source of rental housing in D.C. is rental apartments, which are income-generating units in multi-family buildings. For these buildings, a single entity owns and (usually) operates the building. A sizeable portion of these units are also subject to the District’s rent control laws, which apply to units in buildings that are older (built or received their building permit before December 31, 1975) and larger (more than four units).[4] Rent control laws restrict rent increases for current tenants and limit the use of evictions.[5] For apartment buildings built after 1975 or with four or fewer units, rents are not restricted, though buildings built after 2007 must meet the District’s inclusionary zoning requirements, setting aside a share of their units as affordable.
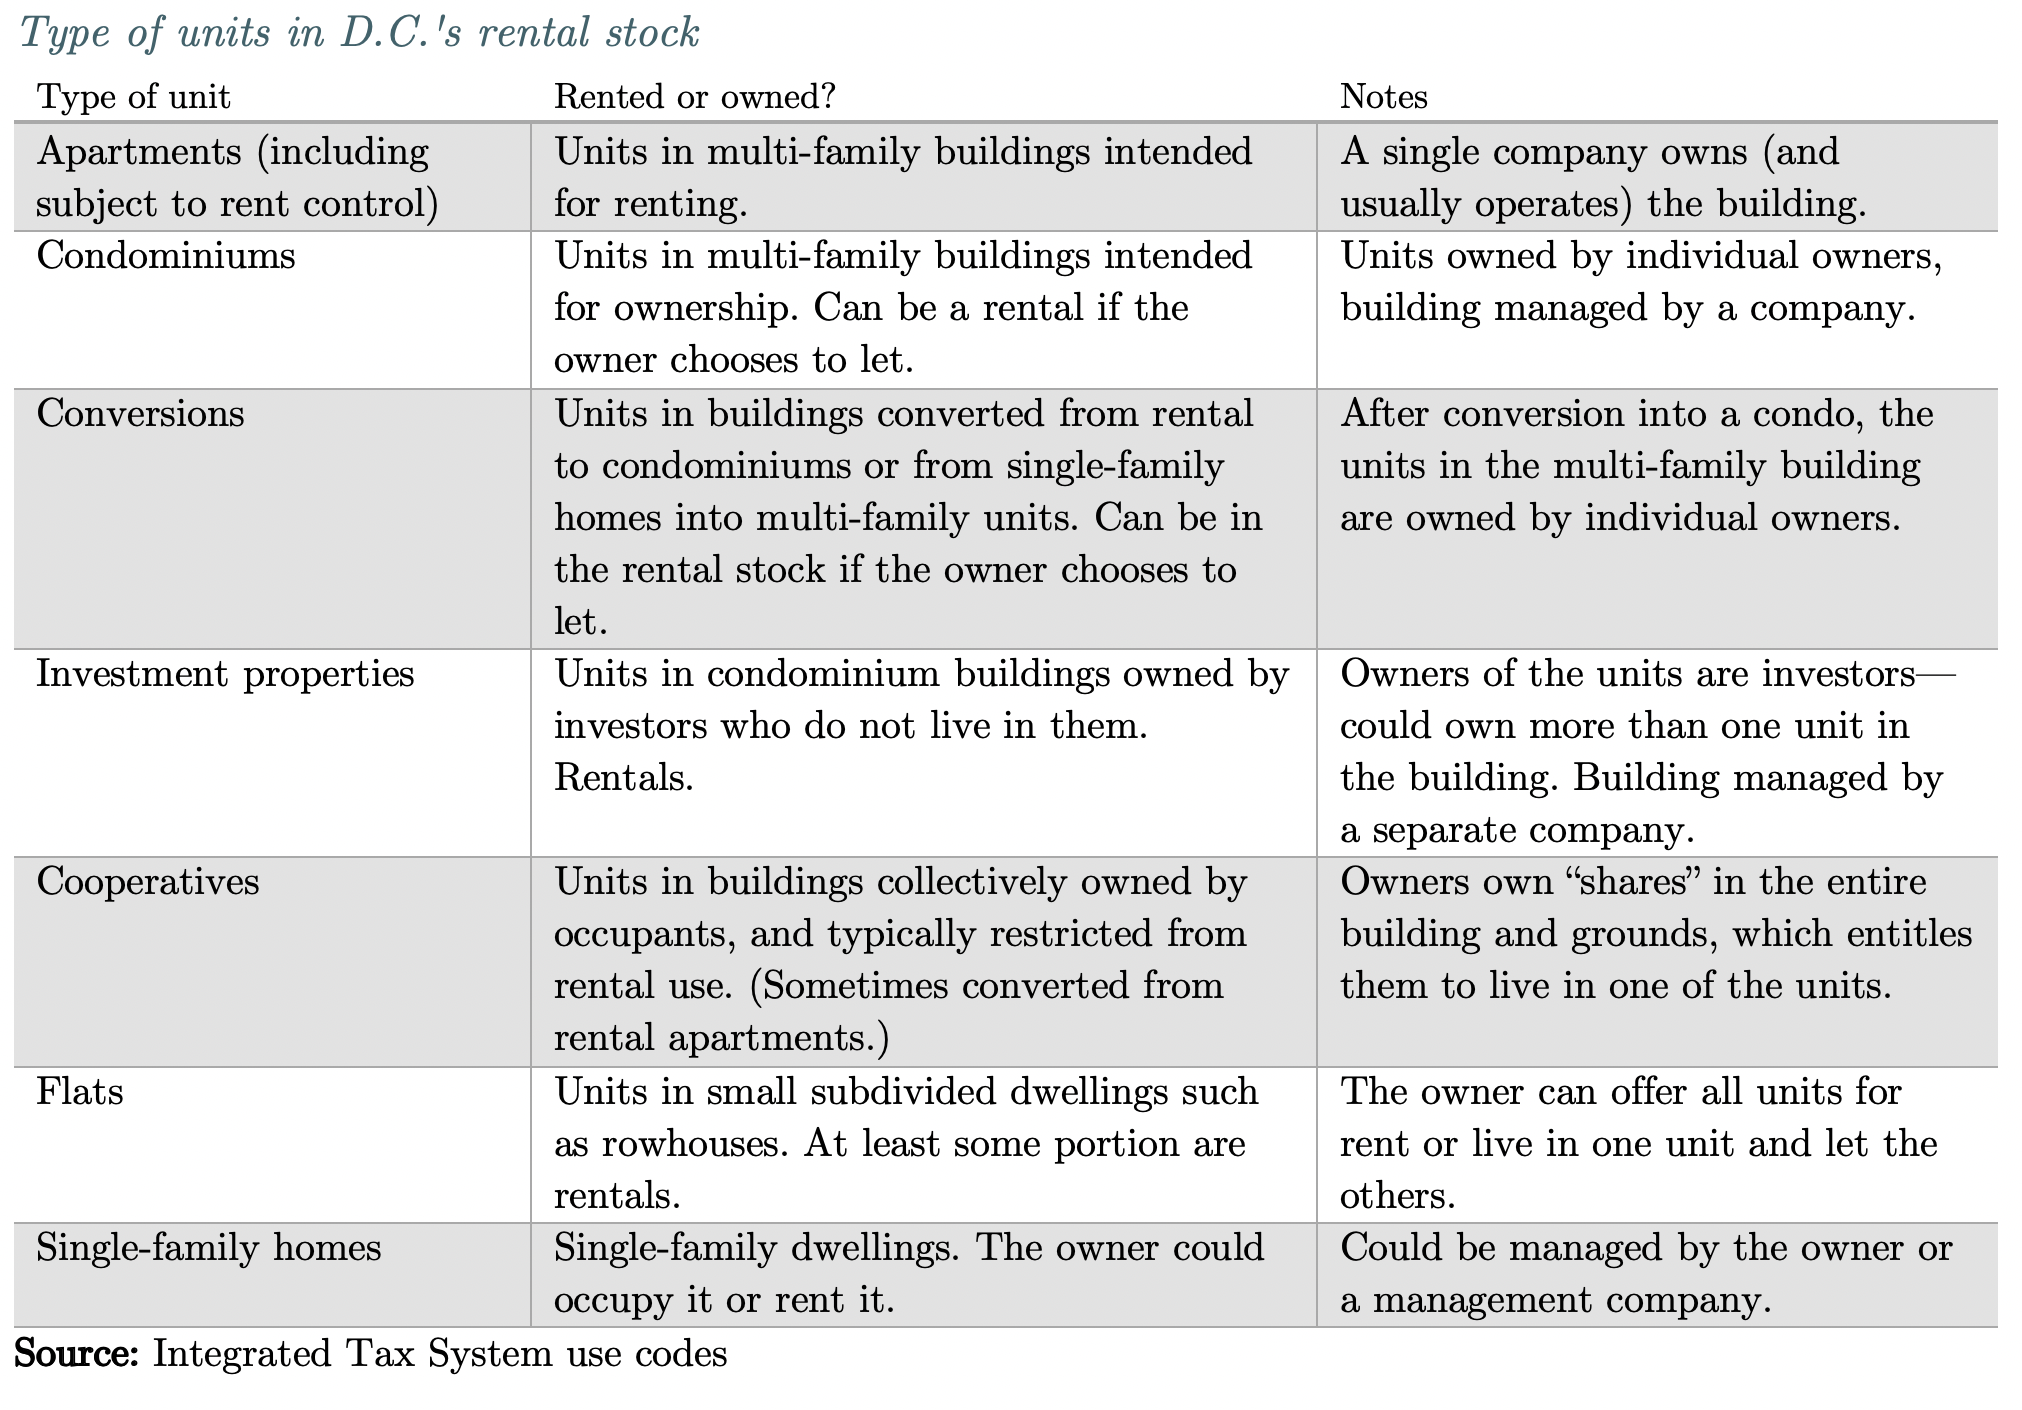
The second source of rentals in the city is the shadow rental market. These are rental units in condominium buildings including investment properties, conversions, flats, and single-family homes. The District also has a small number of cooperative housing units (approximately 4,500 units, or 1.5 percent of the overall stock) where owners own “shares” in the entire building and grounds, which entitles them to live in one of the units. Cooperatives are not a significant source of rental units in D.C., as their organizational bylaws typically restrict renting of the units.
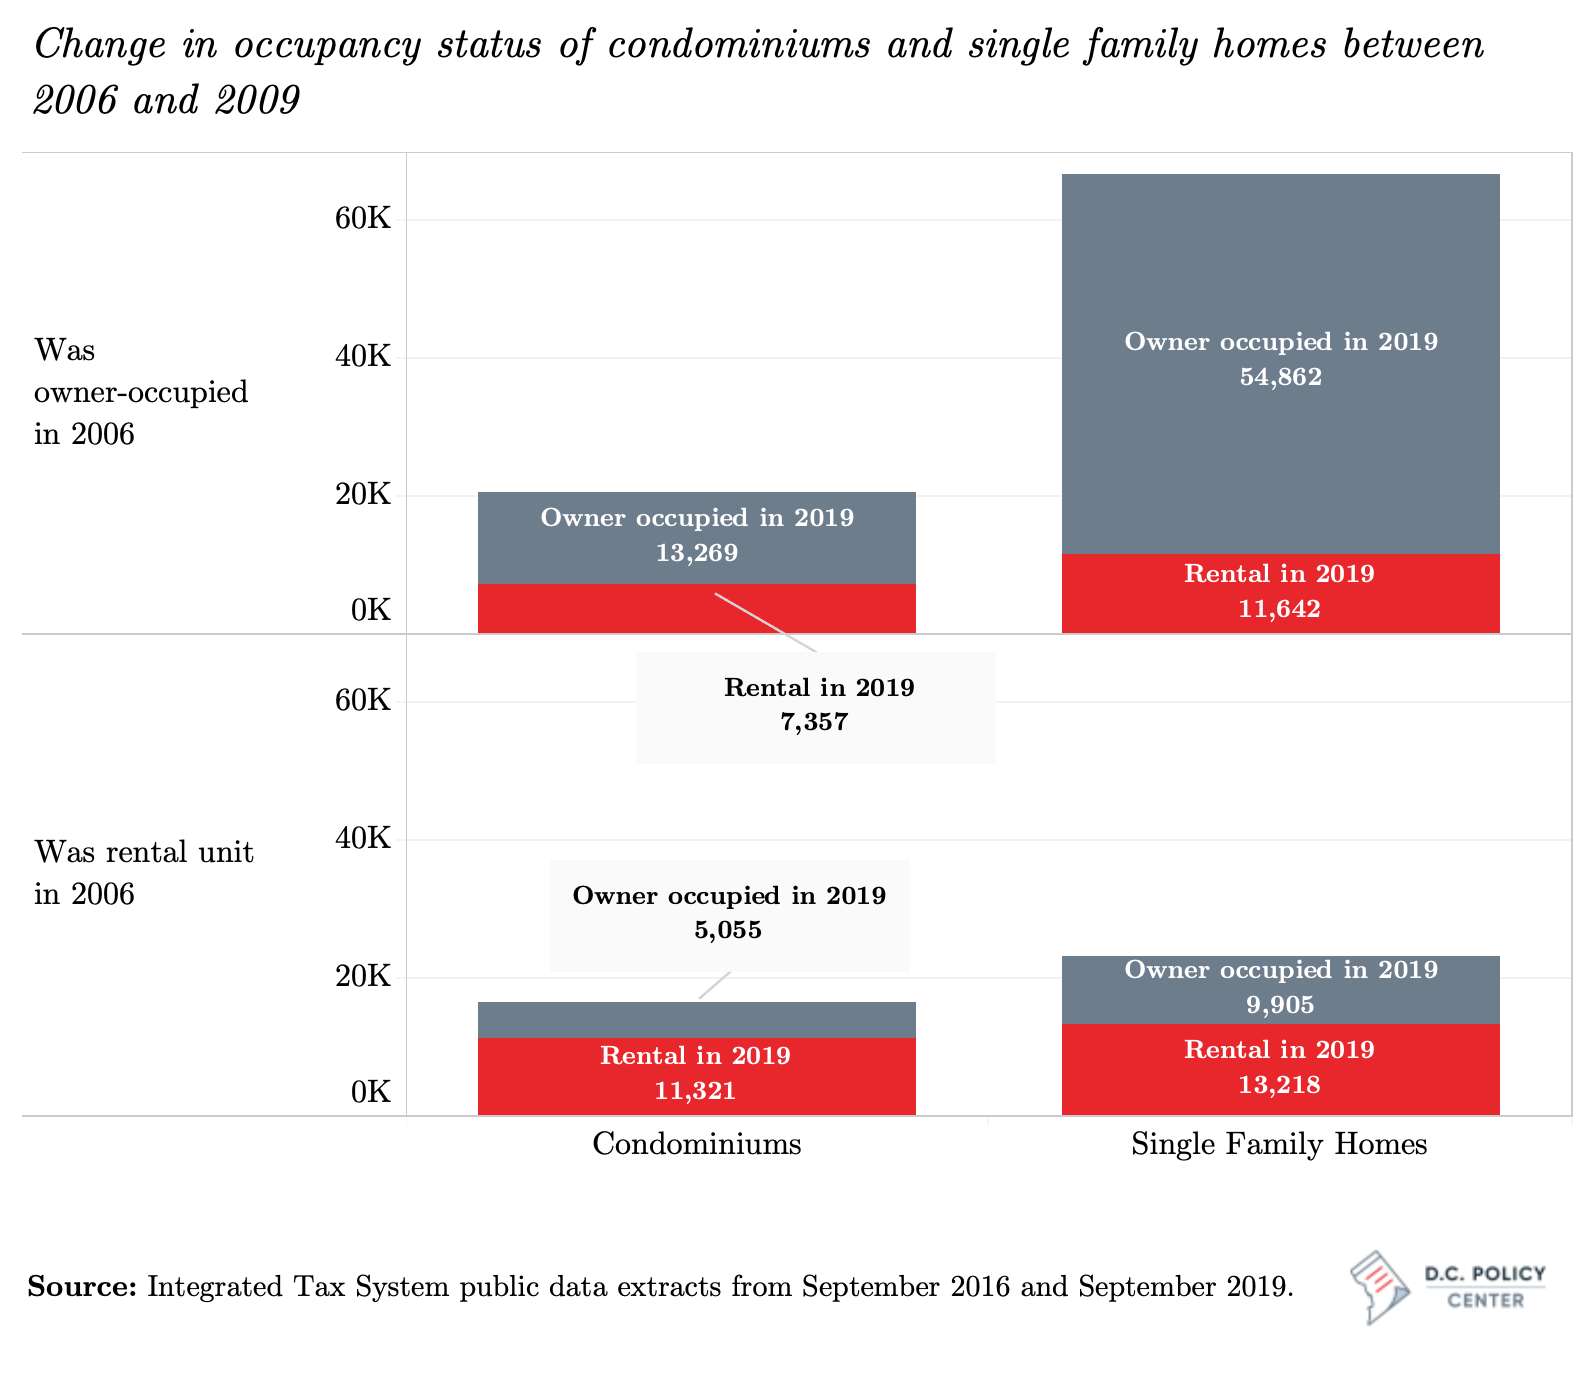
The presence of a large shadow rental market means that units move in and out of the rental stock frequently. We compared tax records from 2006 and 2019 and found 126,000 condominiums and single-family homes that have been continuously on the tax rolls since 2006.[6] Of these, 87,000 were owner-occupied in 2006, but by 2019 approximately 20,000 (more than one in five) had become rentals. Conversely, of the 39,500 condominiums and single-family homes that were rentals in 2006, nearly 15,000 (38 percent) were, as of September 2019, owner-occupied.
Between 2006 and 2019, shadow rental market units have left the rental stock more frequently in Wards 4 and 5 (where 47 percent of condominiums and single-family homes of the combined housing stock in these two wards have reverted to owner-occupancy), and previously owner-occupied units have moved into the shadow rental stock most frequently in Ward 2 (36 percent). Administrative data show that single-family homes are more likely to move out of the rental stock—perhaps making room for the District’s growing families who want to own a house in the city—and condominiums are more likely to move into the rental stock.[7]
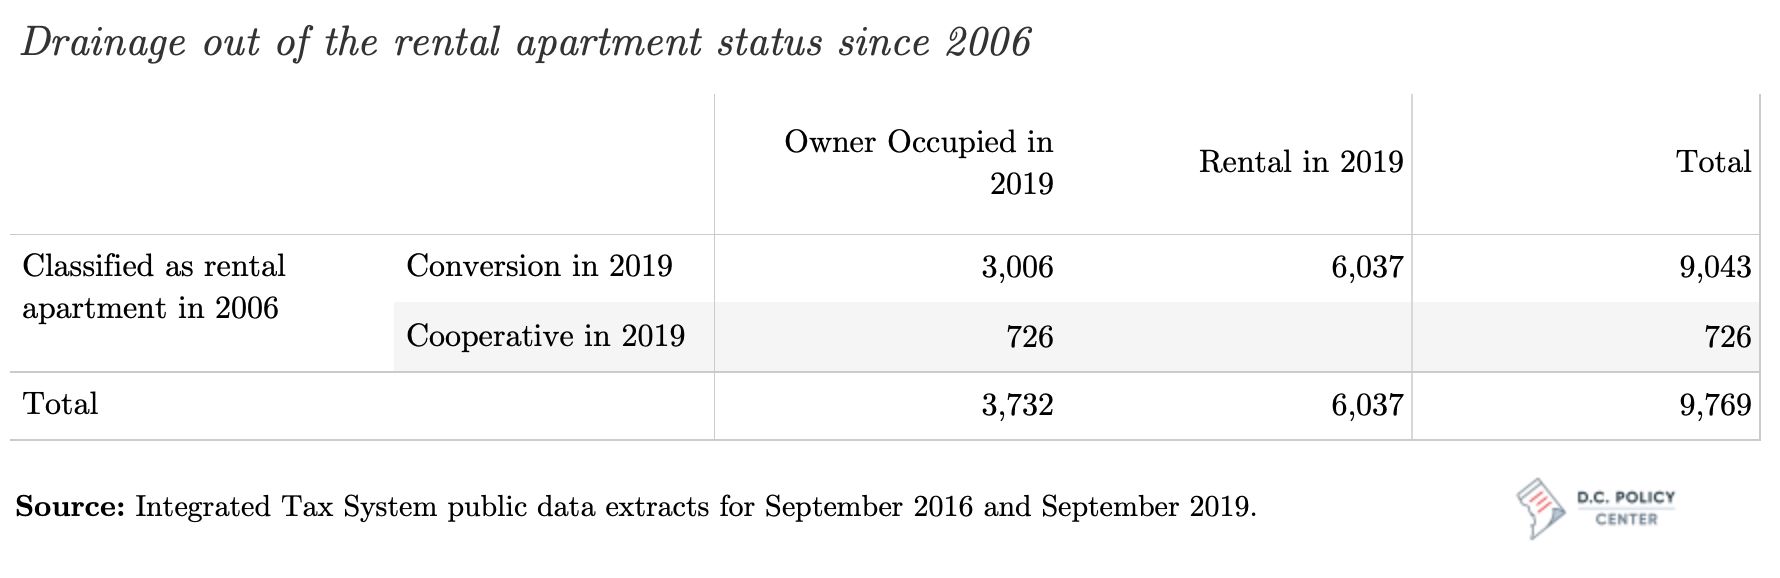
Rental apartment buildings are not entirely resistant to change, either. The core of the city’s rental stock—the 124,600 units in rental apartment buildings—comprise only 60 percent of the total rental stock. Compared to the shadow rental market, units in rental apartment buildings are more stable. In fact, one quarter of today’s rental units are in apartment buildings built before World War II. Many of these are over 100 years old.[8] But some have, and others will eventually be demolished to make room for new development, and yet others will leave the rental stock because they will be converted into condominiums or into a cooperative building. Administrative data suggest that since 2006, about 9,770 rental apartment units have been converted into an ownership structure.[9] Among these, 48 buildings restructured themselves as cooperatives between 2006 and 2009, removing 726 units from the rental stock. The remainder, or about 9,000 units, became condominiums, and of these, one third are now occupied by their owners.
Measured this way, the impact of conversions on the overall rental stock appears to be small. However, excluded from these counts are units on land that has been subdivided or combined, and therefore cannot be reliably tracked through administrative records. In her book, The Politics of Staying put, [10] Professor Carolyn Gallaher estimates that between 2000 and 2007, some 1,147 rental apartment buildings with 26,645 units were converted into condominiums.[11] Some of these units were purchased by their previous tenants under the District’s Tenant Opportunity to Purchase Act (TOPA). But in others, where tenants did not exercise their TOPA rights, or have signed away those rights, the units have often been redeveloped into expensive units with prices the former tenants would not have been able to afford. There is presently no data available to quantify what Professor Gallaher calls “exclusionary displacement” across the entire city, but in her sample of seven buildings that changed ownership through TOPA, she finds that four units out of ten that went through TOPA ended up as units beyond the means of their former low- and middle-income occupants. [12], [13]
Where is the rental housing in the District of Columbia?
Rentals are everywhere in the city, but they are particularly concentrated in Ward 6. Ward 6’s nearly 39,500 rental units account for 69 percent of its housing. Most of these units are relatively new: approximately 21,000 of the 55,100 rental units in this ward have been built since 2000—many in entirely new or revitalized residential neighborhoods such as NoMa, Navy Yard, and most recently, the Wharf at the Southwest Waterfront.
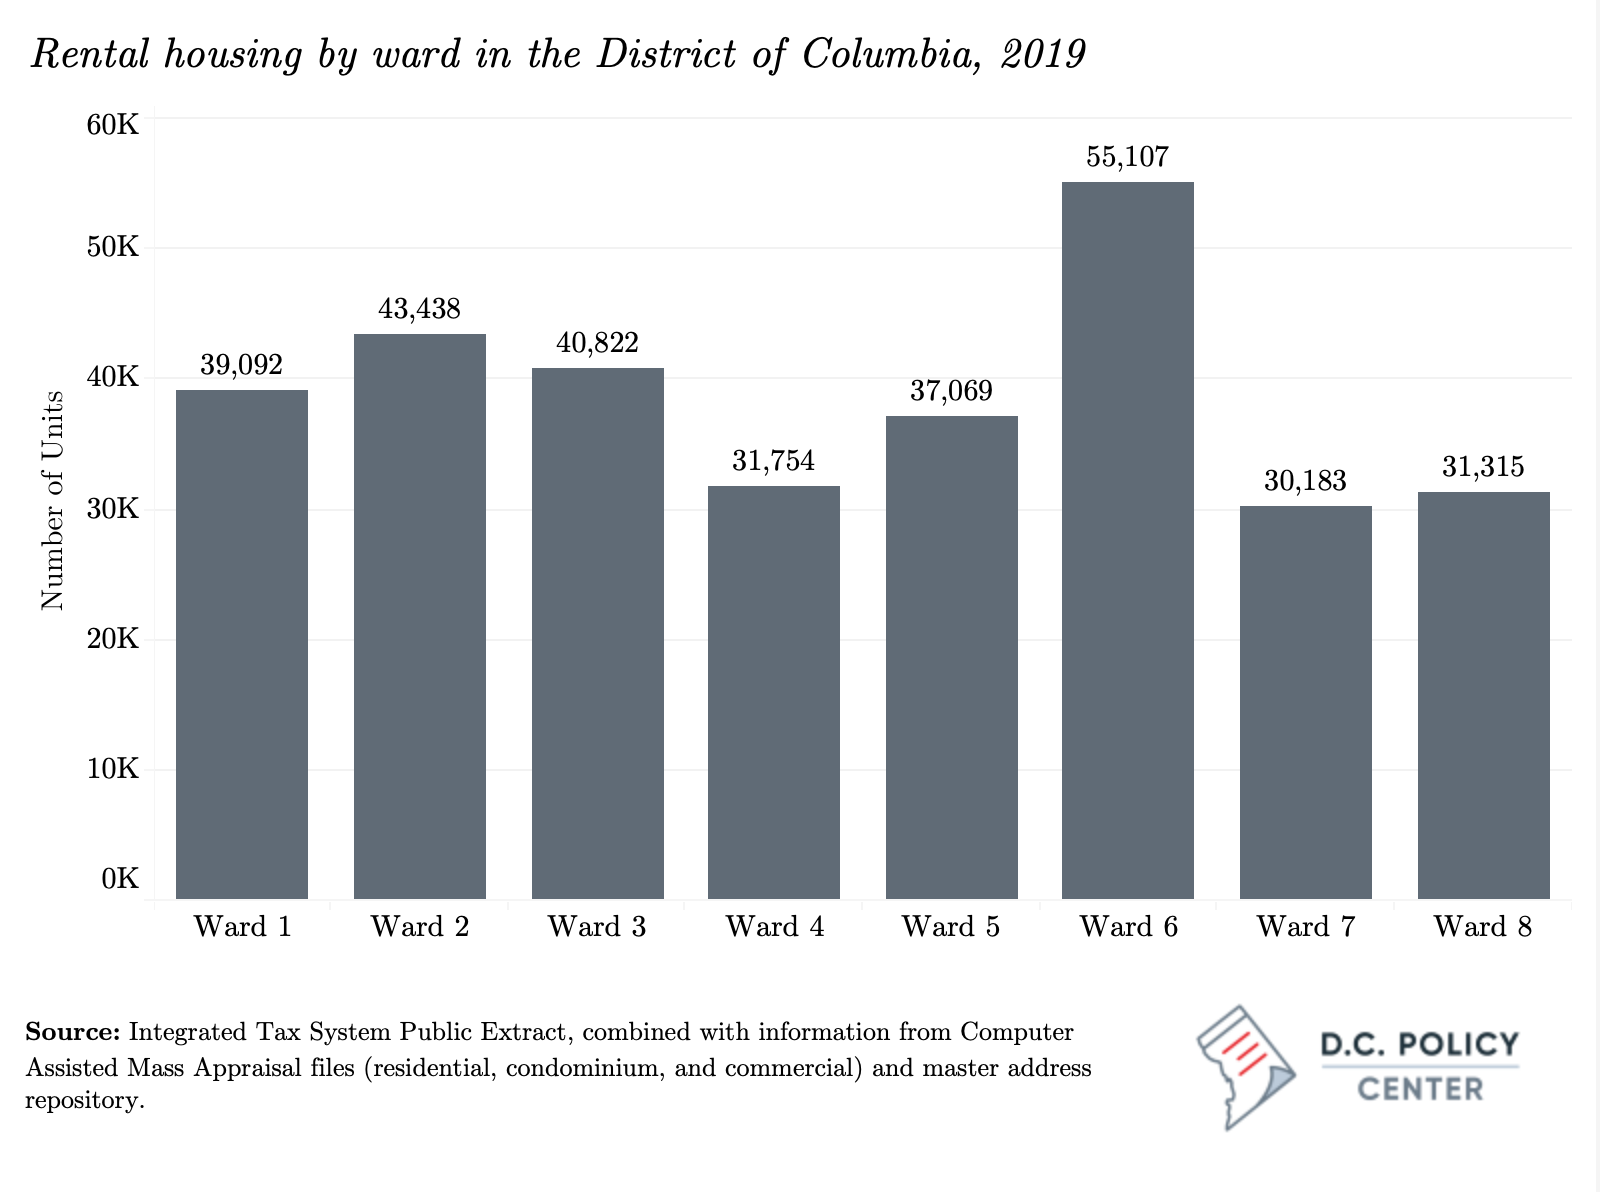
Such a concentration of newly constructed buildings means a smaller share of Ward 6’s rental housing is subject to rent control laws than elsewhere in the city. Rent-controlled units across the city account for 23 percent of housing and 35 percent of all rental units, but in Ward 6, the comparable shares are 8 percent and 12 percent, respectively. Ward 4 has the fewest rental units, because it is largely zoned for single-family housing, and has both fewer housing units and a high home ownership rate (55 percent, compared to the citywide average of 36 percent). Ward 8 also stands out, as its rental stock accounts for 81 percent of all the housing in this ward (only 6,000 units are occupied by their owners in Ward 8), and its rent-controlled stock accounts for 41 percent of its entire housing stock.
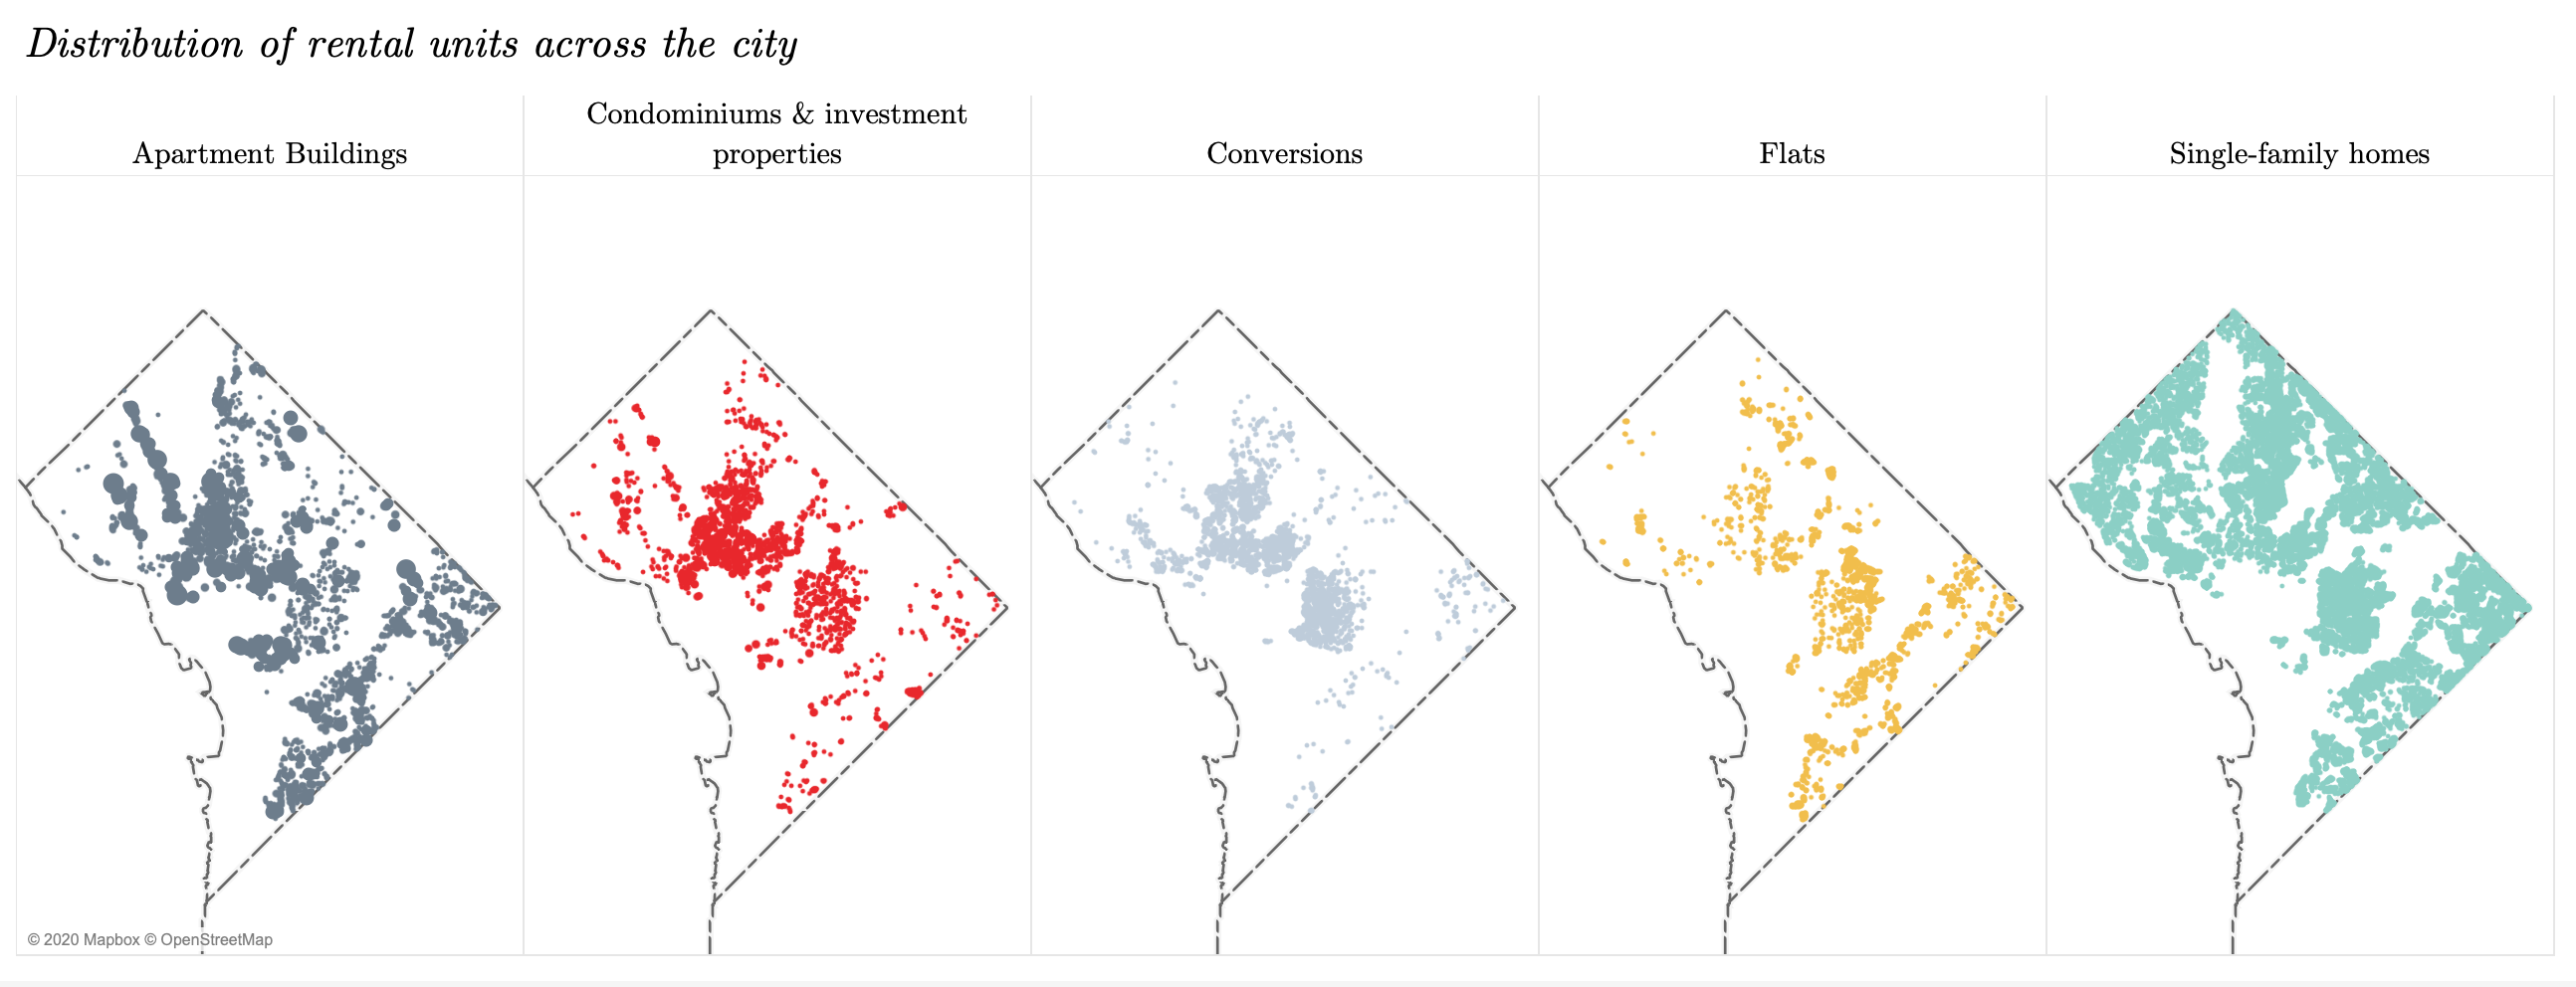
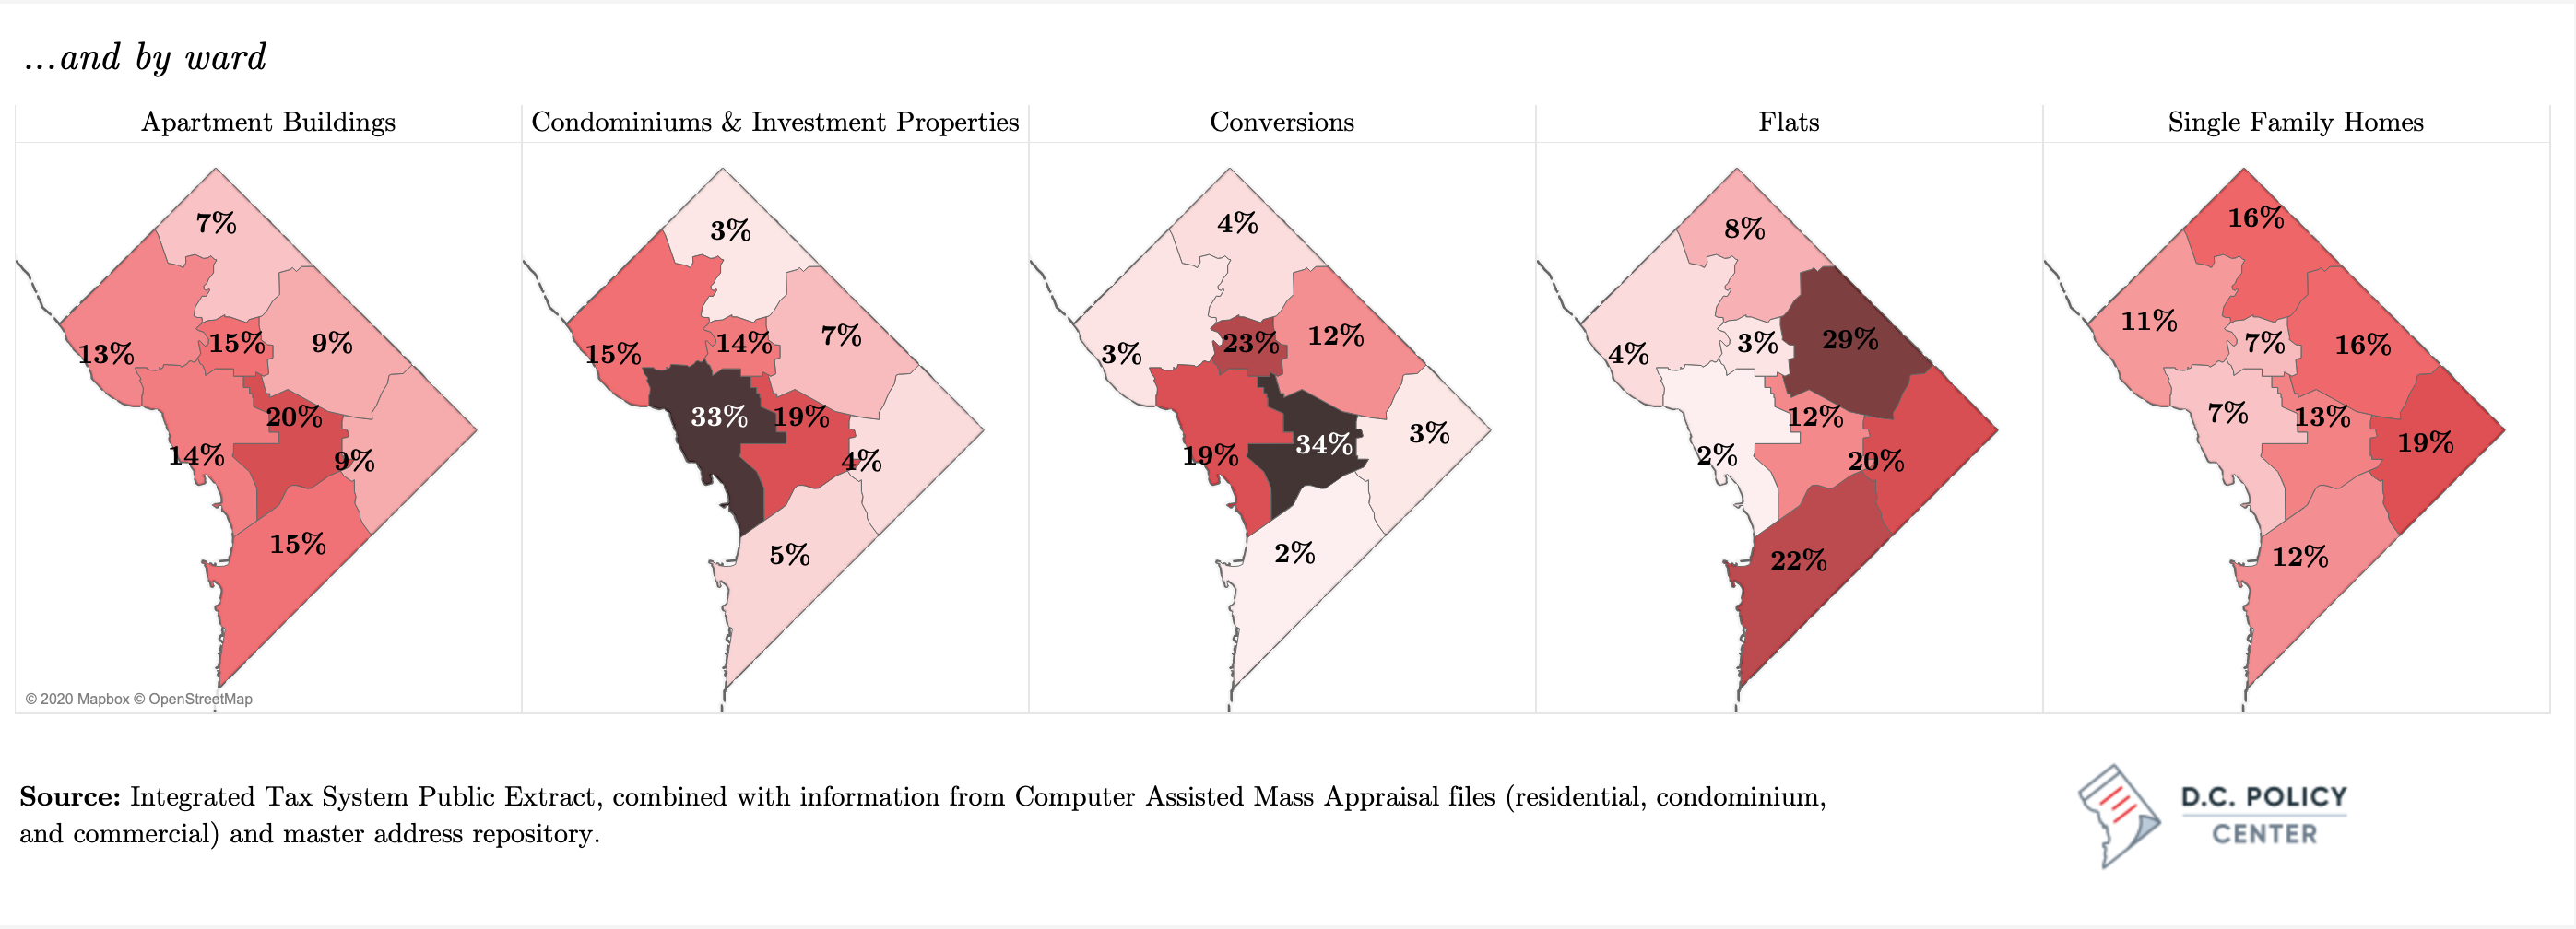
The distribution of rental units across the city largely follows zoning, general development patterns, and the city’s history. Rental apartment buildings are present in every ward across the city but vary greatly in age, type, and other characteristics (such as the size of the building or the units within it). Wards 1 and 8, each, have over 18,000 units in rental apartment buildings, but these are mostly older buildings: dating before World War II in the case of Ward 1, and the period between the mid-1950s and the late 1960s in the case of Ward 8.
The greatest concentration of rental condominiums and investment properties is in Ward 2—an attractive place for the young and affluent. In contrast, across Wards 7 and 8, where incomes are not always high enough to support home ownership, condominiums and conversions account for less than five percent of the housing stock. The approximately 26,000 single-family homes rented by their owners are also spread out—in every ward, at least 20 percent of single-family housing units are rentals. Such rentals are most common in Ward 7 (approximately 5,100 single-family rentals), followed by Wards 4 and 5 (over 4,000 units each).

Characteristics of rental apartments
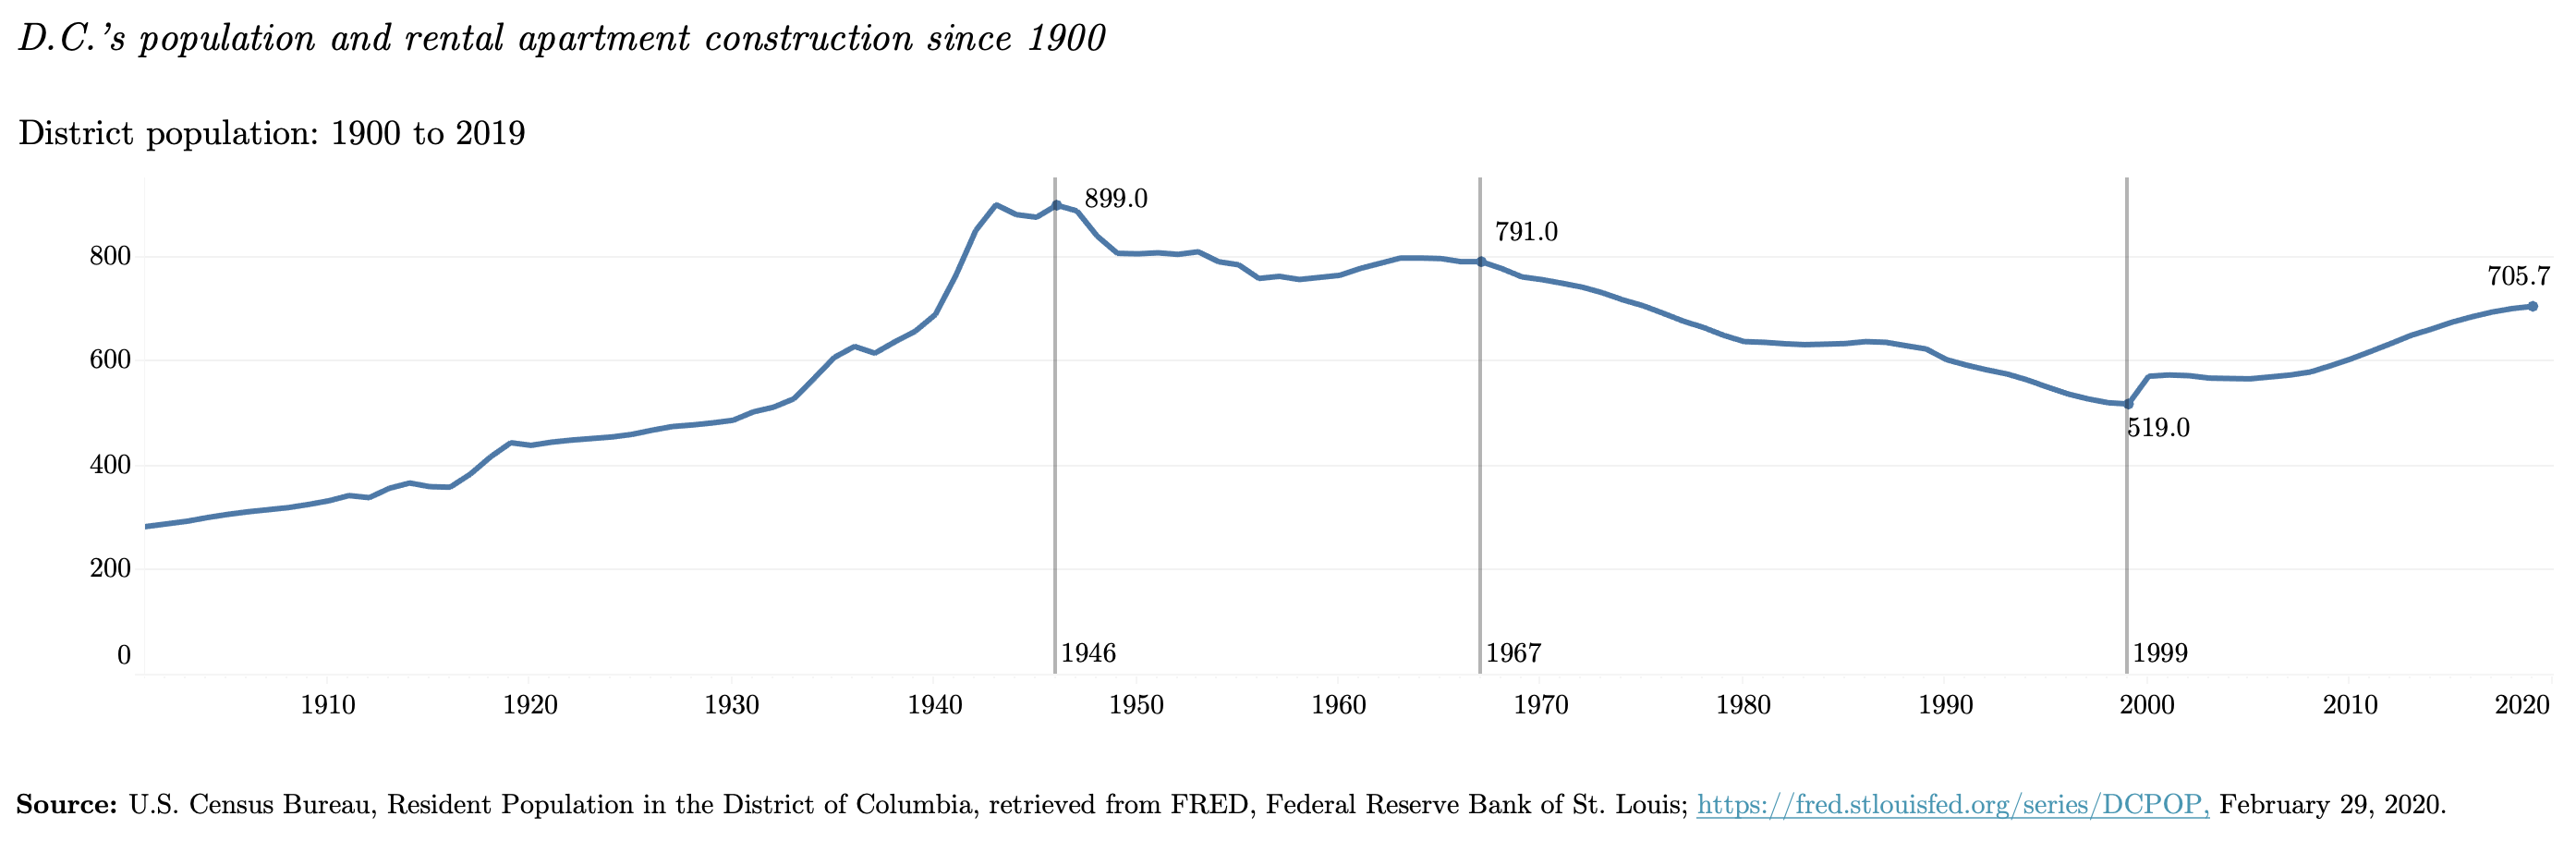
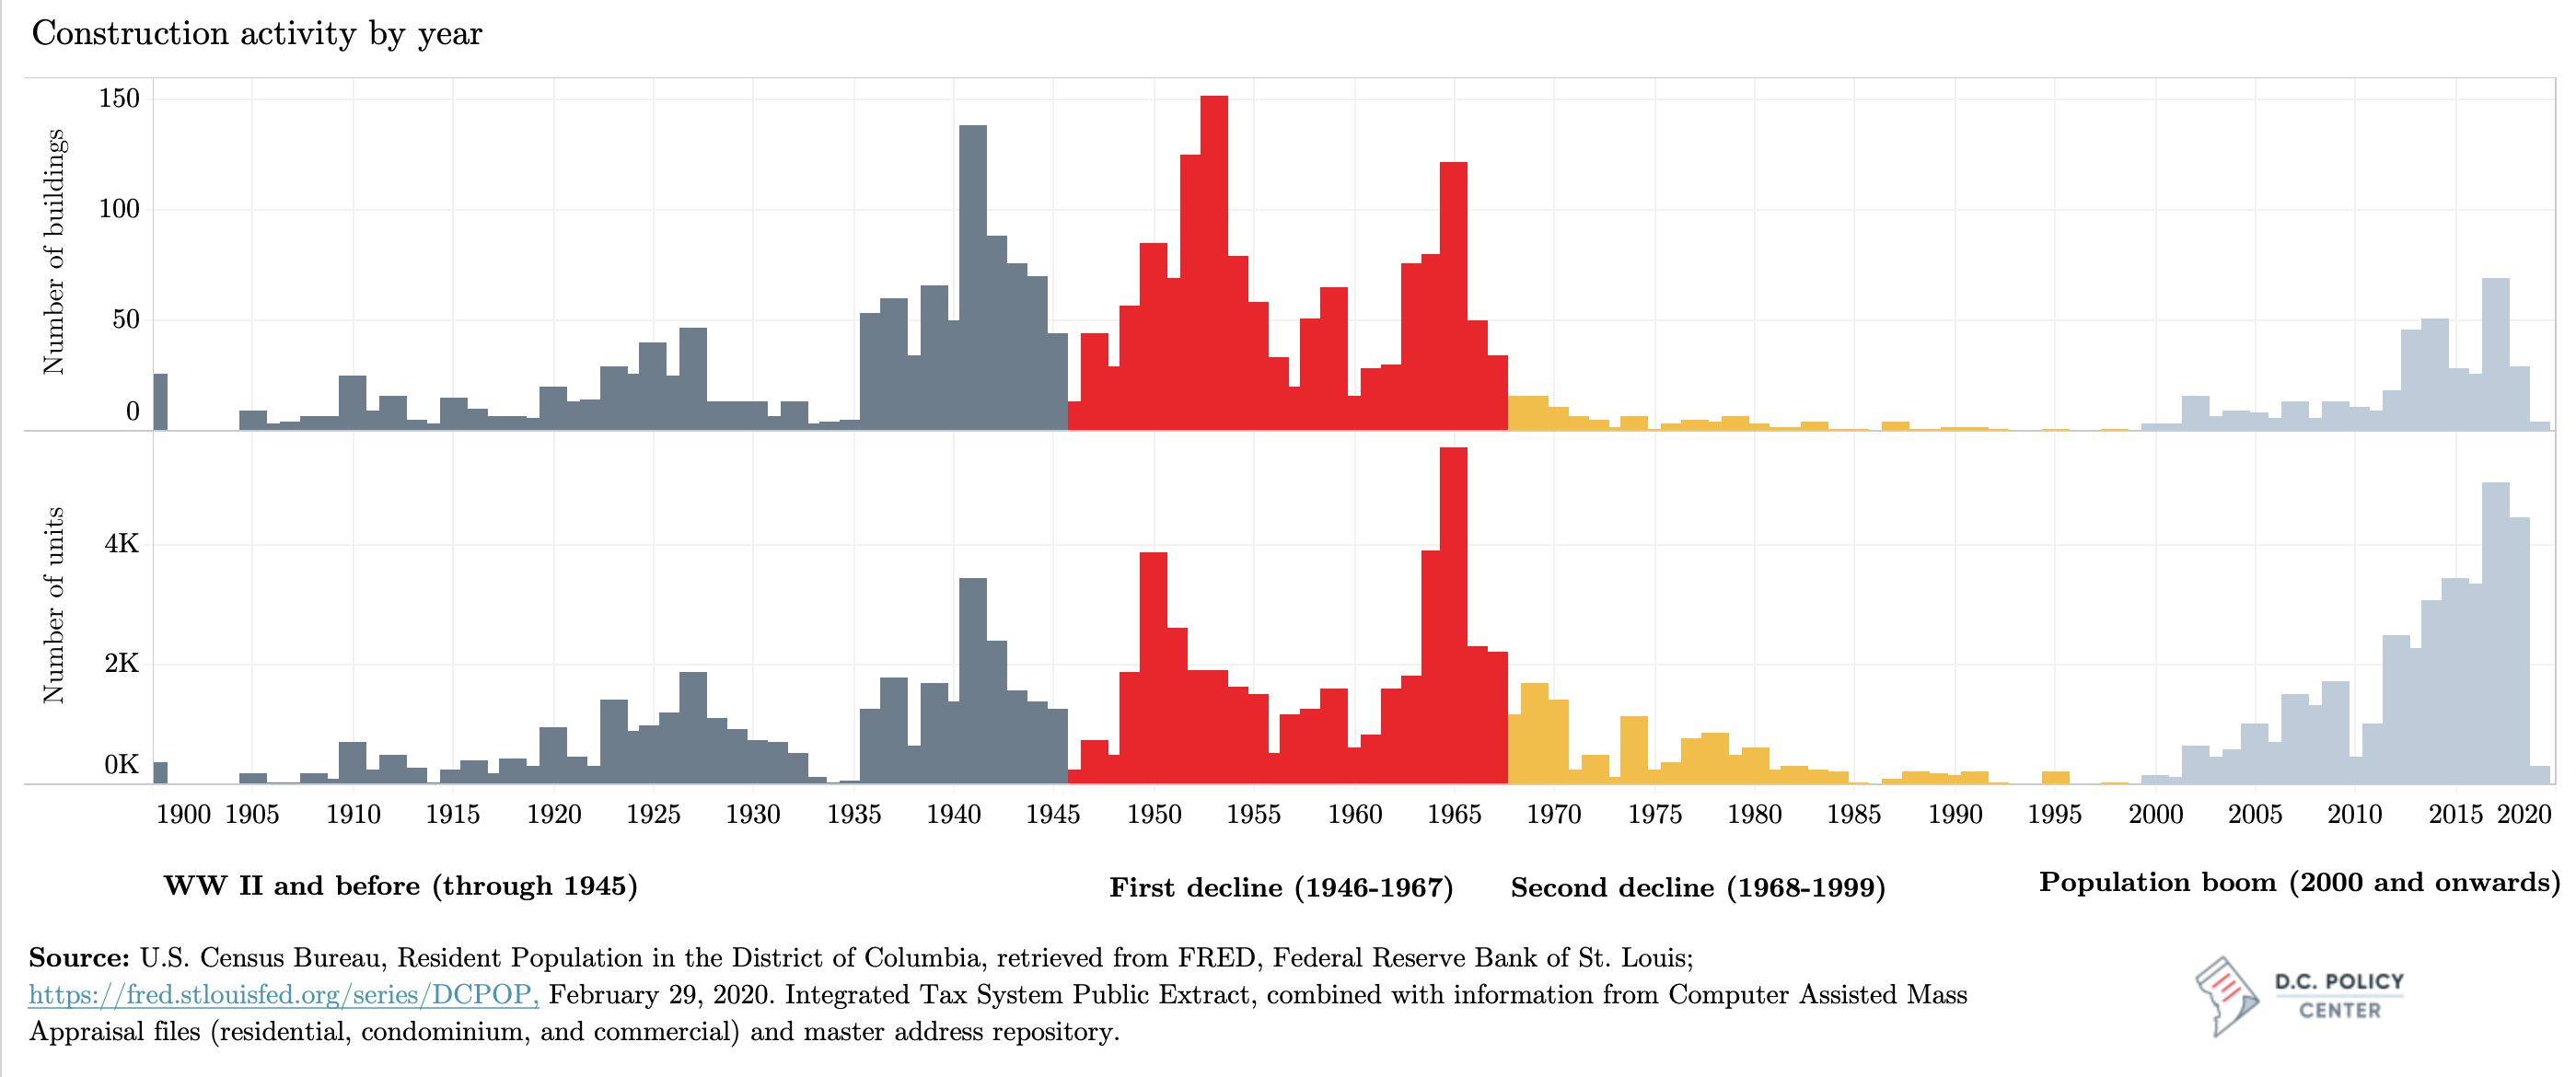
The District’s 124,641 apartment units, distributed across 3,121 buildings, constitute the core of its rental stock. These buildings show a dramatic variety in size, location, and the combination of unit sizes, reflecting the market conditions of where and when they were built. It is useful to think of the city’s housing history alongside its changes in population, as population is a strong predictor of housing demand. In this context, the four distinct periods in the District’s population history produce four distinct periods of its rental housing production history.
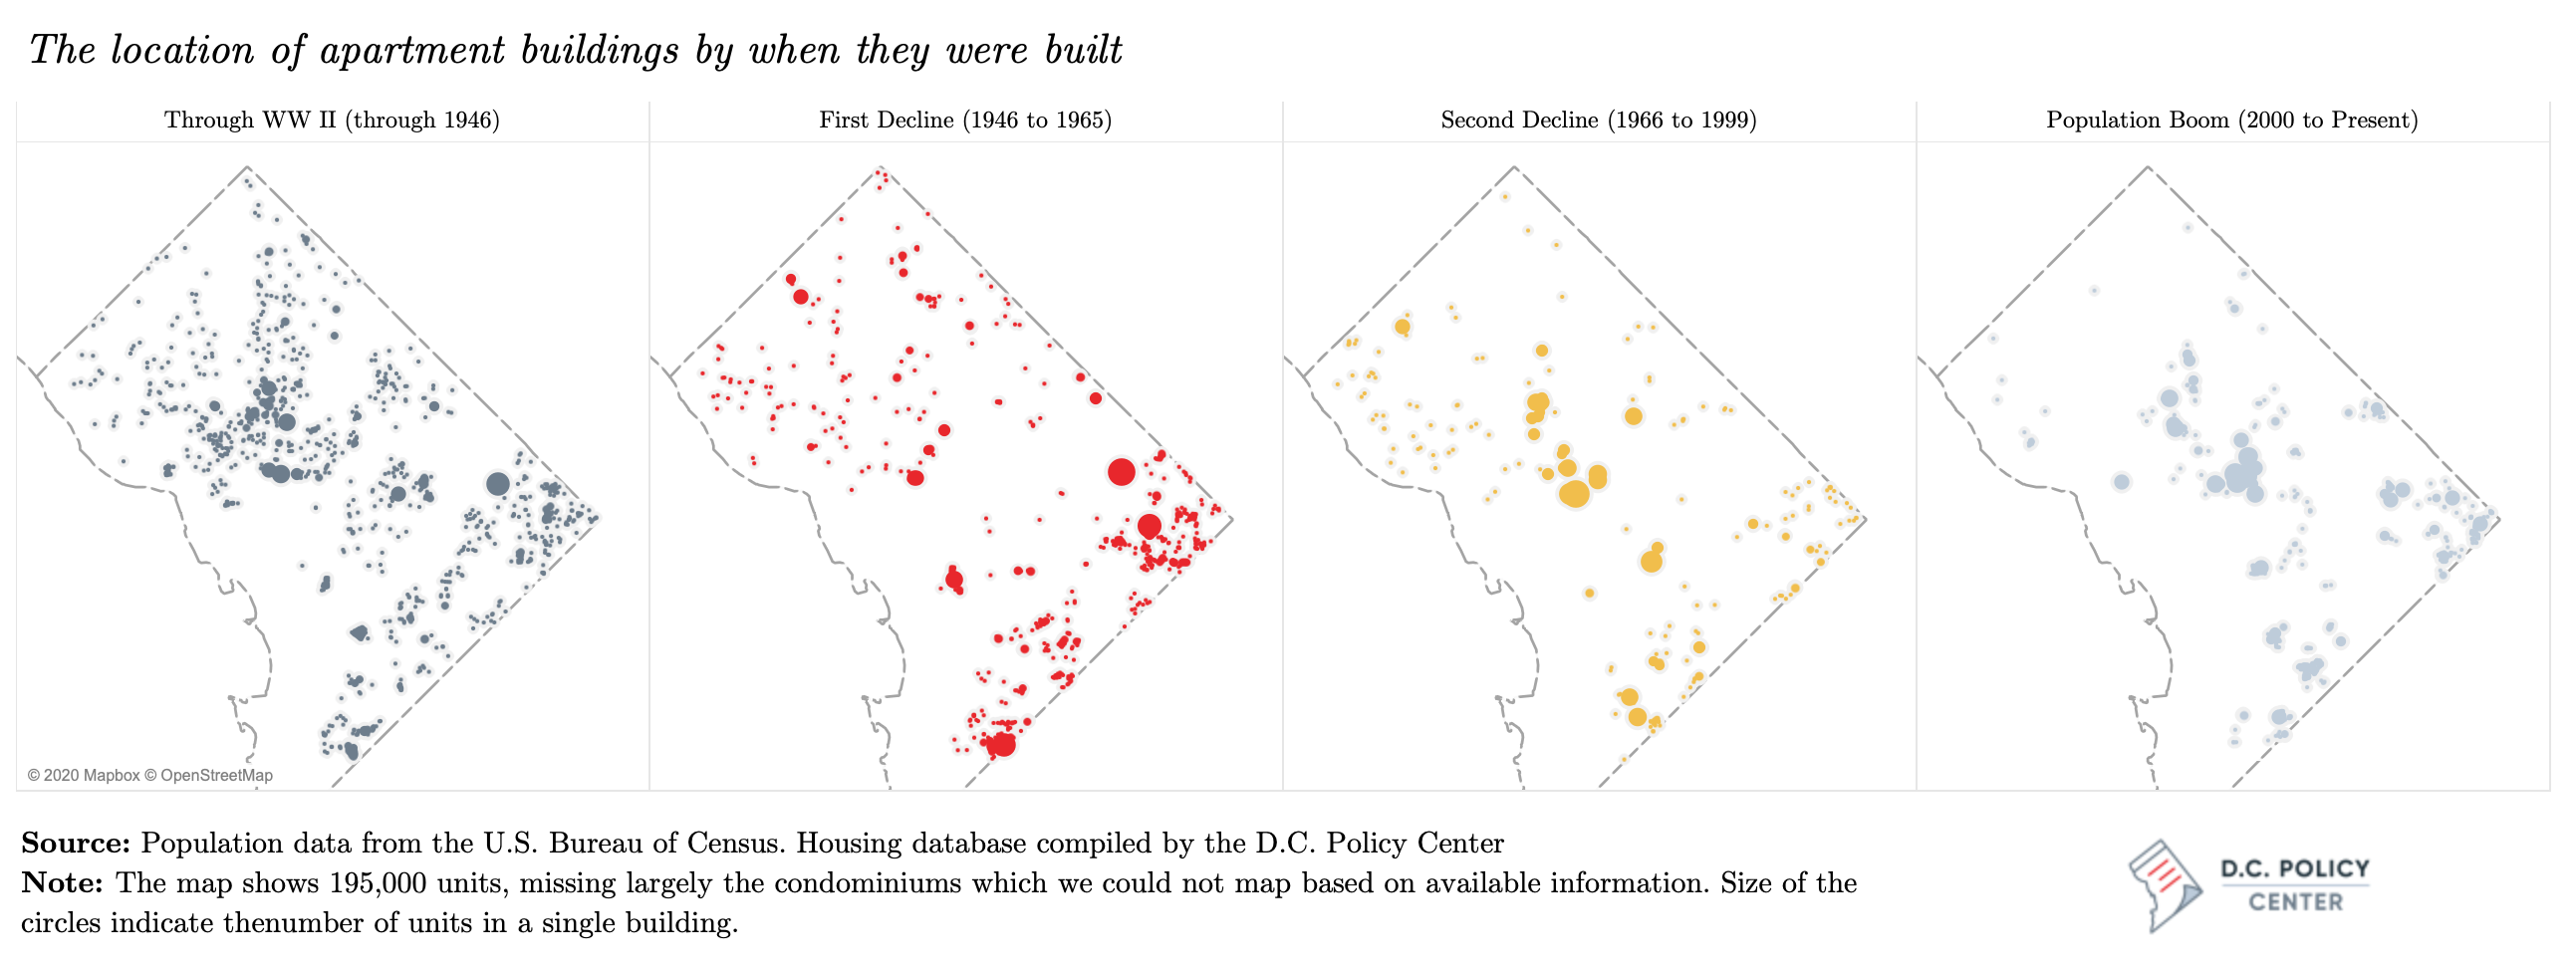
The first period of rental apartment construction follows along the continuous population increase that began before the turn of the 20th century and lasted through the end of World War II. During this period, the District’s population grew especially fast and peaked right before World War II, when it stood at 899,000 residents. One third of the rental apartment units (38,700 units) and 40 percent the rental apartment buildings (1,320 buildings) that serve D.C. residents today were constructed during this time. Nearly half of this construction took place after 1936, as the city undertook a massive effort to build new homes in anticipation of the spending from New Deal programs. Construction happened all over the city during this period, but especially north of the downtown areas, along 16th Street and Connecticut Avenue.
The next period of construction history is the “First Decline” between 1946 and 1965. Much like many other central cities in the U.S., the District lost some of its population to the suburbs during this time with increased car ownership and rapid construction of roadways. Additionally, some white families left after school desegregation (with the Bolling v Board of Education case in 1954), and the city’s urban renewal efforts that began in the mid-1950s pushed many Black families either to neighborhoods in the southeast quadrant or out of the city entirely. But despite the decline in population by about 100,000 residents, construction activity remained strong with the delivery of 1,200 buildings and 35,650 units. More of the construction during this period was in neighborhoods east of Anacostia River; much of the small walk-up apartment stock that populates Wards 7 and 8 dates from this period.
The period of “Second Decline” began in 1965, as the city’s population decline deepened after the riots in 1968 and continued through 1999. During this 31-year period, the city’s population fell by more than 260,000 residents. There was still some construction activity at the beginning of this period—of the 194 apartment buildings with 16,300 units built (and still serving the city’s renters), 127 (with over 8,700 units) were built before 1970, and 37 (with over 4,000 units) are buildings that today are owned by the District of Columbia government or a charitable organization with a focus on affordability. However, construction activity came to a standstill after 1985: Only 14 buildings were built between 1985 and 1999—a rate of less than one per year—and only five were built between 1991 and 1999. It is important to note that, even though the District’s population fell dramatically, during this period, the number of households did not decline as fast as the population, keeping housing demand somewhat intact [14].
The fourth and the final period began in 2000, when the District’s population began rebounding. Since then, the District has experienced one of the strongest periods of rental apartment production, despite the effects of the Great Recession. During this 20-year period, the city has added 375 new apartment buildings (12 percent of all rental buildings in the District) with 34,000 units (almost one quarter of all units). That is, the city’s rental apartment construction in recent years has been as strong as it was the period leading up to World War II, but the buildings are both much larger and more concentrated in parts of the city that have continued to experience substantial change.
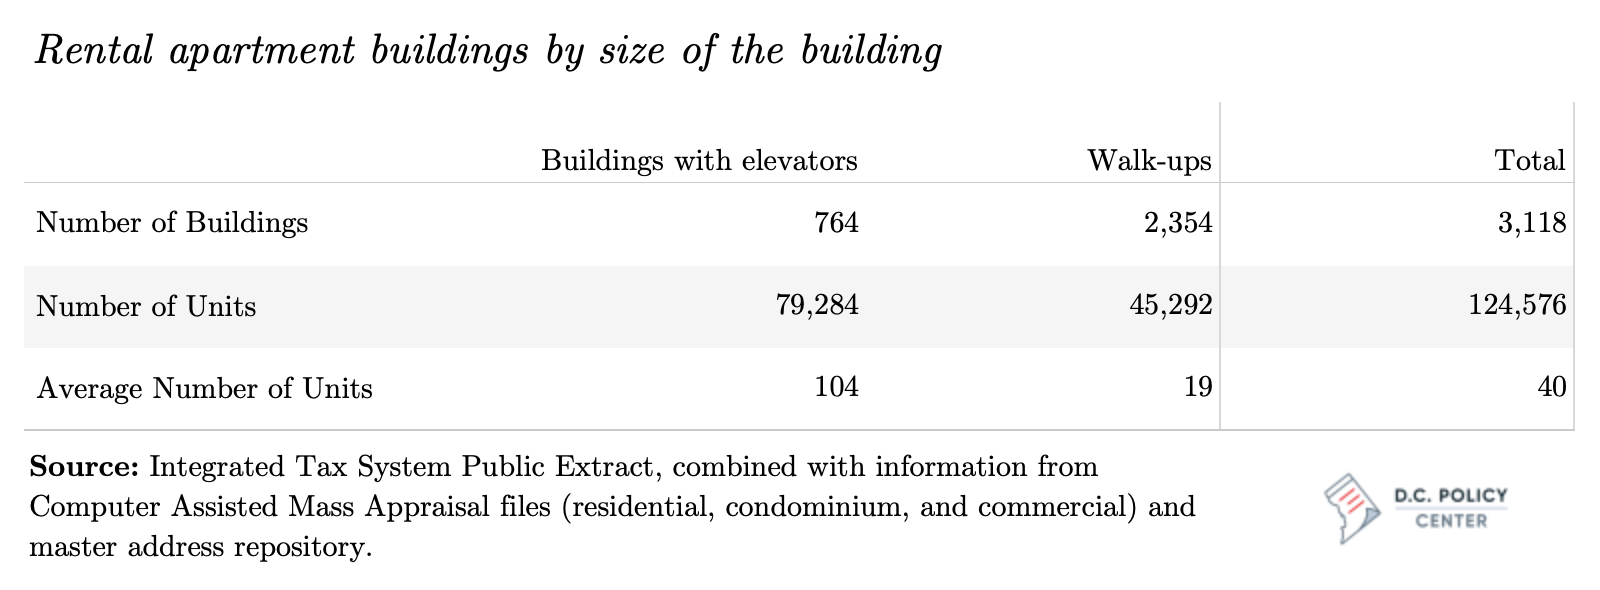
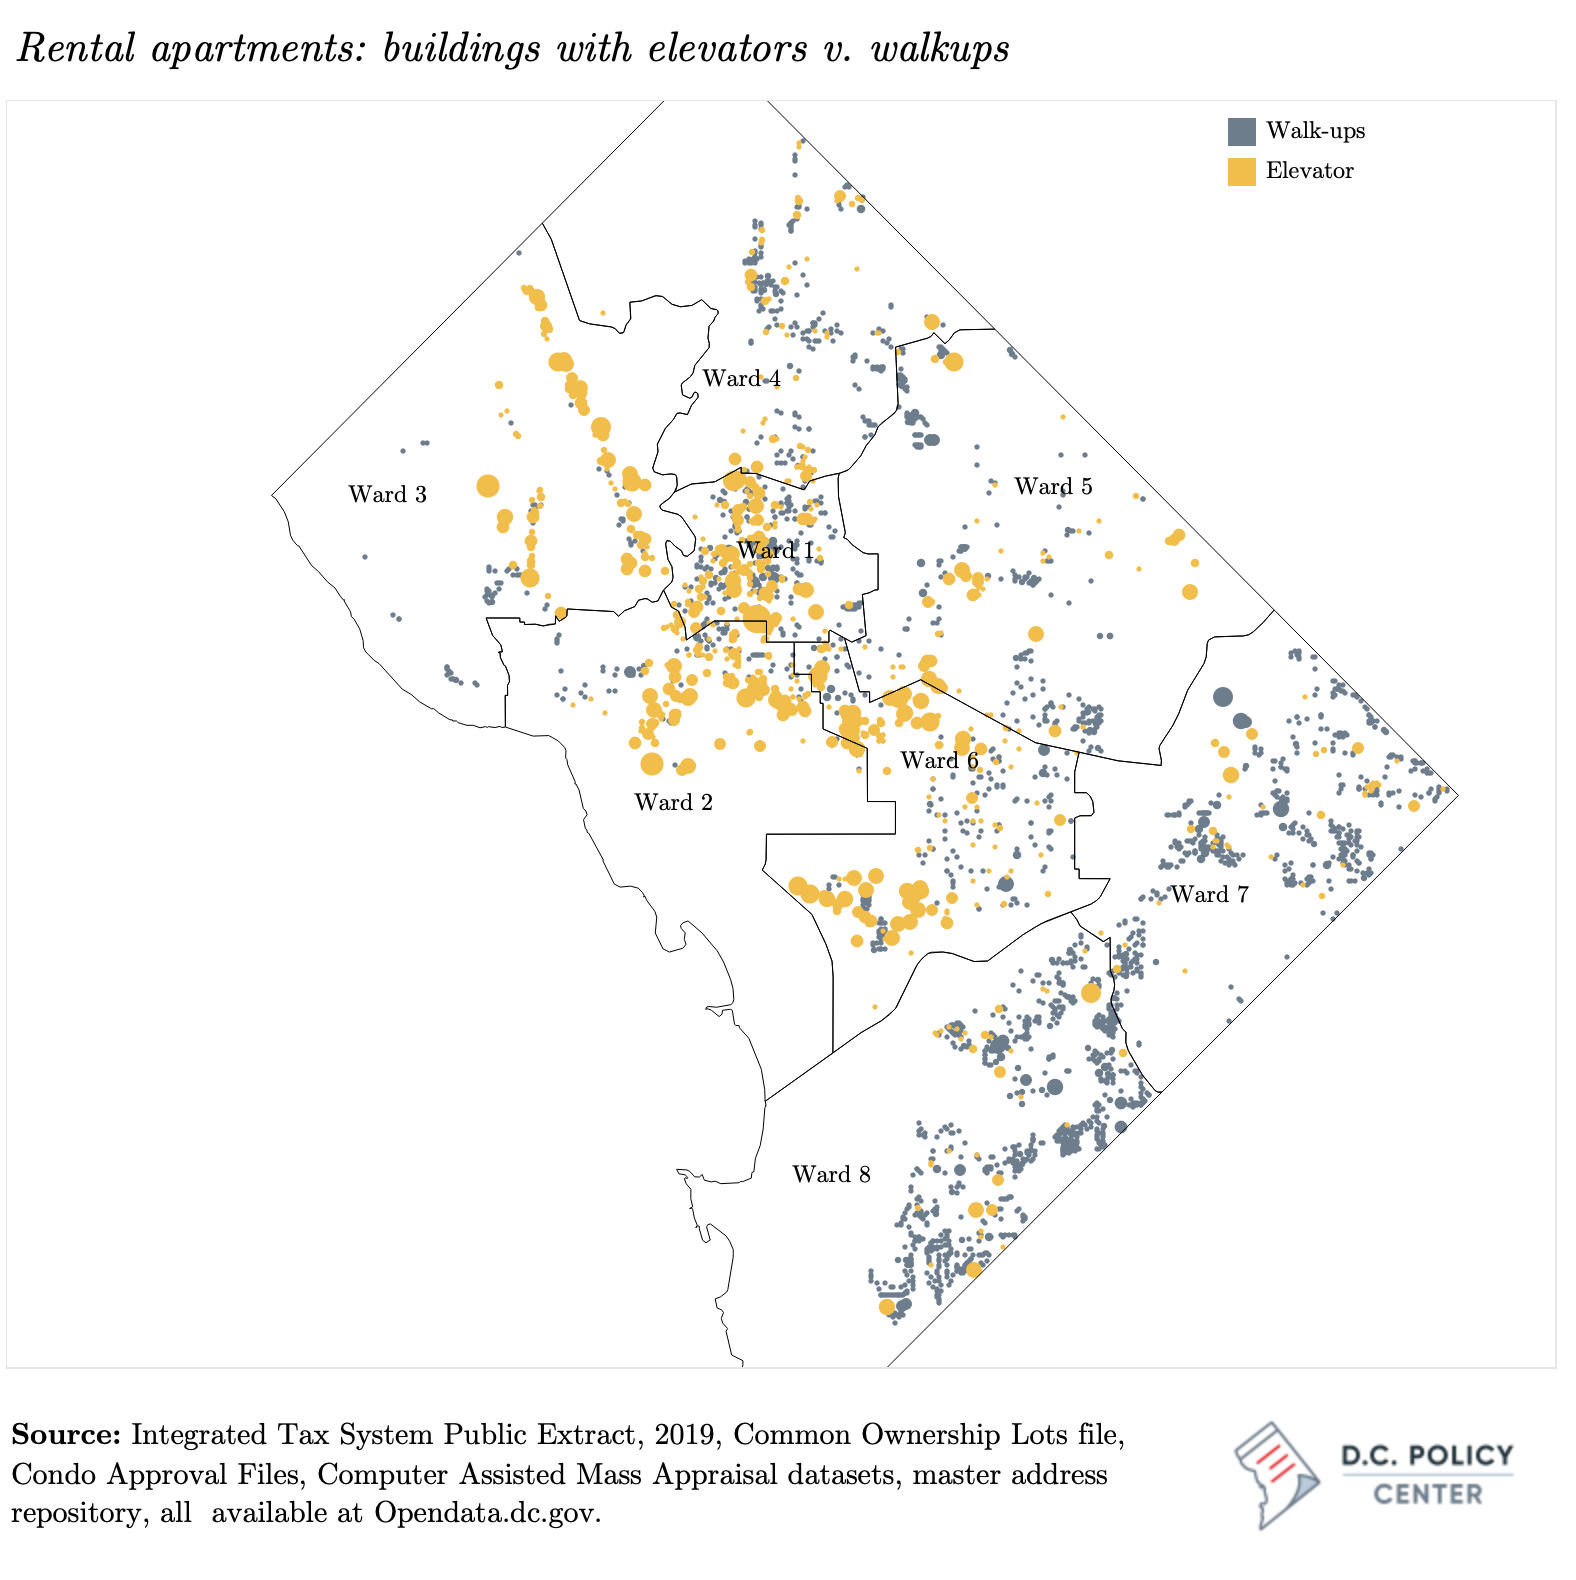
The mix of new and old construction in the District gives the city’s rental apartment buildings a diverse profile. More than two thirds of all apartment buildings (2,358 buildings) are low-rise buildings of two or three levels, with about 20 units each, and without elevators. Nearly 90 percent of these walk-up rental buildings in the District were built prior to 1965.[15] Today, these buildings dominate the landscape in neighborhoods east of the Anacostia River and provide 24,400 of the 29,400 rental apartment units in these neighborhoods. In contrast, nine out of ten of the 764 buildings with elevators are in neighborhoods west of the Anacostia River. These buildings are relatively new (315 buildings with nearly 33,000 units were built after 2000), and on average have five times the number of units as are in walk-up buildings, with an average of 104 units in each.
Apartment buildings subject to rent control
The District’s rent control laws date back to 1973, but the basis of its current law is the 1985 Rental Housing Act (See Appendix I for a history of the rent control laws in the District). By design, rent control laws apply to a fixed stock—in D.C.’s case, buildings that received their building permits by December 31, 1975. But this does not mean that the stock remains at the 1985 levels: over the 35 years that have passed since enactment of the 1985 Rental Housing Act, the District has lost somewhere between 15 and 30 percent of its rent-controlled stock.
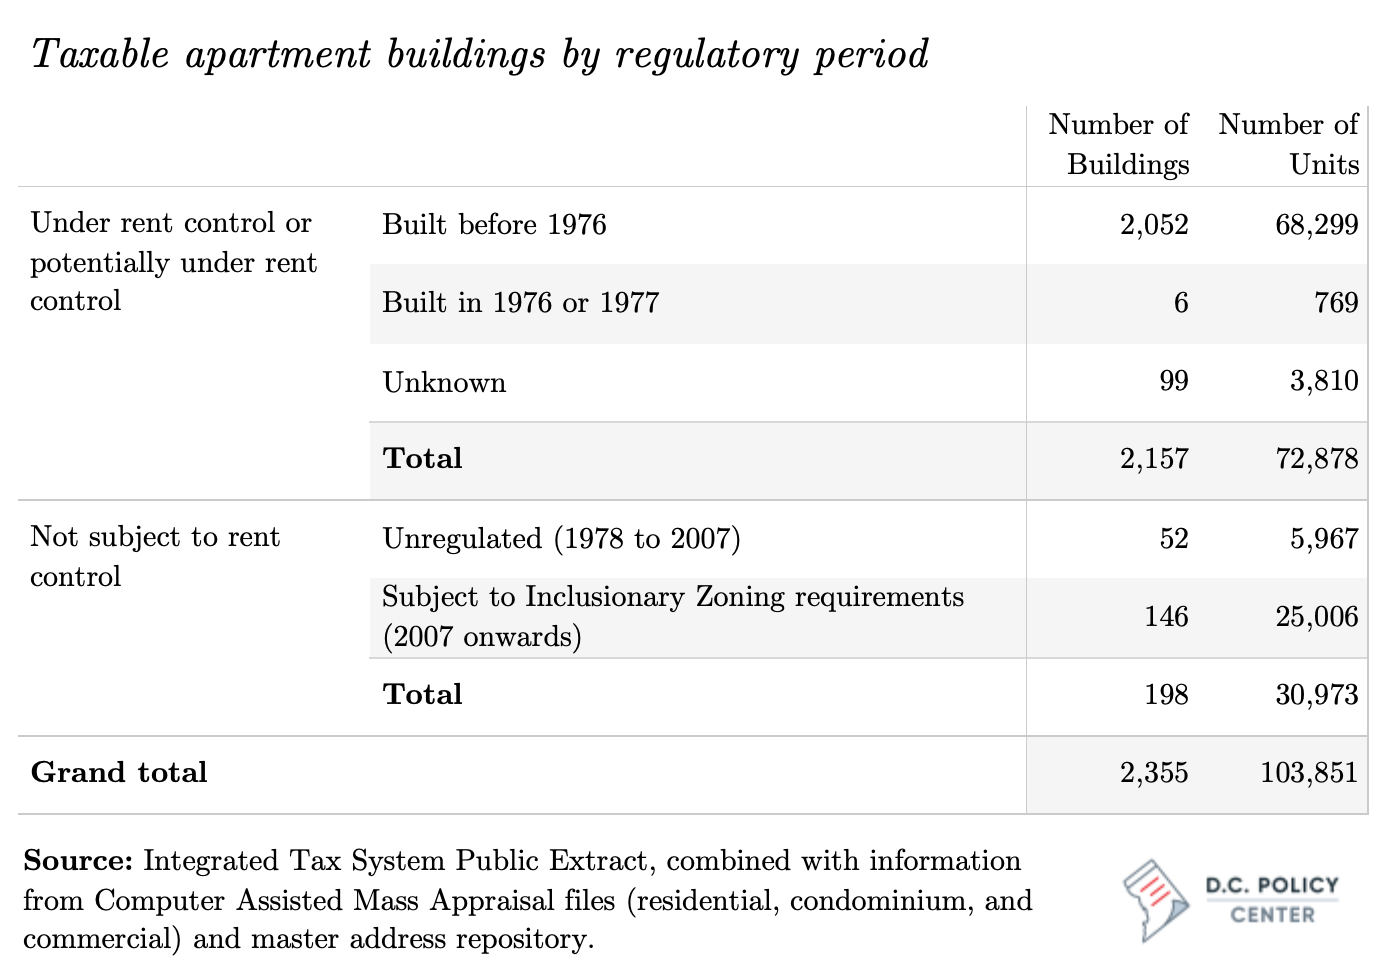
The D.C. Policy Center estimates that the District currently has at least 68,300 rent-controlled units in 2,050 multi-family rental apartment buildings, but could possibly have as many as 72,900 rent-controlled units spread across 2,157 separate buildings.[16] This is the equivalent of 57 percent of all units in rental apartment buildings (excluding those owned by the D.C. government or managed by nonprofits, and including those not subject to rent control), 35 percent of all units that are currently being rented (including the shadow rental market), and 23 percent of the total housing stock.
When the District first enacted the 1985 Rental Housing Act, its total rental stock was an estimated 162,000 units, according to a 1990 estimate by the Urban Institute.[17],[18] However, no data are available on how many of these units would have been subject to rent control. Another piece of evidence comes from a 1988 study the Urban Institute conducted for the District’s Department of Consumer and Regulatory Affairs, which noted that about two thirds of these properties were subject to rent control.[19] This would suggest a rent-controlled stock size of 101,000 units at the time of the enactment of the Rental Housing Act, but that figure could include units in buildings other than rental apartments. For purposes of this report, D.C. Policy Center researchers use an estimate based on apartment building directories published at the time, which puts the number of rent-controlled units in rental apartment buildings at approximately 85,000.[20] This base figure of rental apartment units already serving the city at the time suggests that the District has lost at least 15 percent of its rent-controlled units in rental apartment buildings. If the actual base figure is closer the earlier Urban Institute estimate of 101,000 units, the loss could be as high as 30 percent.
The loss of 15 percent of rent-controlled units in apartment buildings over 35 years is a relatively small when compared to the experiences of other jurisdictions with rent control ordinances.[21] For example, only 10 years after San Francisco extended its rent control laws to buildings with fewer than five units, the number of rental units in such buildings had declined by 15 percent, and the number of tenants in these buildings had declined by 25 percent—a much swifter decline what than D.C. has seen. Similar magnitudes of unit loss have been documented for New York and New Jersey municipalities with rent control ordinances. (See Appendix II beginning for a review of the literature on the impacts of rent control across the nation.)
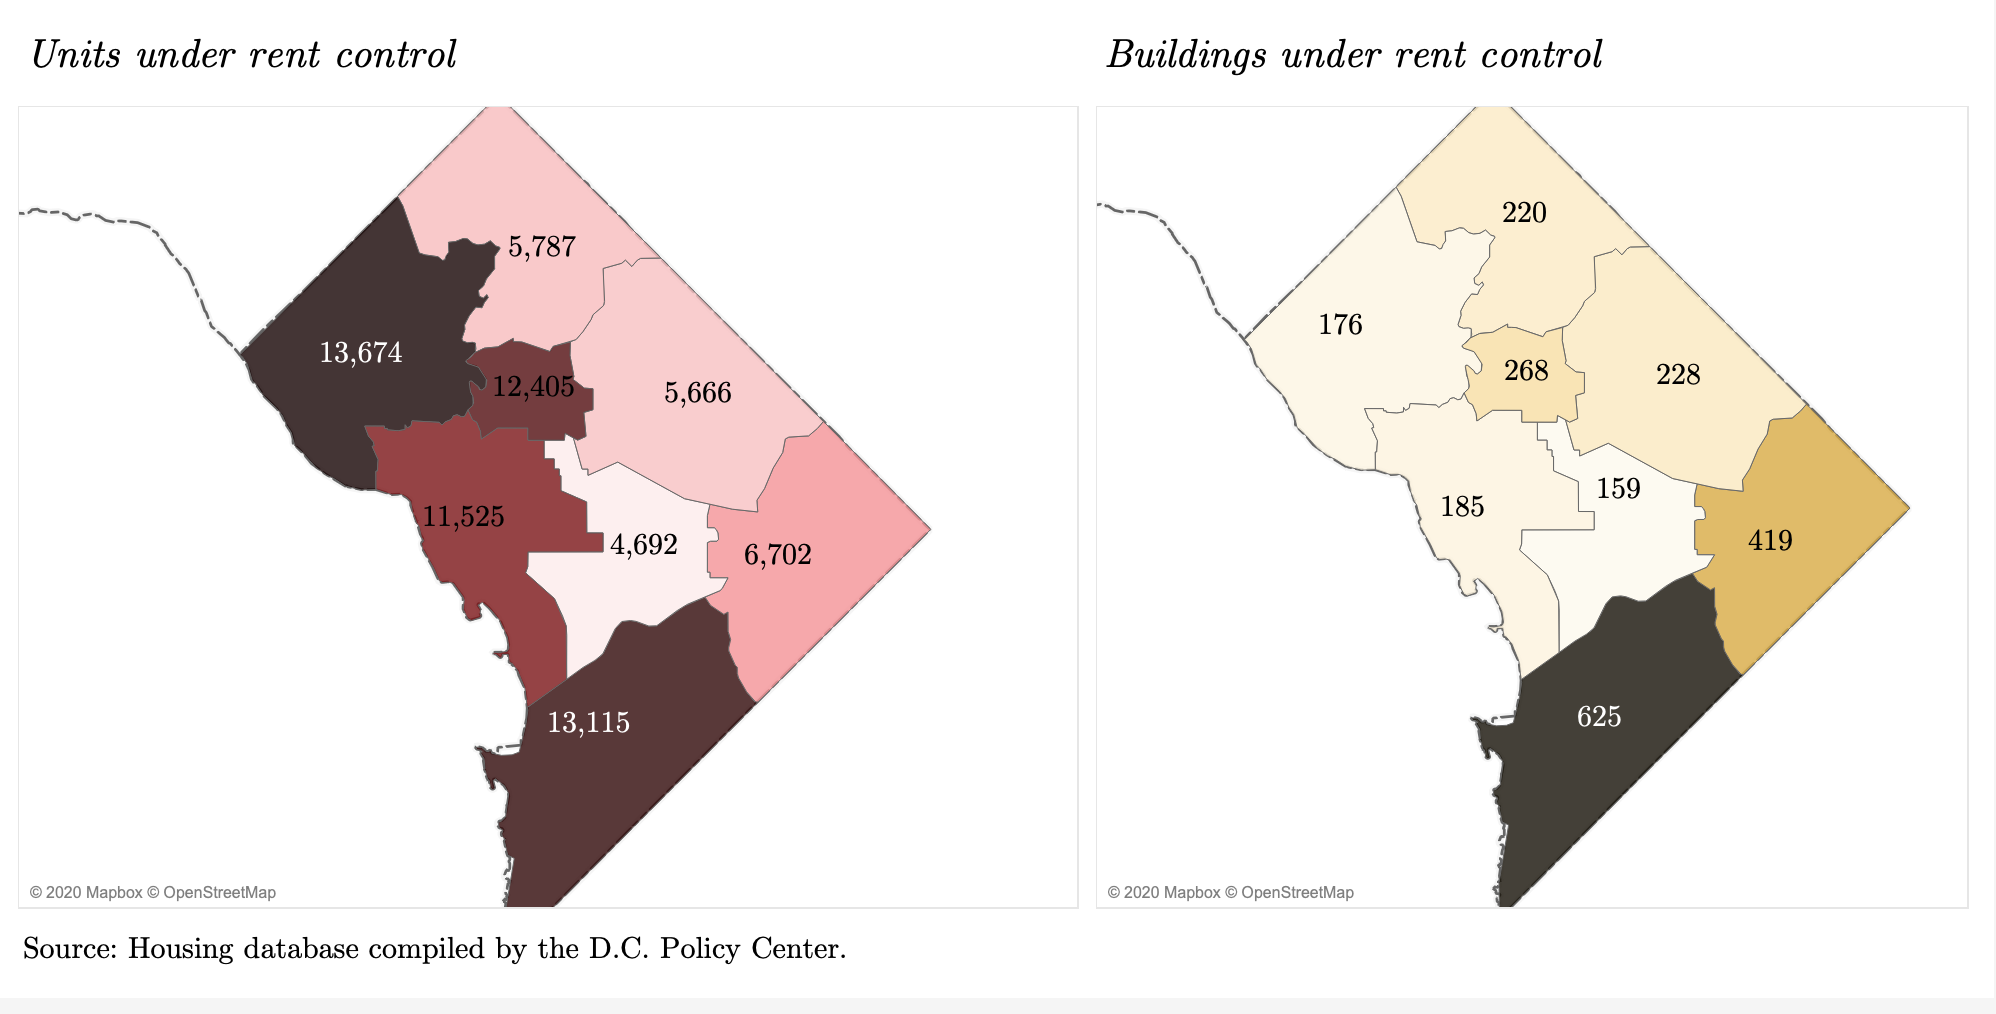
In every part of the city except for Ward 6, the rent-controlled stock constitutes at least half of the rental apartment units. Ward 6, by contrast, holds the greatest number of rental apartment units but the fewest number of rent-controlled units, because many of the multi-family buildings in Ward 6 have been constructed after 2000. The estimated 4,700 rent-controlled units in Ward 6 make up 18 percent of its rental apartments, 12 percent of its overall rental stock, and only 8 percent of the entire housing stock in the ward.
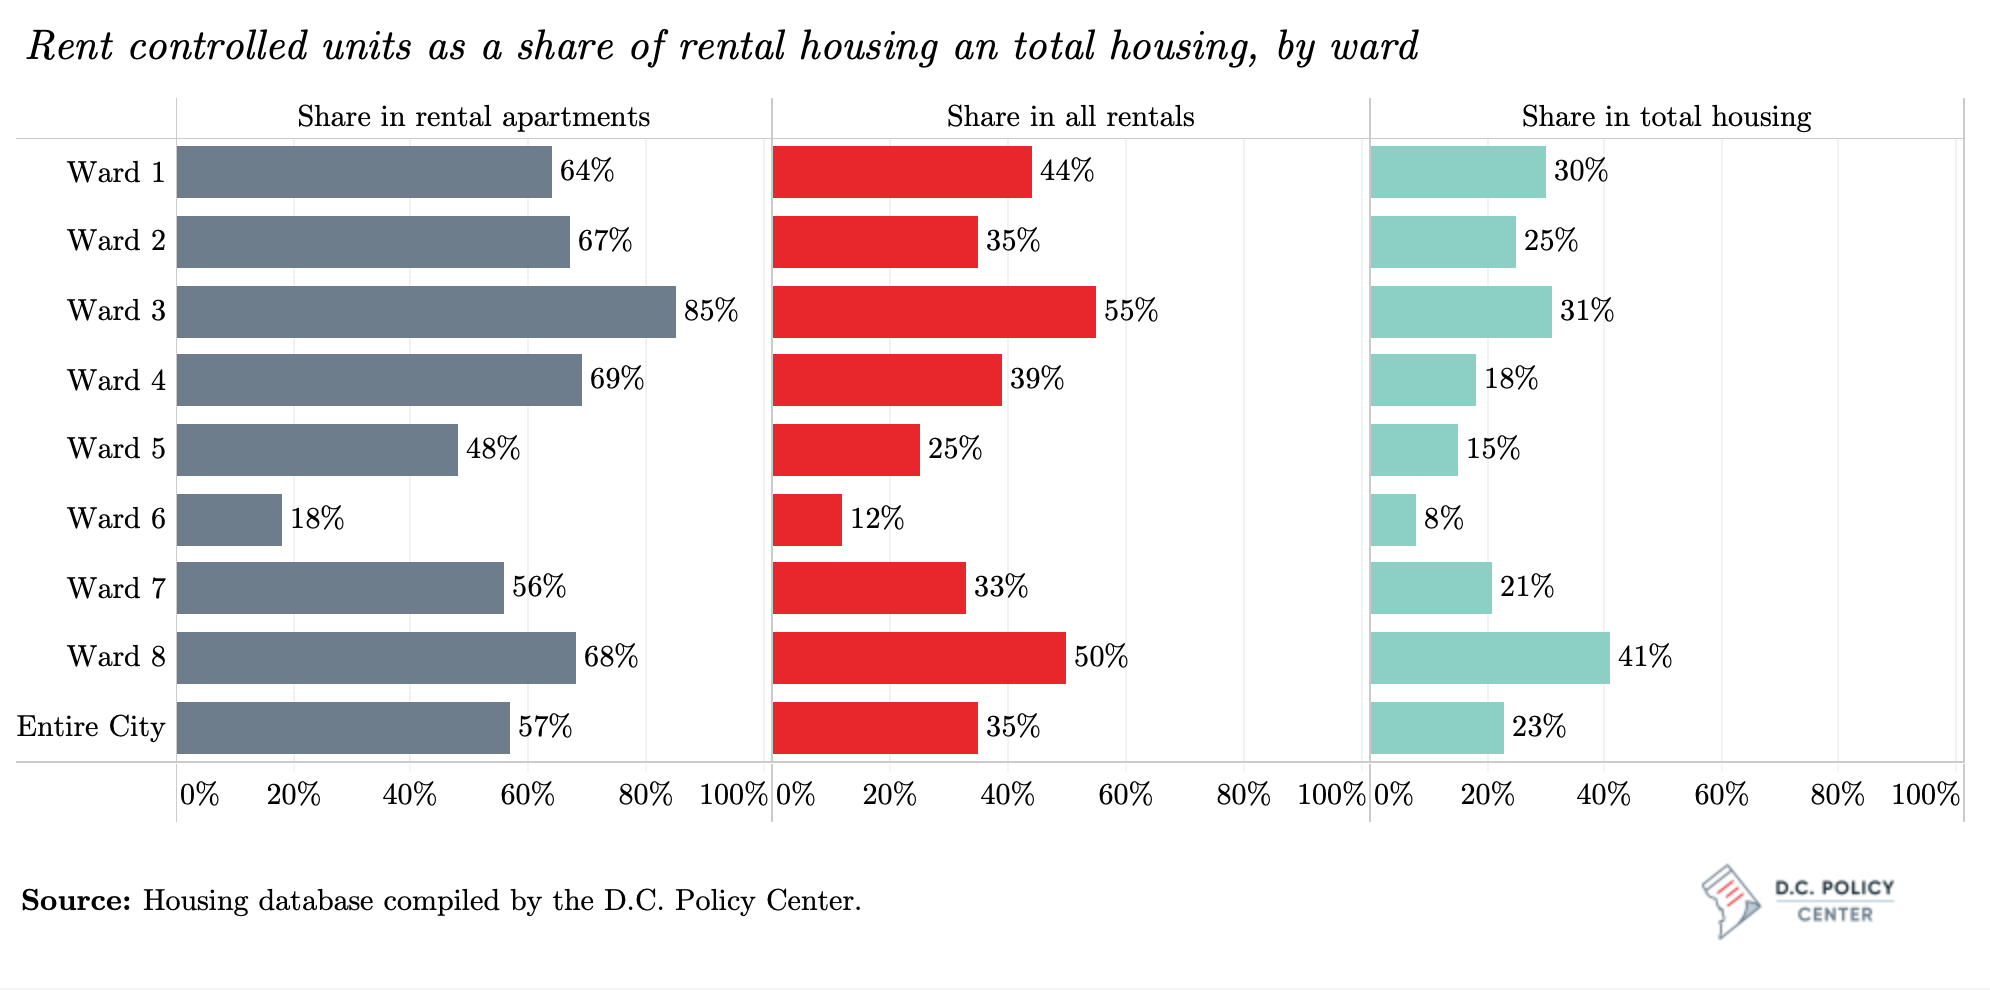
Meanwhile, Ward 3 has the largest number (13,674) and share (85) of rent-controlled units across all rentals, but these units are concentrated in large buildings along transportation corridors. The rent-controlled stock in Ward 8 is also large, but it looks very different from the stock in Ward 3. Here, 13,115 rent-controlled units are spread across 625 smaller buildings with an average of 20 units (compared to an average of 85 units in Ward 3). Units under rent control account for a lower share of the rental market in Ward 8 compared to Ward 3 (68 percent of rental apartment units and half of the entire rental stock), but a larger share of the entire housing stock including those units occupied by their owners (41 percent in Ward 8, compared to 31 percent in Ward 3).
The shadow rental market
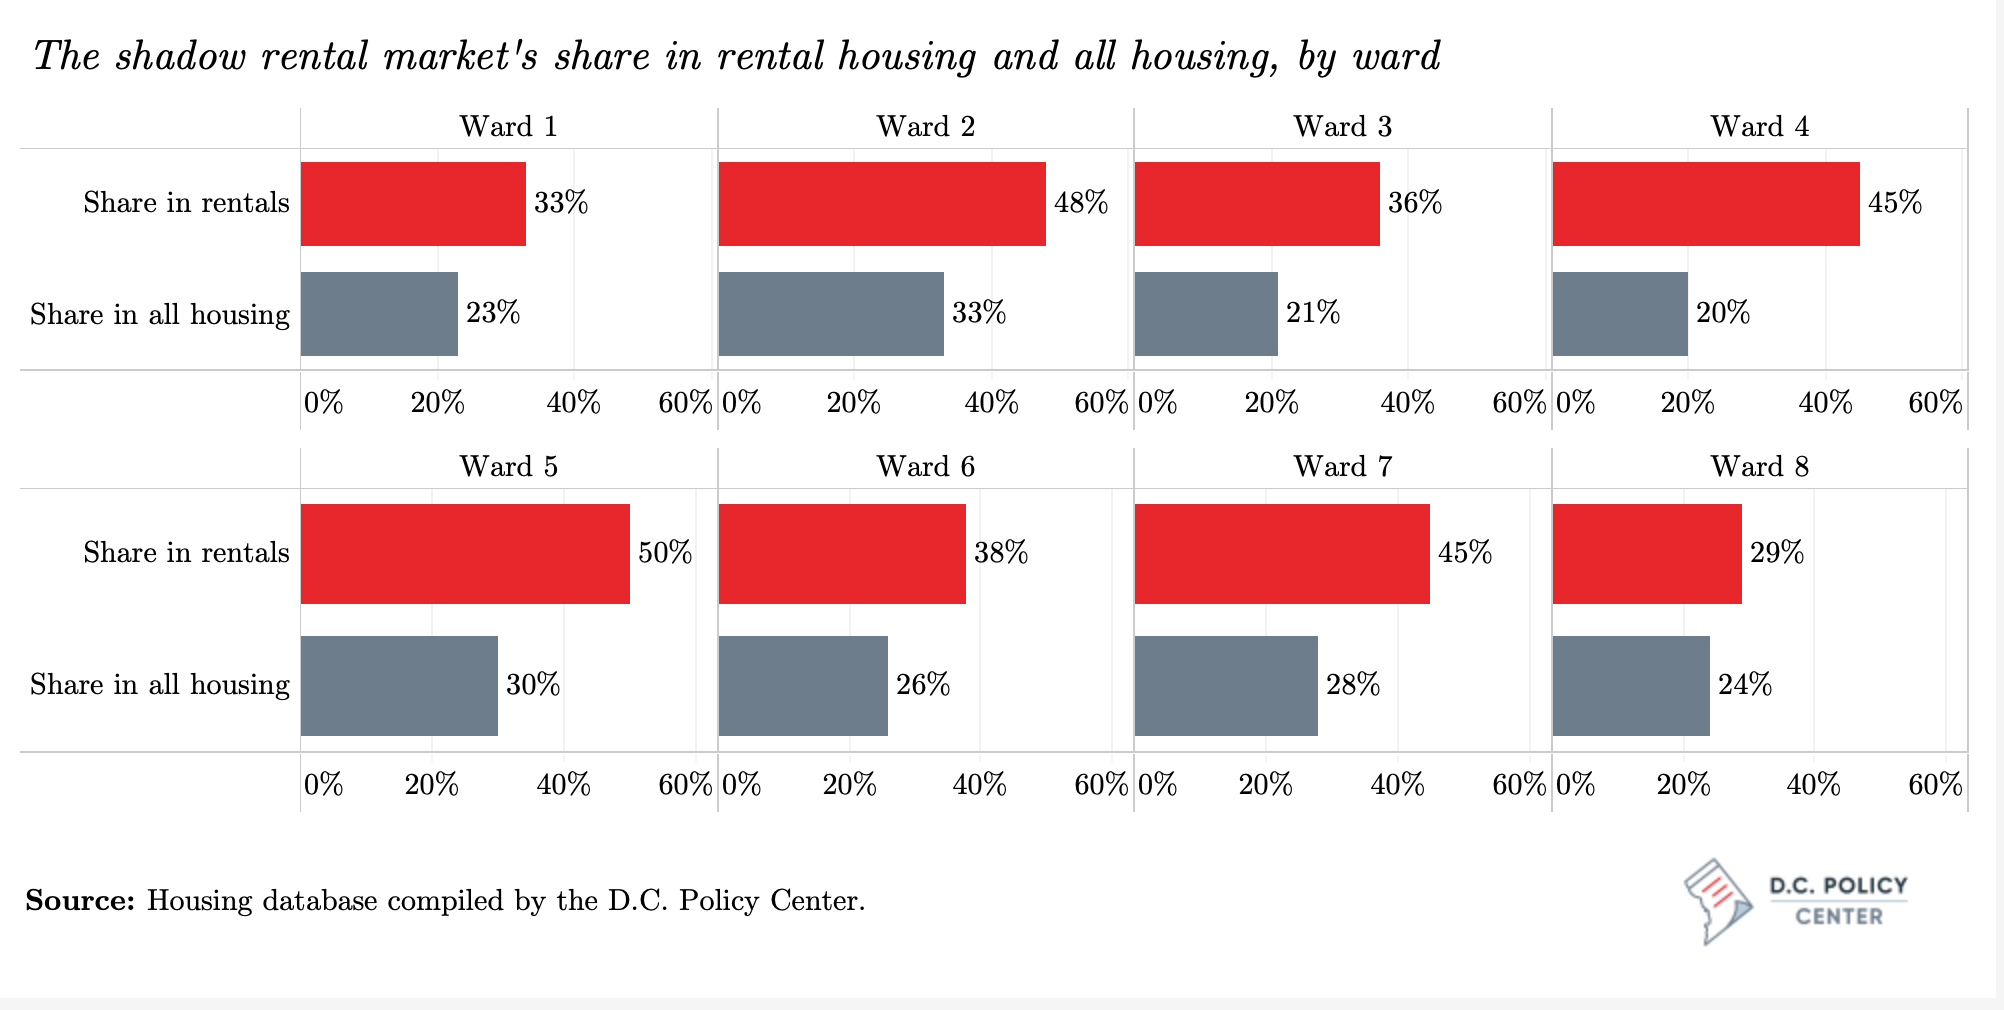
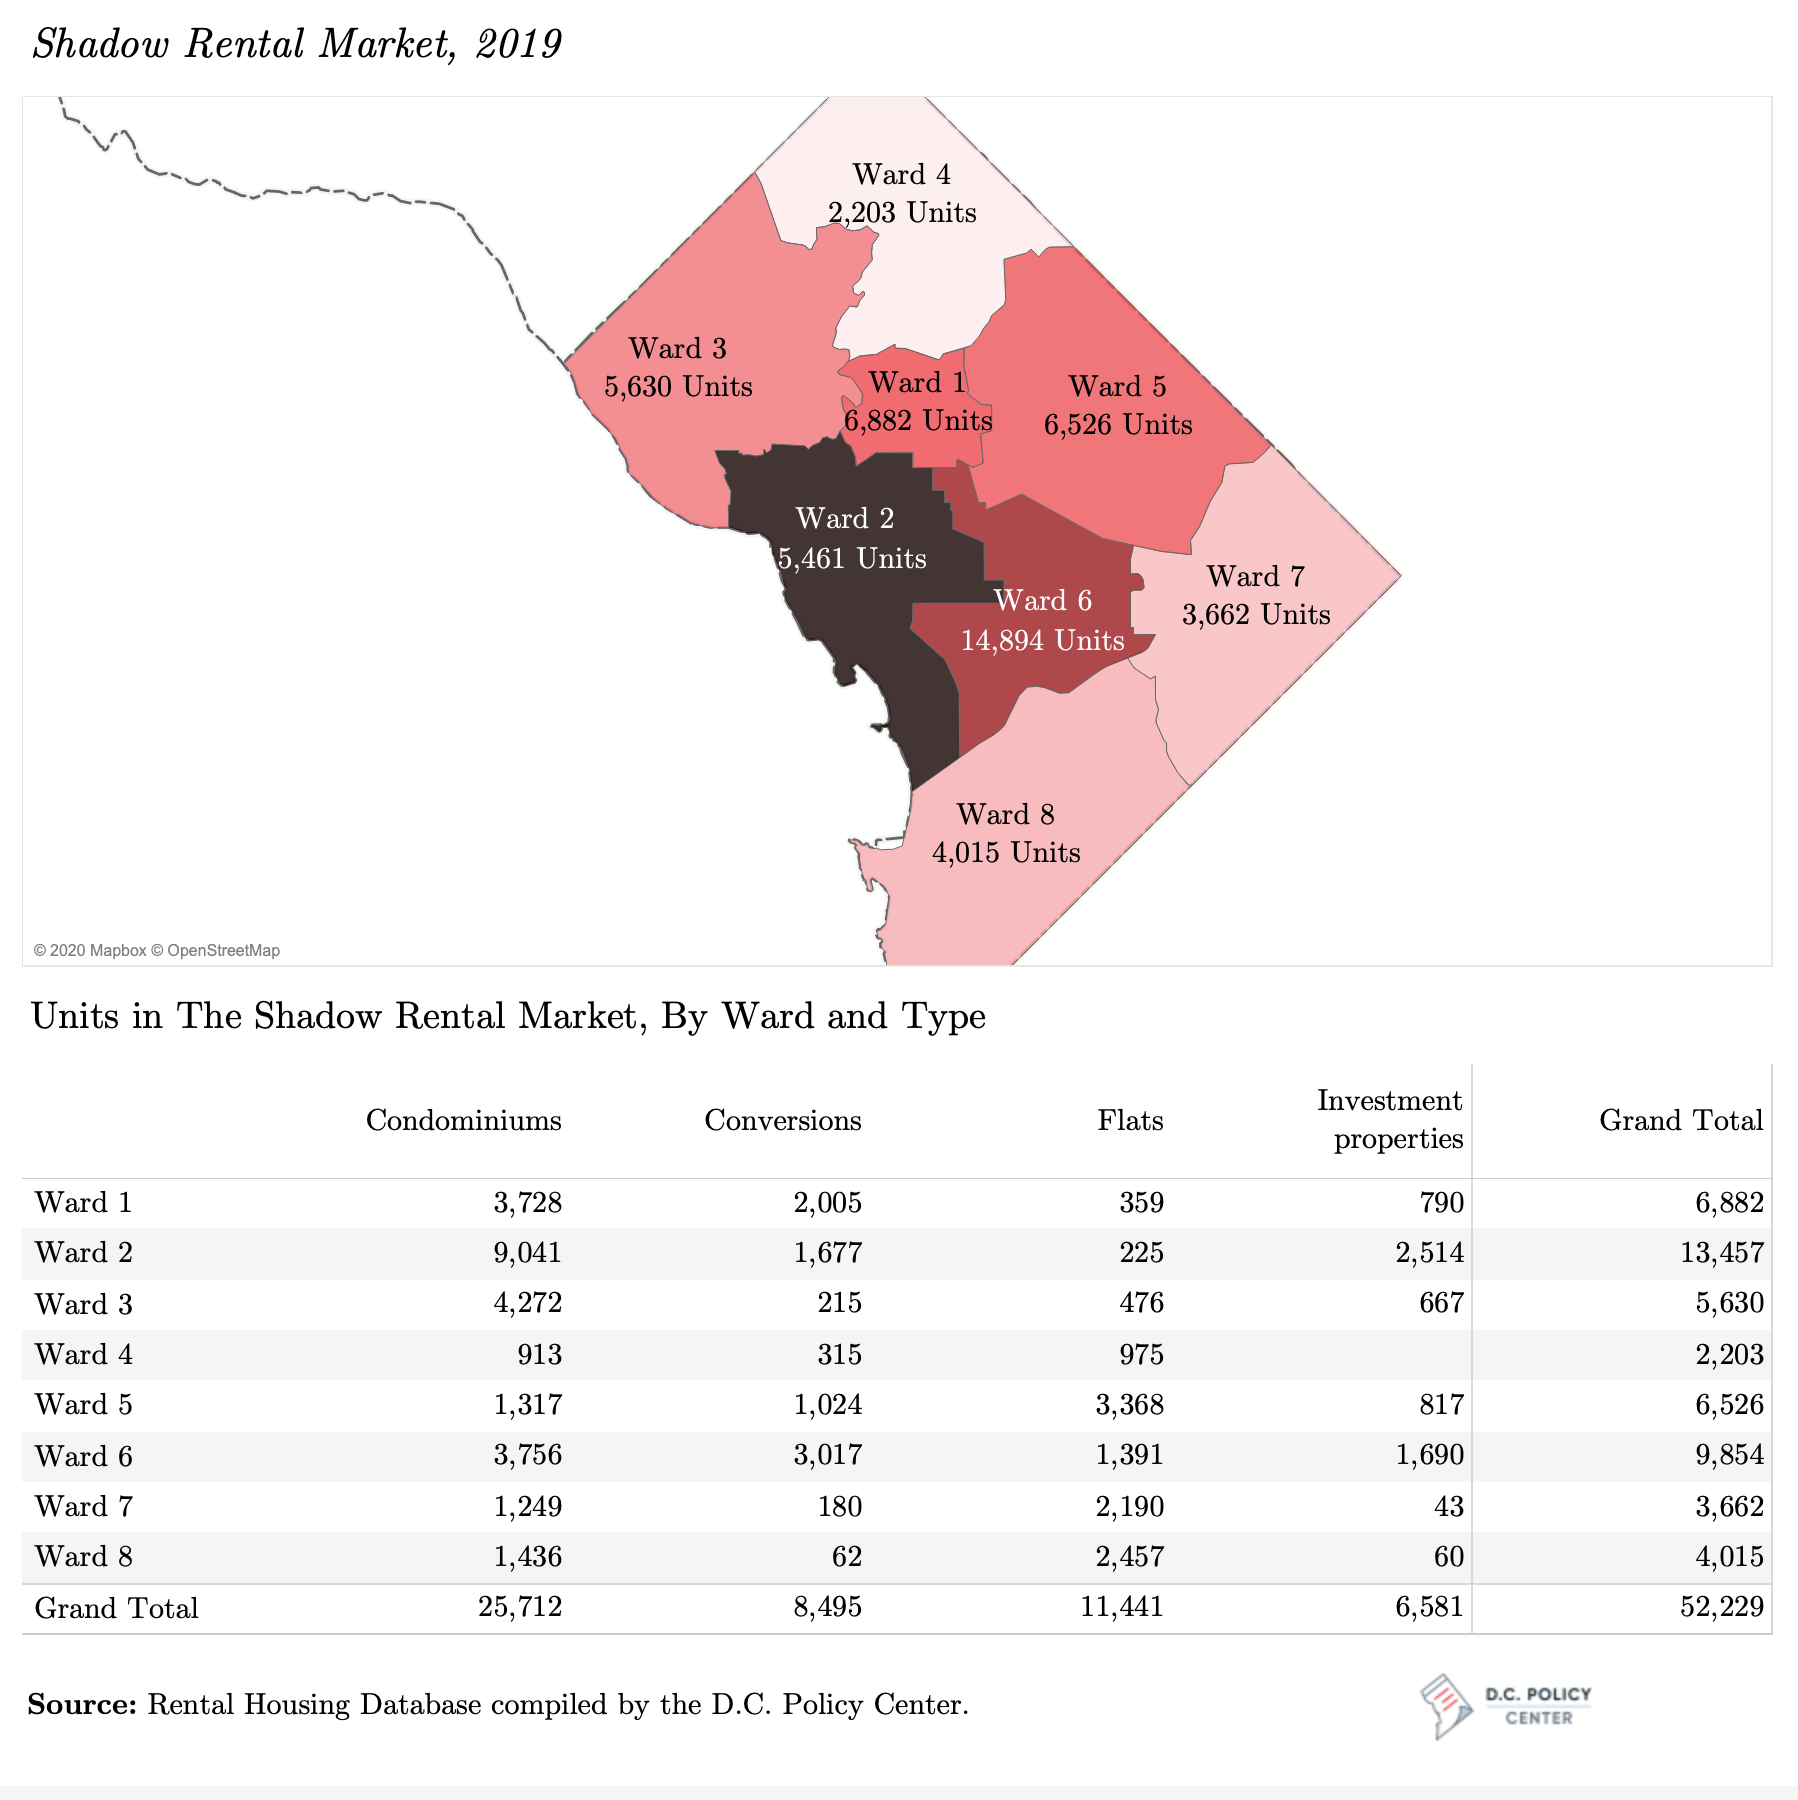
The District’s shadow rental market, with its estimated 82,780 units in 35,750 buildings, accounts for 40 percent of its rental stock. In each ward across the city, the shadow rental market provides at least one quarter of rental housing and one fifth of the total housing stock; and in Ward 2, which has the highest number of shadow rental market units, the shadow rental market accounts for nearly half of the rental housing (47 percent) and one third of the entire housing stock.
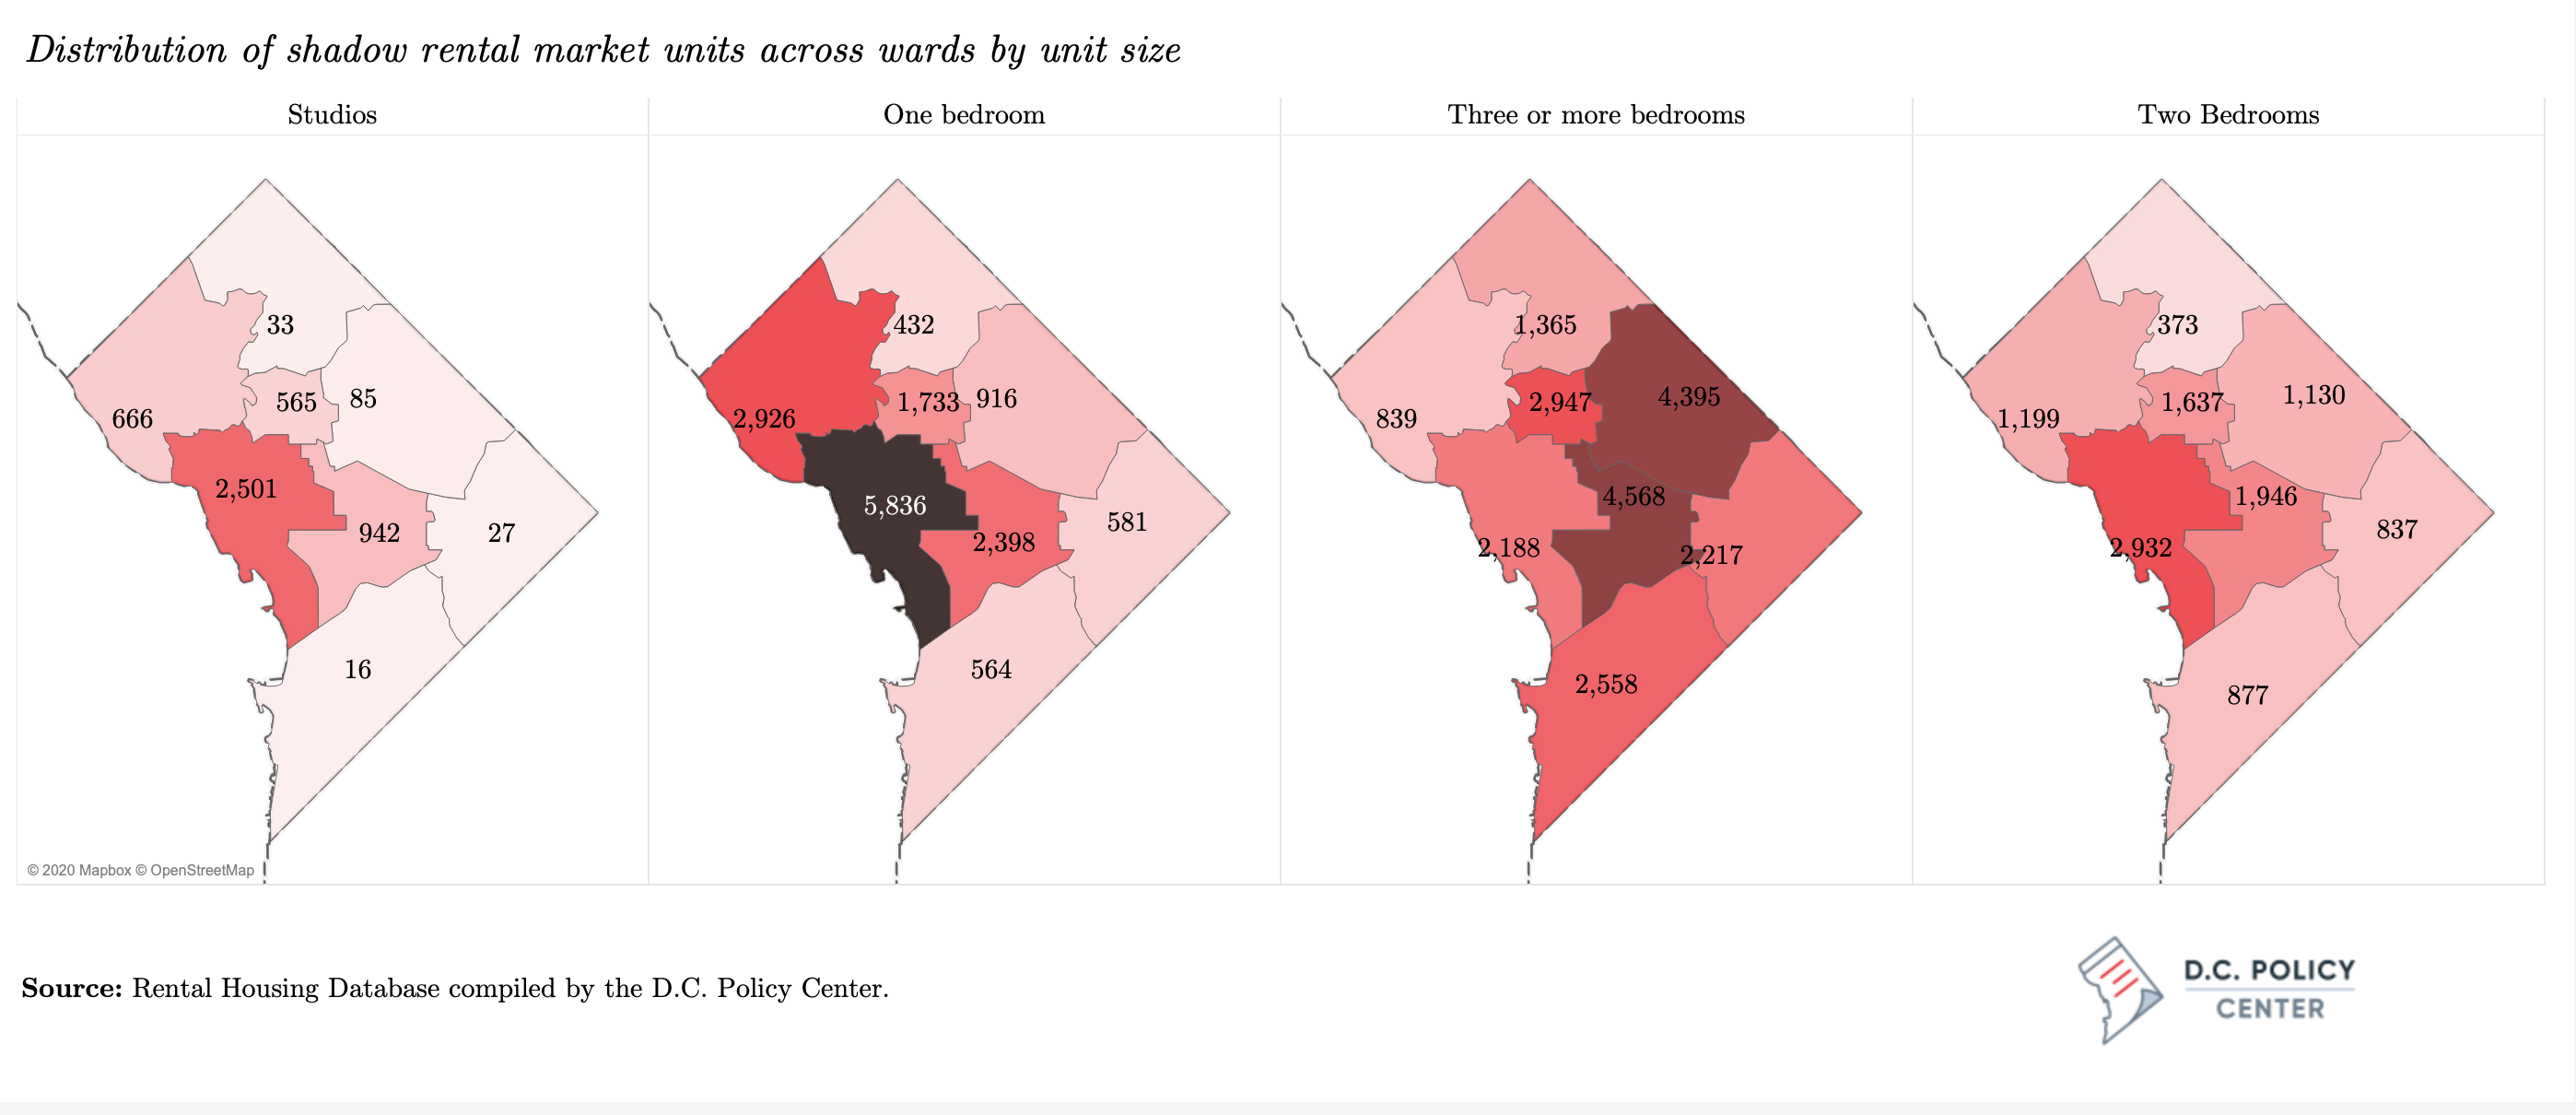
Nearly two thirds of the units in the shadow rental market are single-family homes and condominiums (each category contributes about 26,500 units), and another 20,000 units are spread across 7,150 smaller buildings with fewer than five units. Ward 2, on its own, accounts for one third of the condominiums rented out in the shadow rental market, but only 6 percent of the single-family homes. The greatest number of single-family homes rented out by their owners is in Ward 7, where 57 percent of the units in the shadow rental market (5,100 units out of approximately 9,000) are single family homes. Ward 4 contributes 4,246 single-family homes to the District’s shadow rental market—while it is a smaller number than Ward 7’s, these units account for 65 percent of all shadow rental market units is this ward.
Can the District’s rental housing serve households of all sizes?
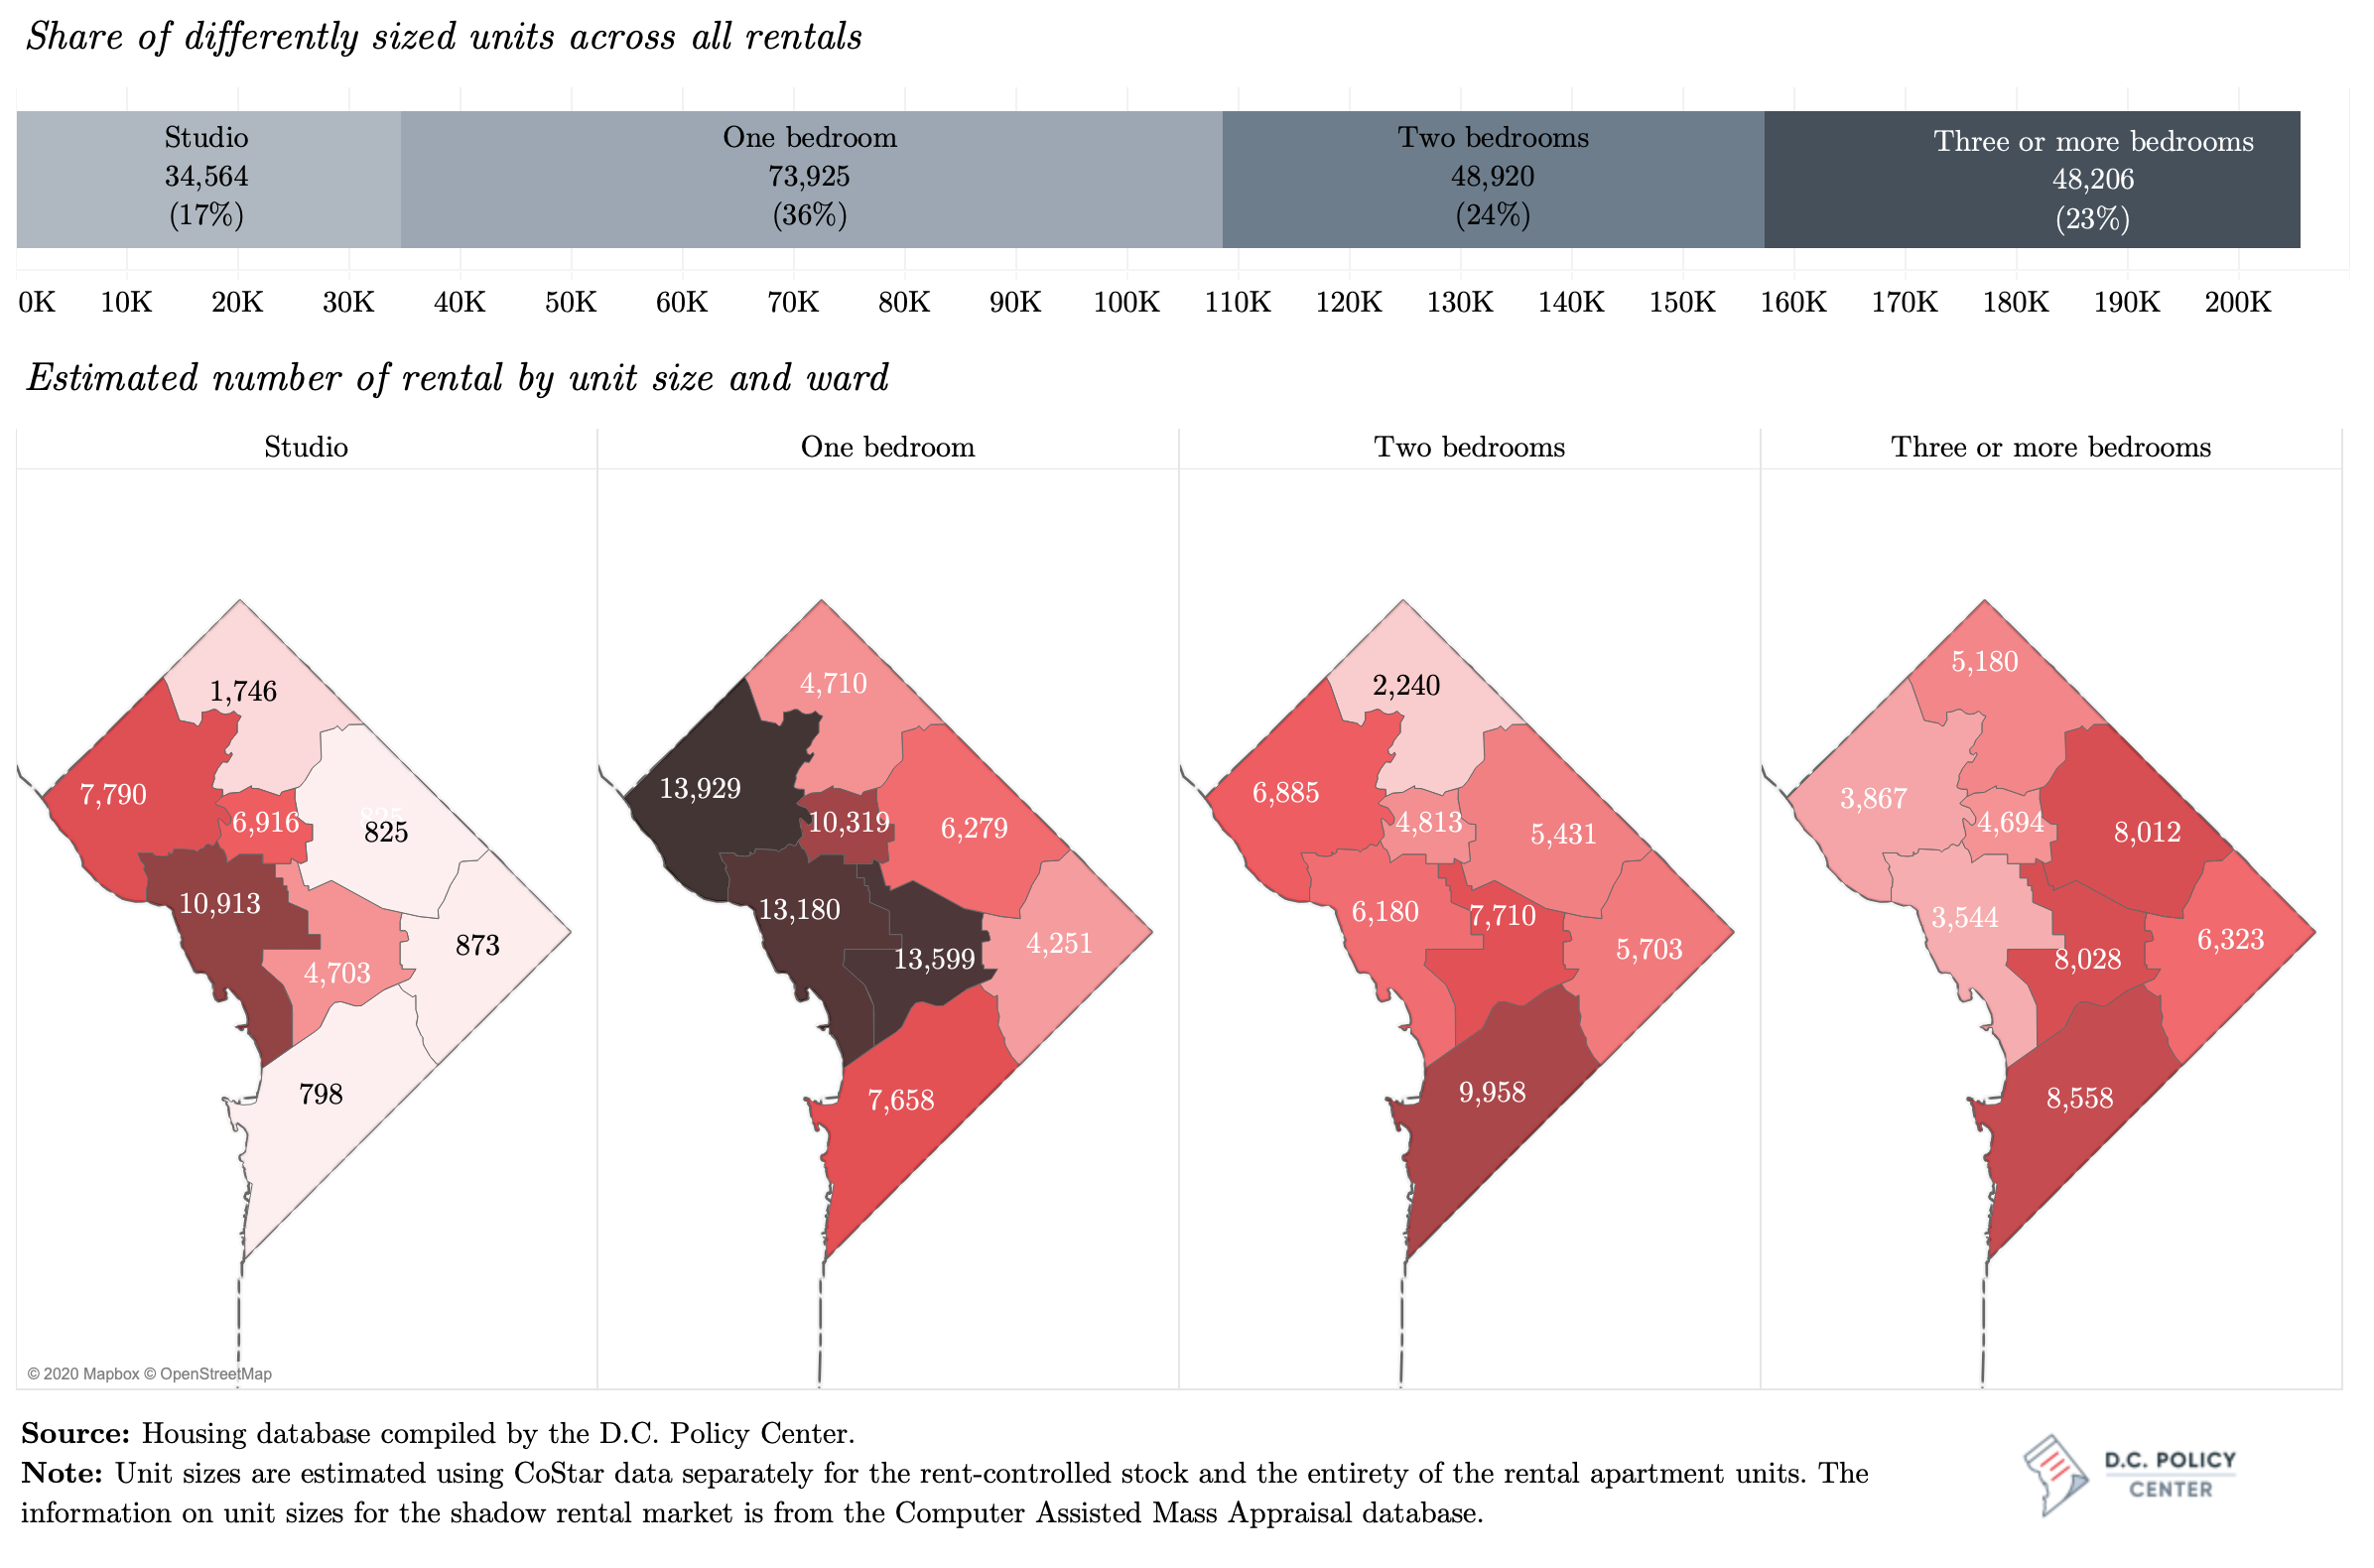
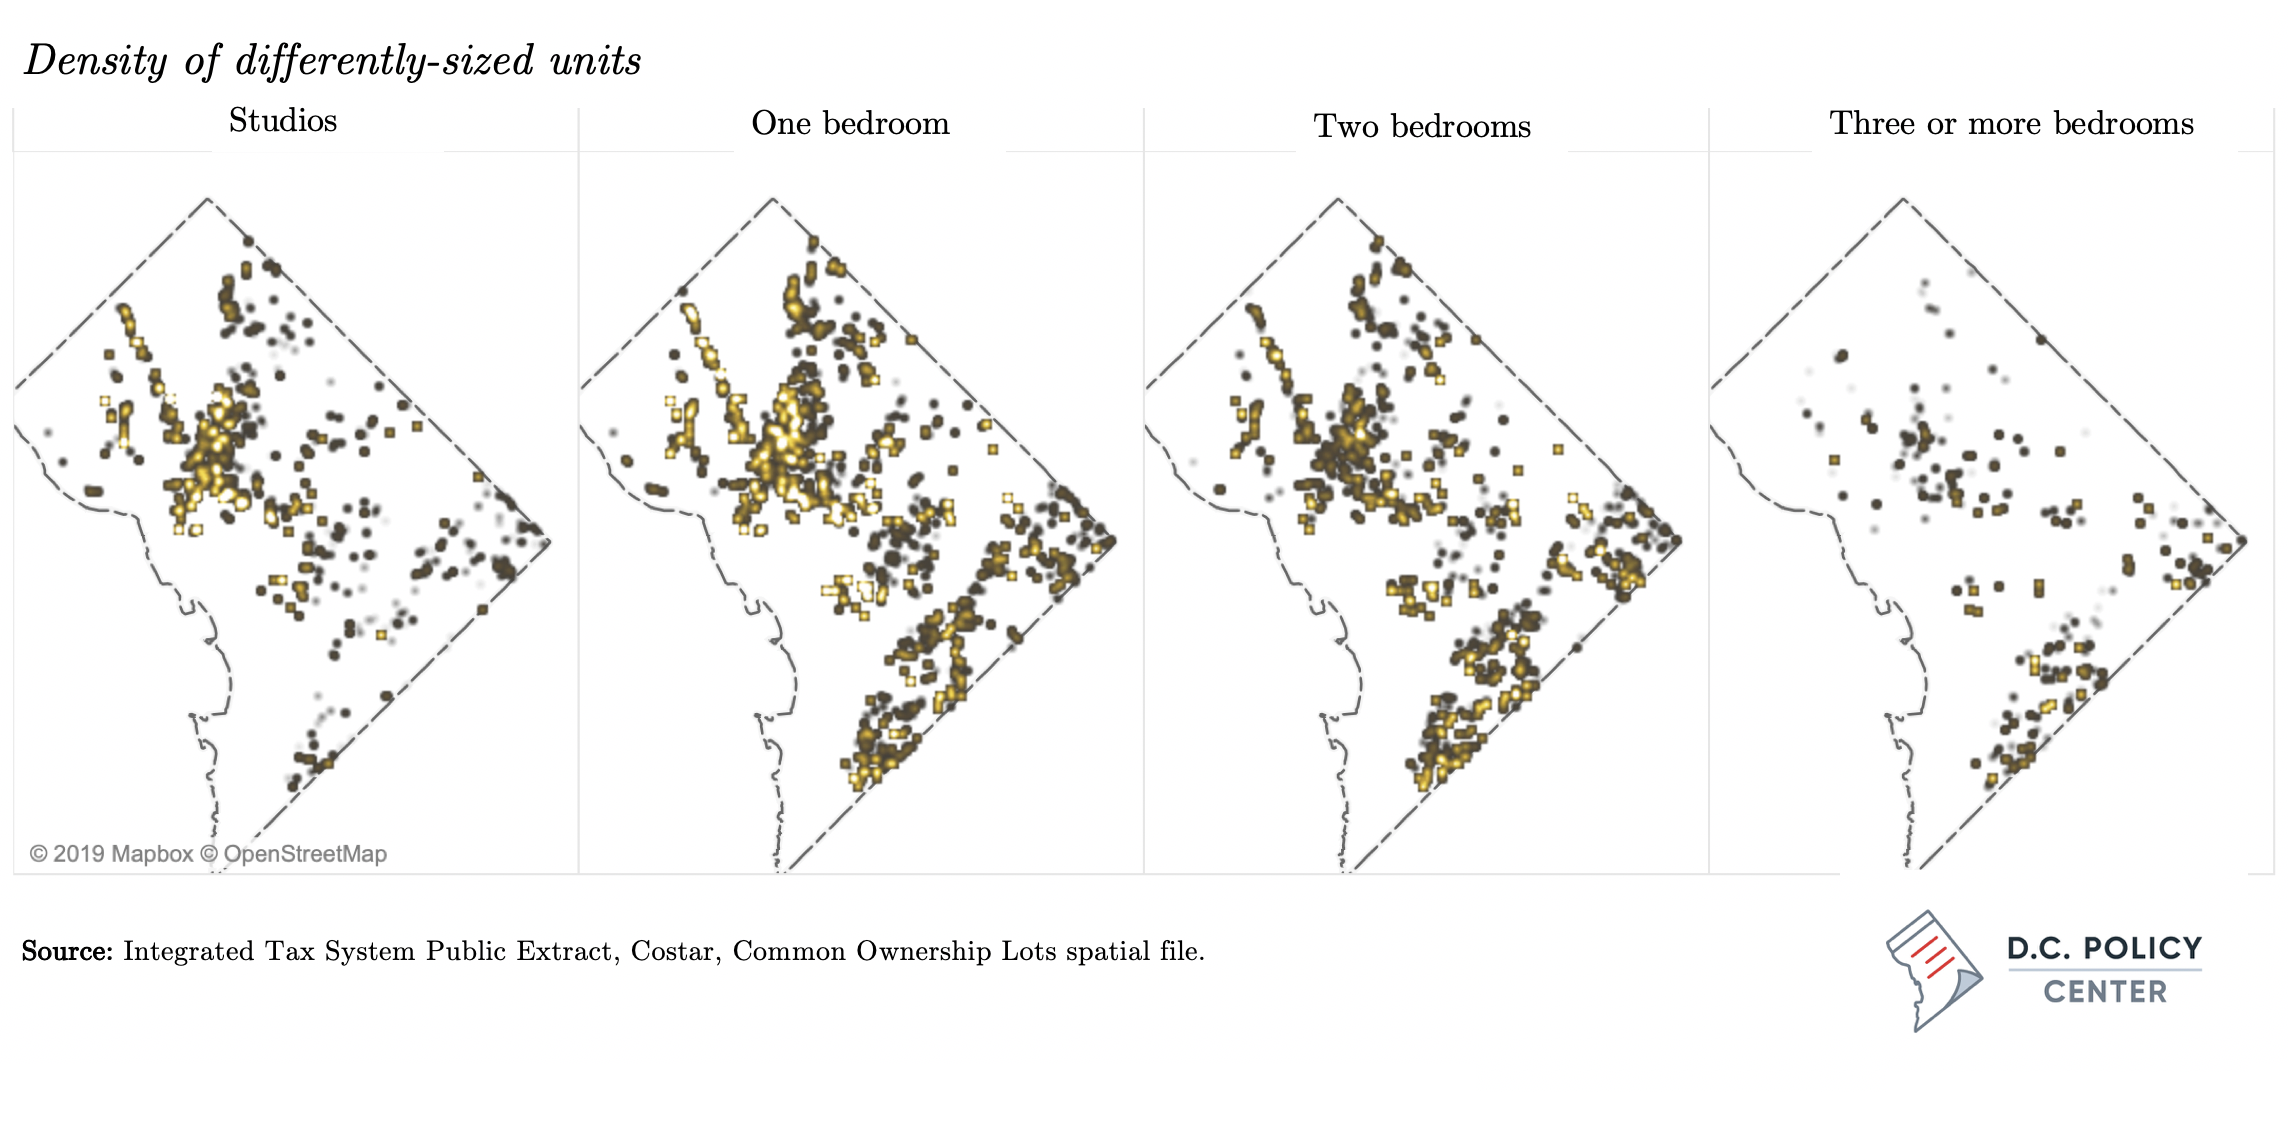
While units in rental apartment buildings tend to be small, the presence of a large shadow rental market means that there is a mix of differently sized rental units in the District.[22] This report estimates that 17 percent of the District’s rental housing (rental apartments and shadow rental units combined) is studios, 36 percent is one-bedroom units, 24 percent have two bedrooms, and 23 percent have three or more bedrooms. These larger units can be found everywhere, but almost always as a part of the shadow rental market.
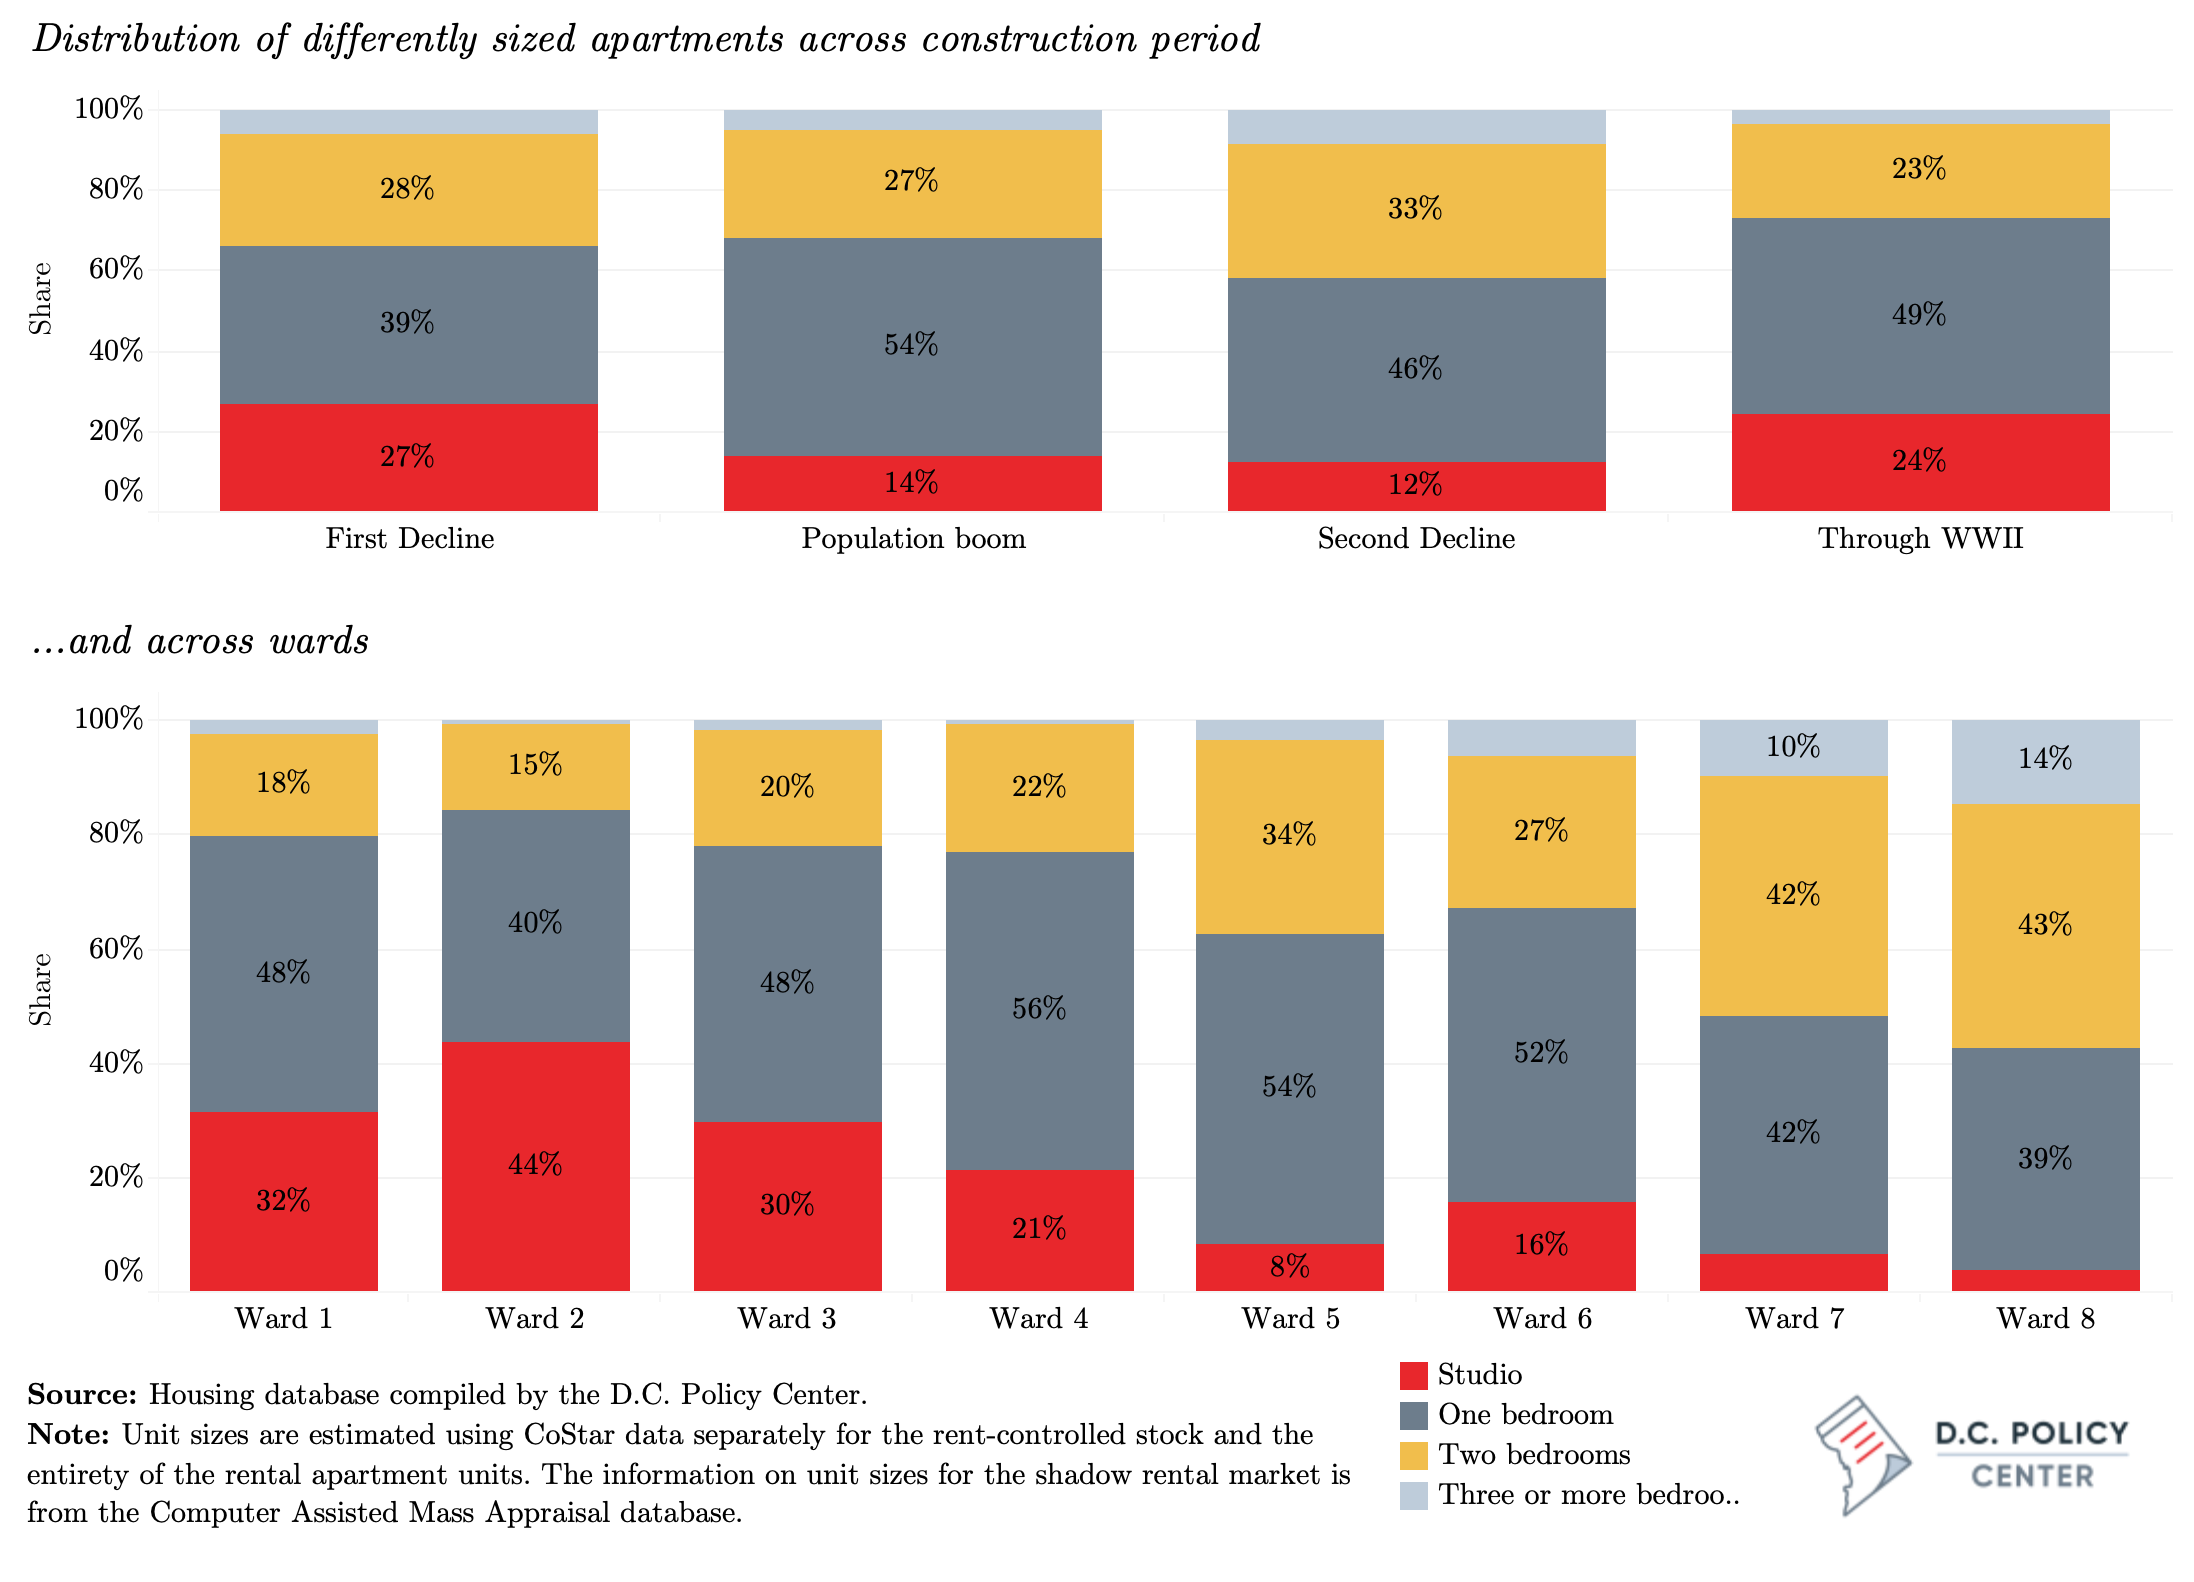
One-bedroom apartments account for nearly half of the city’s rental apartment stock (an estimated 62,250 units), and studios account for another fifth (an estimated 24,900 units). Only 5 percent of rental apartment units in the District of Columbia have three or more bedrooms (an estimated 6,250 units).[23] Furthermore, the share of small units in rental apartment buildings has remained stable over time (around 70 percent of the stock), except for the units constructed during the period of Second Decline: 42 percent of the units built during this period had two or more bedrooms. [24]
Perhaps the biggest change in unit sizes since 2000 is the shift from studios to one-bedroom apartments. Through 1966, it was common to see studios in newly constructed buildings: about one quarter of the units produced then were studios. In comparison, only 14 percent of the units constructed since 2000 are studios, and the majority are one-bedroom units. [25]
Rental apartment units with three or more bedrooms are rare, and typically are found in neighborhoods east of the Anacostia River. In Ward 7, for example, one is twice as likely to find rental apartment units with three or more bedrooms (9.7 percent of the stock in this ward) than the entire city. In Ward 8, such large apartments make up nearly 15 percent of the stock. Studios and one-bedroom apartments are concentrated in central parts of the city. While it is possible to find one-bedrooms everywhere (ranging from 40 percent in Ward 2 to 56 percent in Ward 4), studios are rare in Wards 5, 6, 7, and 8. They are most concentrated in Ward 2 (44 percent of the stock), neighborhoods along Connecticut Avenue, and along 16th Street NW .
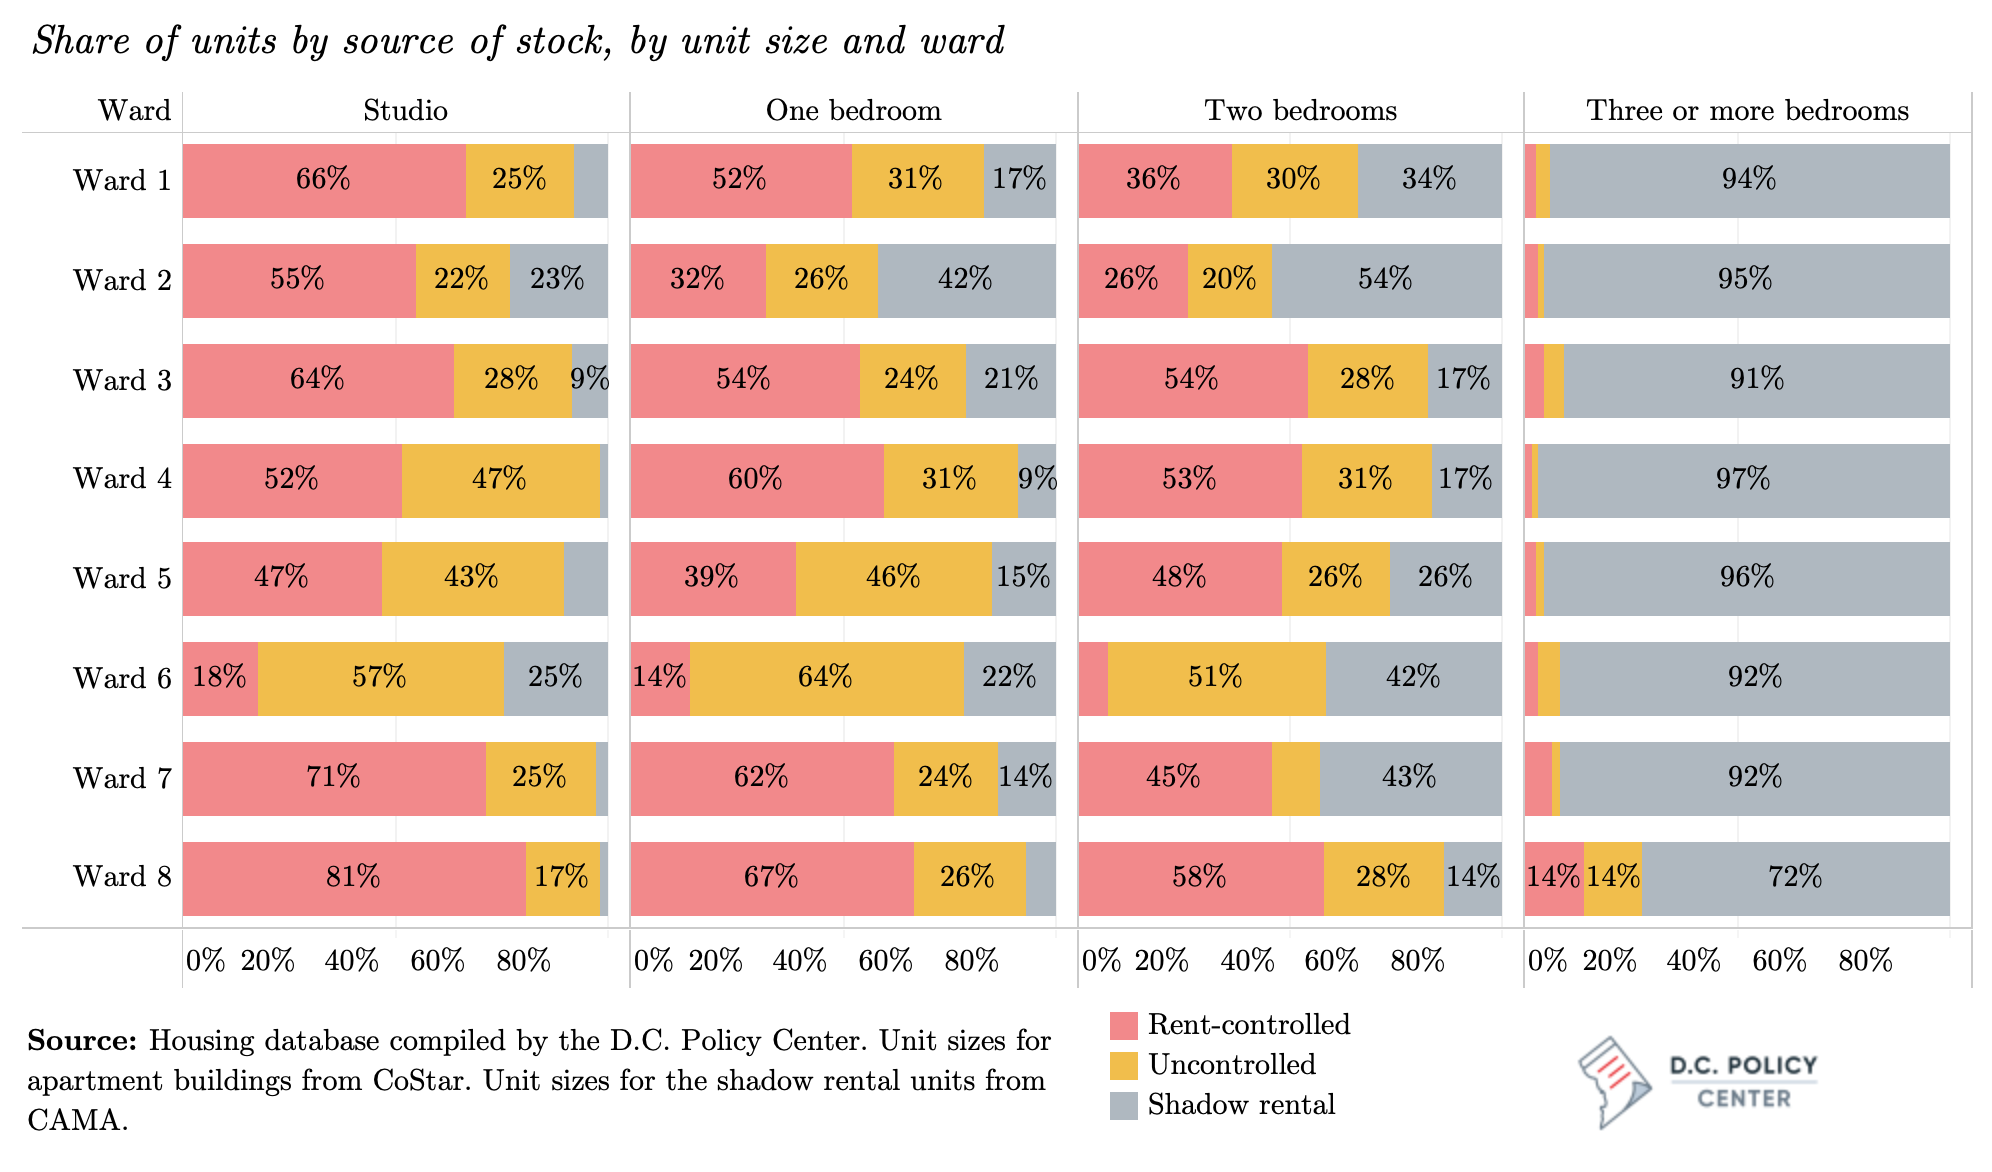
 Rent-controlled apartments tend to have fewer bedrooms than units in more recently constructed buildings. Rent-controlled apartments have a larger concentration of studios (27 percent, compared to 17 percent across all rental apartments) and a smaller concentration of units with two or more bedrooms (29 percent, compared to 32 percent across all rental apartments, and 24 percent compared to all rentals, including the shadow rental market). In all wards across the city, the smaller units (studios and one-bedrooms) constitute over half the rent-controlled stock. The exception is Ward 8, where 57 percent of all rent-controlled units have two or more bedrooms, and over 10 percent of the units have three or more bedrooms.
The shadow rental market fills an important void in the landscape of rental housing in the District by providing larger units with three or more bedrooms that can serve larger households. Over half of the units in the shadow rental market (nearly 42,000 units) have three or more bedrooms, in stark contrast to rental apartment units, where similarly-sized units are only 5 percent of the stock. Across all wards in the city (except for Ward 8), the shadow rental market supplies over 90 percent of rental housing with three or more bedrooms; in Ward 8, this share is 72 percent. In Ward 4, there appear to be only 55 units with three or more bedrooms in rental apartments; compared to 5,310 similarly sized units in the shadow rental market. Furthermore, the shadow rental market supplies over half the two-bedroom units in Ward 2, over one third in Ward 1, and approximately 40 percent in Wards 6 and 7. These distributions of unit sizes matter greatly for inclusion and affordability, as they show that rental apartments, and especially rent-controlled units, offer few options to households of four or more people outside the neighborhoods east of the Anacostia River.
Ultimately, the District’s capacity to create affordability and economic inclusion through its rental stock depends on rents, which is the focus of chapter three.
You’ve reached the end of Chapter 2.
<< Back: Chapter 1 | Next: Chapter 3 >>
Or return to the main publication page.
Notes
[1] This estimate excludes 3,276 units owned by institutions such as churches and universities, the federal government, and foreign governments. With these all combined, we estimate the total number of housing units to be 326,000.
[2] Presented here is the number of properties (single-family units and condominiums) that qualified for the District’s homestead exemption, and 11,000 units in cooperative buildings, which are not coded for homestead deduction in administrative files but are almost always occupied by their owners DC Cooperative Housing Coalition, “Co-Ops 101: Cooperative Housing Ownership in Washington, DC,” (Washington D.C., 2012).
[3] This number is qualified as a “potential” figure, as it might include homes owned and occupied by those not domiciled in the District or vacant units. The American Community Survey estimates that nearly 116,000 housing units (38 percent of all housing units and 41 percent of the occupied housing units) are occupied by their owners. It also projects that the vacancy rates in rental housing is at about 10 percent.
[4] Regardless of unit type, a landlord who owns five or more units in a building built before 1975 is also subject to rent control.
[5] Department of Housing and Community Development, “What You Should Know About Rent Control in the District of Columbia” (Washington, D.C., 2018).
[6] Since then, the District added 24,000 more such units, mostly condominiums. For details, see Yesim Sayin Taylor, “Tax Practices That Amplify Racial Inequities: Property Tax Treatment of Owner-Occupied Housing,” (D.C. Policy Center, 2018).
[7] In fact, comparing 2006 and 2019 (not just tracking the same house but looking at the whole stock) we find that the share of all housing units in the rental stock increased from 31 percent to 36 percent, and that this has been entirely driven by the growth in the number of rental condominiums (and the rate at which their owners let them).
[8] This estimate is based on the initial year of construction, as recorded in the Computer Assisted Mass Appraisal datasets. Many of these buildings have undergone significant enough renovations to be recorded in assessment histories.
[9] D.C. Policy Center researchers found another 11,000 units that were characterized as rental apartments in 2006 and reclassified as flats in 2019. This may be an administration reclassification rather than a true conversion; so, we left them out of the analysis. Of this group, only 821 were shown to be owner-occupied in 2019, so this change did not have much impact on the rental stock.
[10] Carolyn Gallaher, The Politics of Staying Put: Condo Conversion and Tenant Right-to-Buy in Washington, DC (Temple University Press, 2016).
[11] The source for these numbers is data provided to the author by the Department of Consumer and Regulatory Affairs.
[12] Derek Hyra, “Book Review – Carolyn Gallaher 2016 – The Politics of Staying Put: Condo Conversion and Tenant Right-to-Buy in Washington DC, Temple University,” International Journal of Urban and Regional Research 41, no. 2 (2017): 366–67.
[13] It is very difficult to analyze the existing TOPA data to effectively evaluate the outcomes. The Department of Housing and Community Development keeps track of TOPA notices, but the outcome – whether the building has been sold or not, or whether the tenants took over the building through a sale—is not tracked. An analysis of TOPA notices from DHCD’s Rental Conversion and Sales Division for January 1, 2017 to October 21, 2019 (obtained from the Urban Institute) shows that the city received 7,348 TOPA related notices required by law on 4,168 properties. Of these, it appears that 782 properties received a response from the tenants. Of these, we cannot ascertain the size of 23 of the properties. Among the remainder, 374 were single-family homes, 244 were two to four units, and 141 were five or more units.
[14] David Rusk, “Thermometer of City Health: Count Households, Not Noses,” (D.C. Policy Center, 2017).
[15] Included in this count are approximately 175 buildings with nearly 5,000 units for which we could not find a date of construction.
[16] These are rent-controlled units in apartment buildings only. Rent control laws apply to landlords—for example, those who own more than five units in a condominium building; but we have no reliable way of estimating how many units fall under this criterion. But this number does not appear to be high: here are 38,500 rental units in multi-family buildings other than rental apartment buildings, and only 766 of them are in buildings with more than five units.
[17] Margery A. Turner, Housing Market Impacts of Rent Control – The Washington D.C. Experience, (Urban Institute, 1990).
[18] Accounts from newspaper articles from the time put the number of potentially rent-controlled units at 120,000, but without specifying the source of this information. A Washington Post article titled “Lines draws in the D.C. rent control battle” by Kenneth Bredemeier, published on March 17, 1985, reports the existence of 120,000 apartments under rent control, but provides no source for this information.
[19] Margery A Turner, “Rent Control and the Availability of Affordable Housing in the District of Columbia: A Delicate Balance” (Urban Institute, 1988).
[20] Developed using information Lusk’s District of Columbia Apartment Directory for 1990.
[21]Although these comparisons are always difficult since housing market conditions are significantly different across these jurisdictions. We thank Elissa Silverman for this point.
[22] Data on unit sizes in rental apartment buildings are not publicly available. This section uses data compiled by CoStar, which show that most rental apartments are small—studios or one-bedrooms—regardless of the period when they were built. Of the 3,121 apartment buildings, there is information on the size of units for only 1,363 buildings, but these collectively account for 101,872 units (or 80 percent) of the rental apartment units in the District. Computer Assisted Mass Appraisal records do not provide any information on the unit sizes in rental apartment buildings, but have this information for single-family homes, condominiums, and conversions.
[23] The American Community Survey, on the other hand, finds only 162,190 rental units in the District, regardless of the type of unit. According to their count, of these, 13 percent are studios, 42 percent are one-bedroom units, 40 percent are two- or three-bedroom units, and slightly less than 5 percent are four-bedroom units.
[24] As noted previously, this is also the period in which the fewest units were built, and more of them were owned or tax exempted by the D.C. government (about one quarter of units).
[25] As such, while the common perception is that recently built units are smaller in square footage, median size has slightly increased from 682 square feet (for units built through World War II) to 764 square feet (for units built after 2000). It is possible that one-bedroom apartments built today are smaller than one-bedrooms of the pre-1946 period, but because there are more of them, and they are bigger than studios, the average size is larger. For details see the Methodology Appendix.