
Even prior to the pandemic, the District was experiencing decelerating population growth, including among the young, educated adults who have traditionally driven growth in the city. Now, the ability to telework may be driving some workers out, particularly those that are well-educated and aged 25 to 34. While it is uncertain whether these moves are temporary or permanent, maintaining and retaining a net inflow of young adult workers is crucial to any city’s ability to attract new businesses, as well as ensure strong fiscal health.
The COVID-19 pandemic has changed how people interact with urban areas. With the rise in telework, many urban residents have looked to suburbs or smaller metropolitan areas for more space or cheaper housing. While these shifting preferences present new challenges to the District of Columbia, even before the pandemic, D.C. was experiencing decelerating population growth. While the District’s growth was once driven by the influx of young adults moving in, this growth has slowed down. Now, the pandemic has driven young and well-educated adults out at historic levels. This population is important to the District’s tax base, and if these moves become permanent, the city will lose out on the benefits of their productivity, value to employers, and income growth as they advance in their careers. Attracting and retaining young adult workers is a key part of upholding the District’s competitiveness and ensuring economic growth in the future.
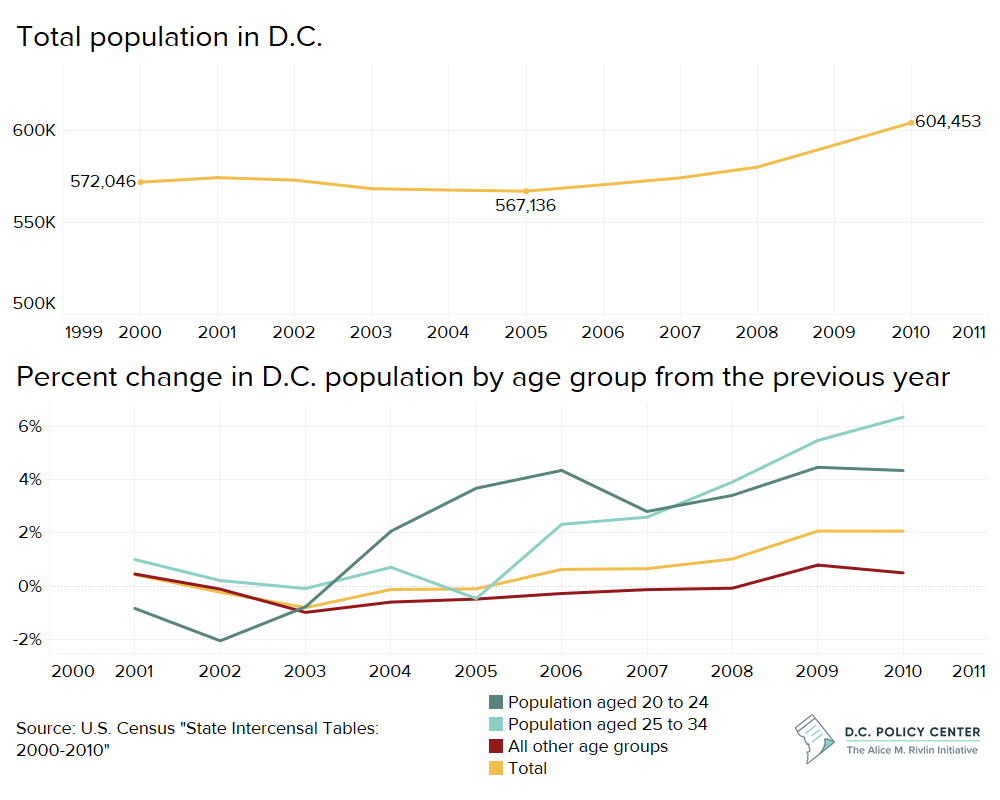
Since the early 2000s, D.C.’s growth has been driven by young adults moving into the city. However, even before the pandemic, this picture was beginning to change.
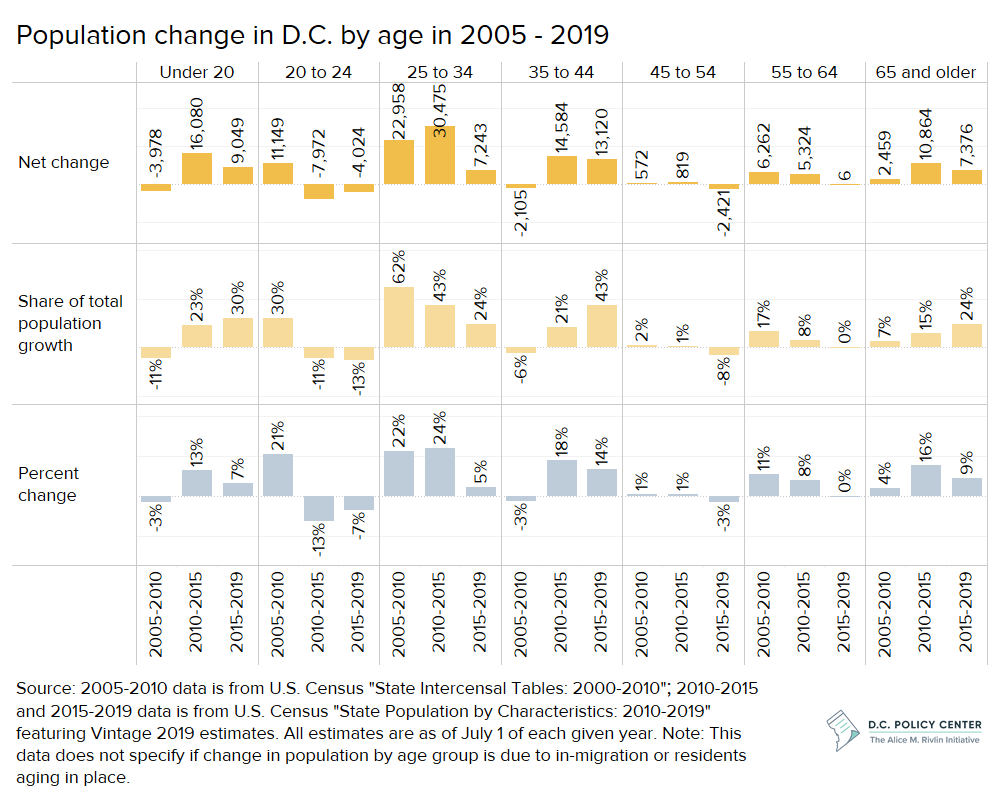
In 2006, the District began to see consistent population growth, and much of that growth could be attributed to young adults1 moving to the city. Between 2005 and 2010, D.C gained 37,317 net new residents, 62 percent of whom were in the 25 to 34 age group, and another 30 percent of were in the 20 to 24 age group.2
This influx of young adults into the District had a domino effect across the city. A few years later, the younger school-age population began to rise, leading to a spike in public school enrollment. And, as the incoming young adults formed new families, demand for single-family housing also increased, leading to a rise in property values.3 The resulting new household formation then led to a steady growth of new tax filers through 2013, even when total taxable income fell through the Great Recession.4
However, in the most recent decade, these trends have begun to shift. Between 2015 and 2019, the District gained about 30,349 residents, only 24 percent of whom were in the 25 to 34 age group, a much lower share compared to earlier years. The population change by age in this period was most concentrated in the 35 to 44 age group, which accounted for 43 percent of net population growth. The increasing growth rate of the 35 to 44 age group between 2015 and 2019 indicates that at least some of the young adults aged 25 to 34 who moved to District in the early 2000s stayed. However, during that period, fewer young adults were moving into the city than in previous years. While the population of young adults aged 25 to 34 continued to grow between 2015 and 2019 and, as of 2019, this group continued to account for the greatest share of the city’s population at 23 percent, the growth of residents aged 25 to 34 has been occurring at decelerating rate.5
And, since 2018, the main source of population growth shifted from net in-migration to natural growth (births minus deaths).6 As a result, the District has observed a stagnant growth in tax filers with fewer new households migrating to the city.7
Decelerating total population and young adult population growth rates are not unique to the District.8 However, in order to stay competitive and bring in new businesses, it is important to attract and retain young adults, particularly those who are well-educated. In the District, the majority of young adults are already well-educated: 65 percent of residents aged 25 to 34 in 2010 had a bachelor’s degree or higher; in 2019, this number rose to 74 percent.9 This age group is also the most mobile. As explained in “The Young and Restless and the Nation’s Cities”: Well-educated people drive innovation and productivity,10 and where people decide to live in their twenties has long-term economic consequences. The average 35-year-old is less than half as likely to move between states than the average 25-year-old. This is because the willingness and ability to move fall with age, so where someone lives in their early thirties often determines where they will be throughout the rest of their time in the workforce.11
In the analysis below, we use the 2020 American Community Survey (ACS) 1-year Public Use Microdata Sample (PUMS) from the U.S. Census. Due to the impact of the COVID-19 pandemic on the survey process, this data has nonresponse bias, meaning those that responded had significantly different social, economic, and housing characteristics from those who did not respond. This has resulted in an undercounting of certain groups, such as renters or lower-income residents. Thus, this data should be interpreted with caution and should not be compared to previous ACS data or the decennial census. For more information, visit the Census’s website.
With the rise of teleworking and shifting preferences in the wake of the COVID-19 pandemic, the District’s demographics continue to shift, and the city is at even greater risk of losing its young professional population.
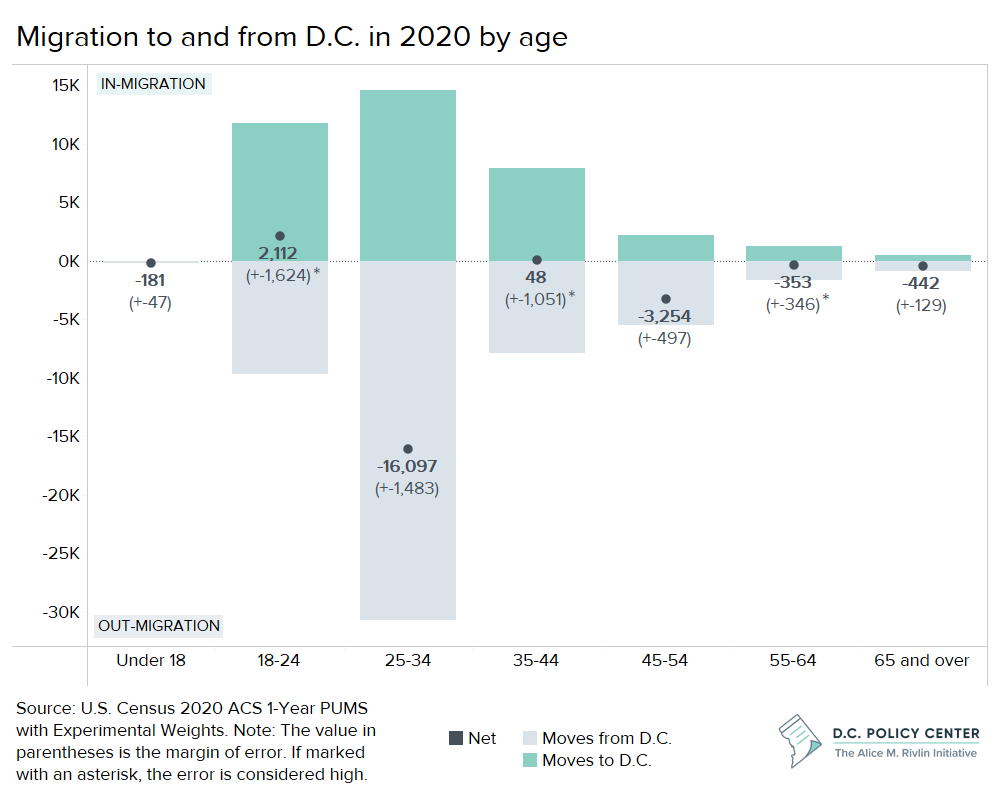
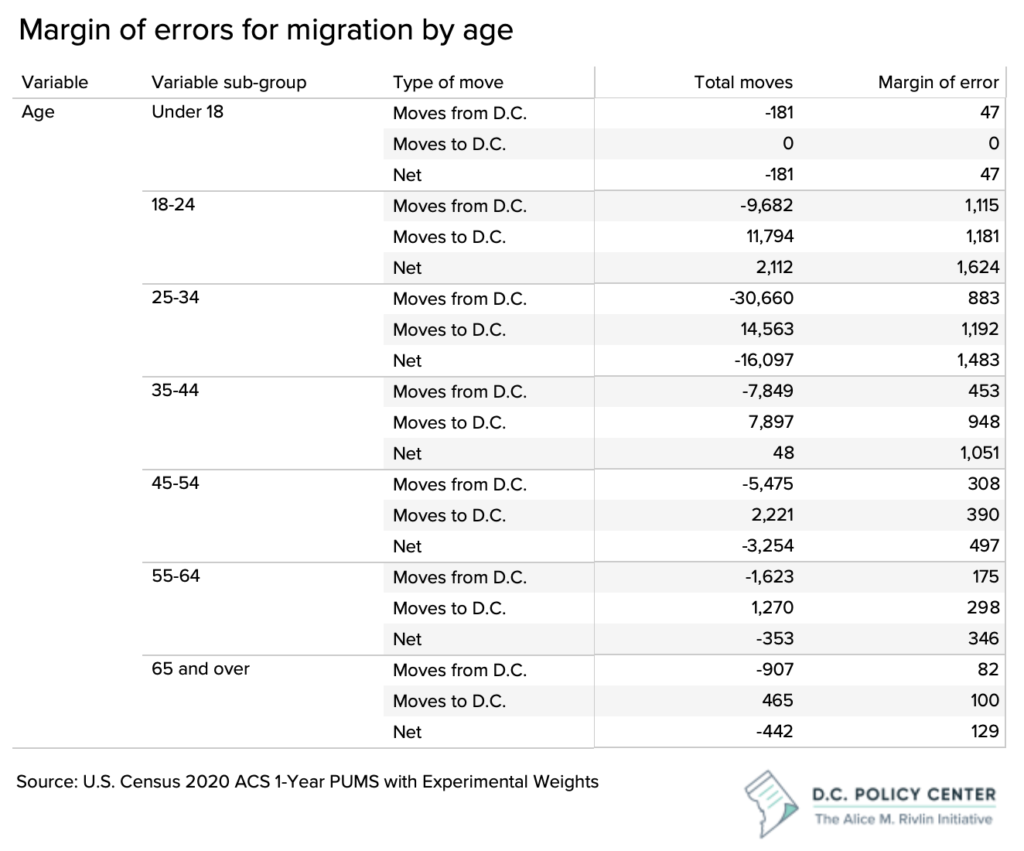
In the first year of the pandemic, the largest population group that left the District was young, educated adults. Of the residents who moved out of the District in 2020, 54 percent were aged 25 to 34.12 The city’s outflow of residents in this age group was greater than the inflow, resulting in a net loss of 16,097 residents aged 25-34,13 or 89 percent of the city’s net population loss.14 This is a relatively large share considering this group accounted for 23 percent of the city’s total population in 2019. Even when accounting for some of the relatively high margins of error in the data, the greatest loss in residents by age group is still those aged 25 to 34.15
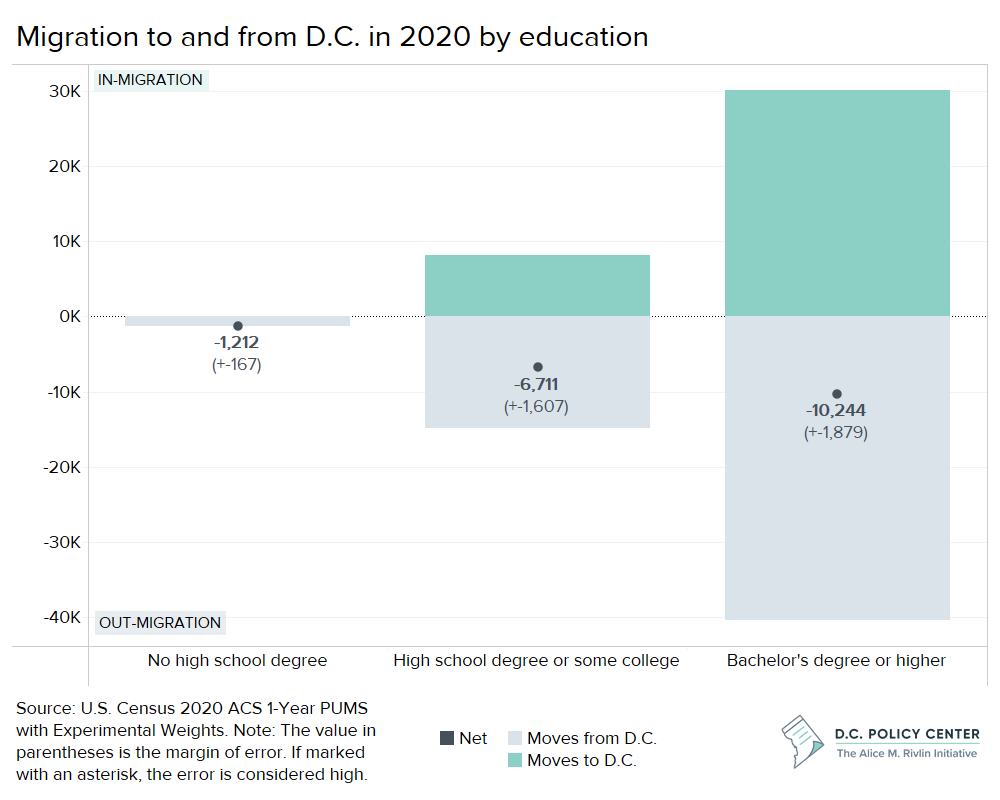
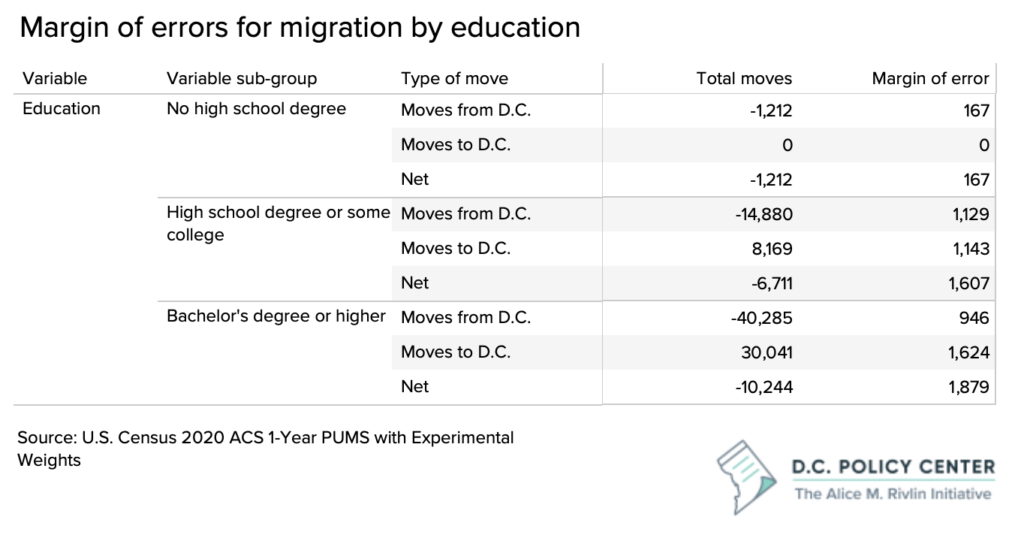
Migration data by educational attainment show that nearly 71 percent16 of those who moved out of the District held a bachelor’s degree or higher, resulting in a net loss of 10,244 residents17 in this group. A closer look at this data shows that an estimated 61 percent18 of those who moved out of the District and held a bachelor’s degree or higher were also aged 25 to 35; thus, we can assume that the bulk of out-migrations from the District were young, well-educated adults.
In addition to the loss of young, educated adults, the District experienced a loss of workers in some of its most prominent industries.
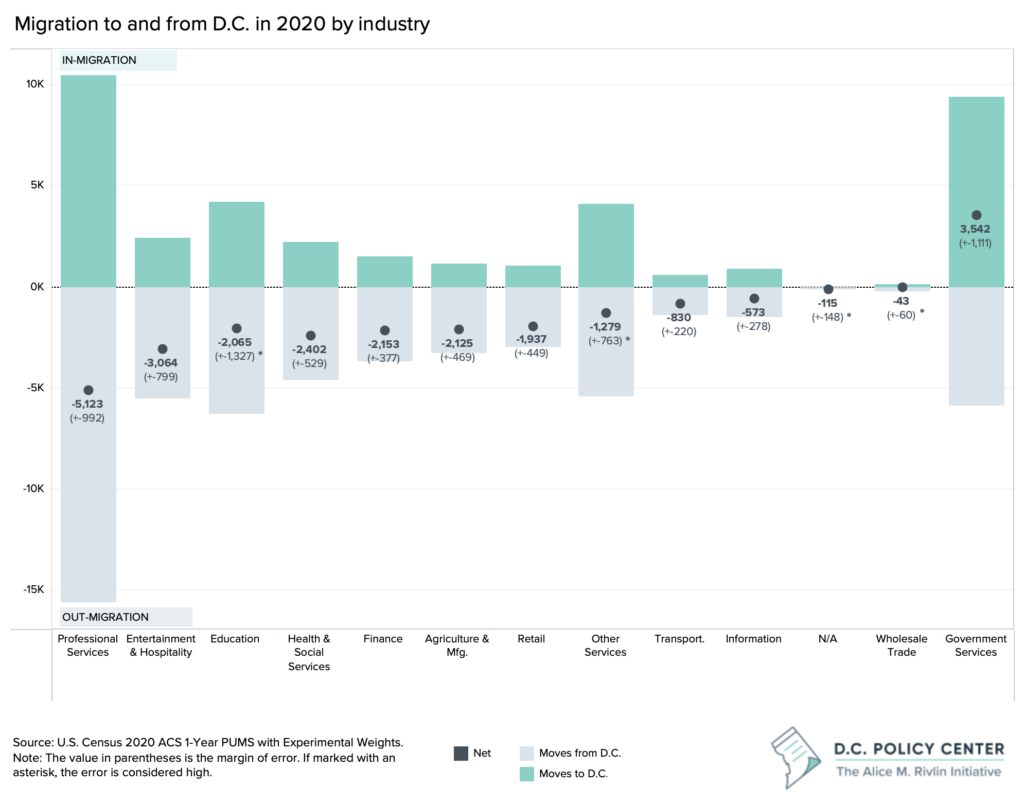
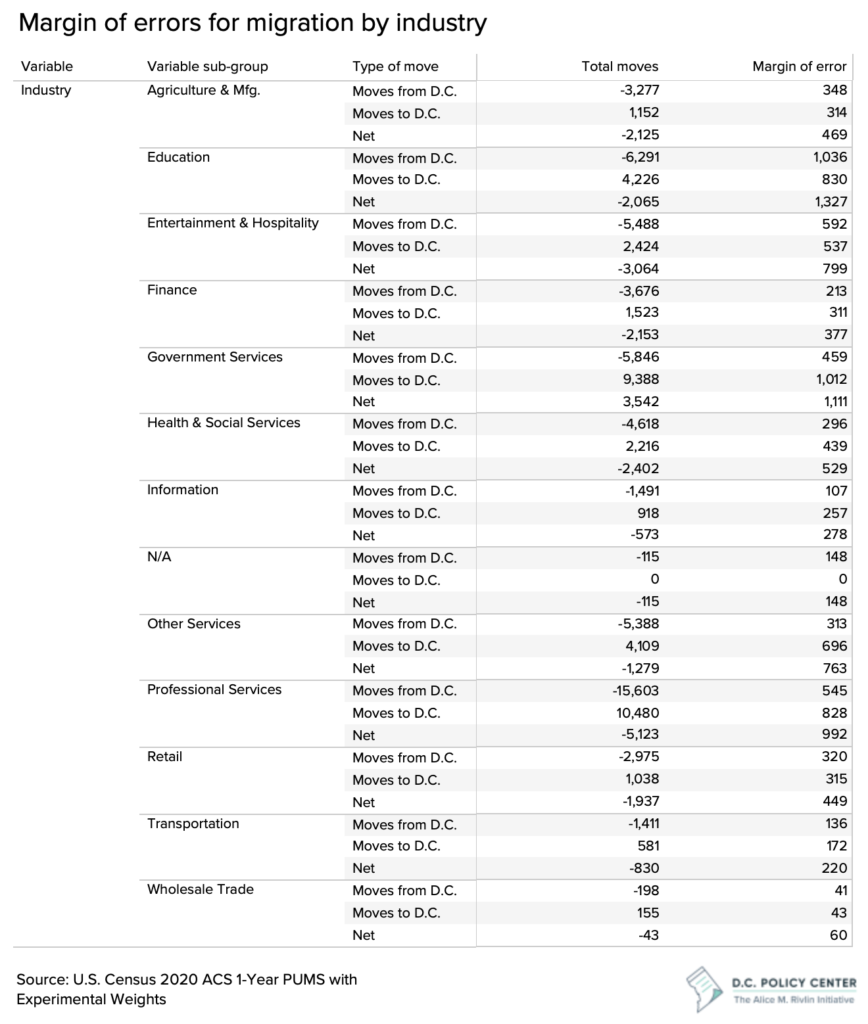
Residents who work in professional services, one of the District’s largest industries, accounted for 28 percent19 of moves out of the District in 2020, as well as 28 percent20 of the District’s net population loss. The next largest loss was of residents working in the entertainment and hospitality industry, accounting for 10 percent21 of all movers out of the District and 17 percent22 of the District’s net population loss.23
Entertainment and hospitality workers were hit particularly hard by the pandemic, as many lost their jobs when the economy came to an abrupt stop at the beginning of 2020. One explanation for the District’s loss of these workers is that they moved elsewhere to find new jobs or less expensive housing.
On the other hand, professional service jobs are typically office-based, which means they can more easily shift to a remote work environment. It is likely that many workers in professional services left the city when their jobs transitioned to remote work, either in search of more space, less expensive housing, or to avoid dense areas. It is this group that poses the greatest risk to the District’s future economic recovery.
Researchers found that urban areas with more high-skill residents (such as those with a bachelor’s degree) and higher work-from-home numbers saw larger declines in visits to local businesses and larger population outflows. Consequently, service workers in large cities lost more hours per worker than those in rural areas.24 A long-term loss of office workers would not only devastate the city’s service industry, but also lead to a continued decline of commercial property, sales tax, and income tax bases. Already, there has been a decline in the assessed value of office properties in every ward, and office vacancy rates have hit historic highs in downtown D.C.25
The outflow of office workers, young adults, and commuter activity puts the District’s income tax base at risk.
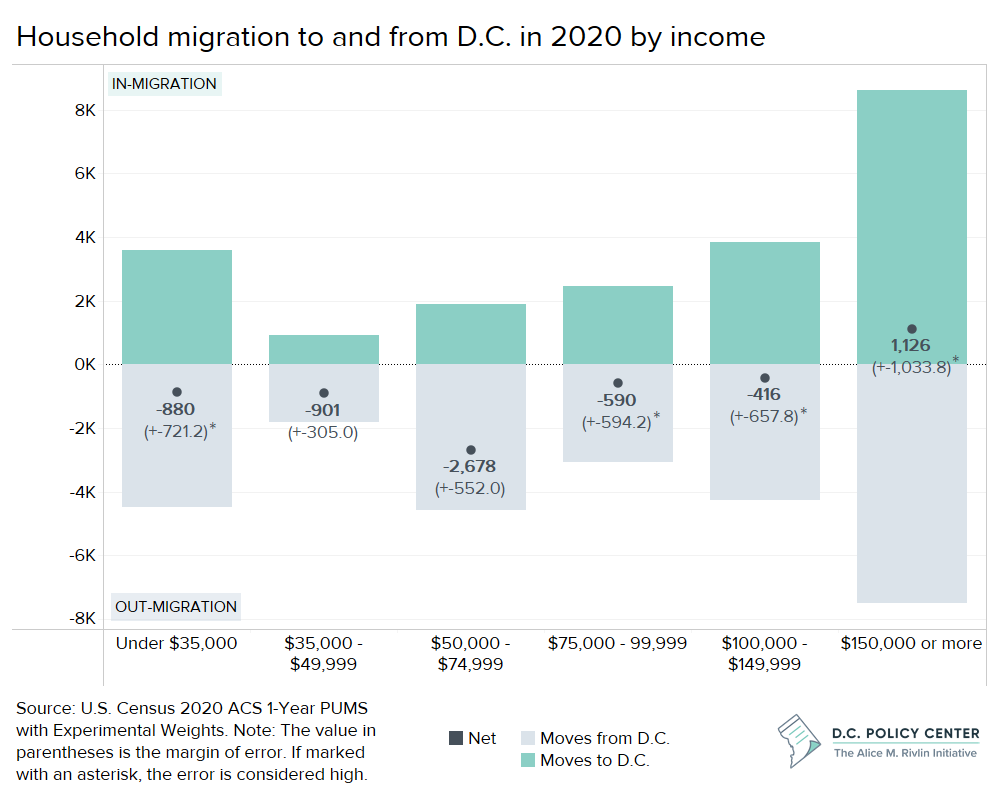
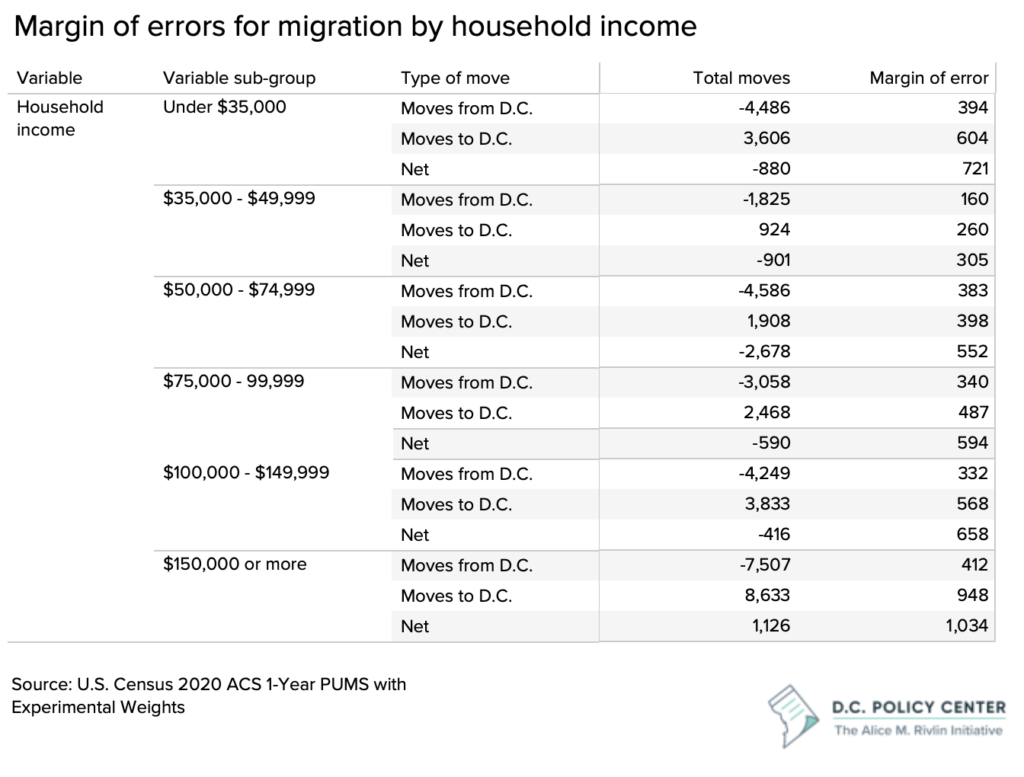
The District’s relatively large losses in young, well-educated adults and office workers are reflected in the loss of middle-income households. The city has seen the greatest decline in households earning between $50,000 and $75,000 annually, with these households accounting for 18 percent of households that have moved out of the city,26 and 62 percent of the District’s net loss in households.27 This data should be interpreted with caution, as four of the six income groups used in the analysis have high margin of errors. However, the loss of middle-income households still signals a potential risk for the District.
Not only is there an initial loss in the city’s income tax base, but these middle-income households likely have strong income growth potential that will be realized elsewhere (an assumption based on the fact that most of the District’s population loss was concentrated in young, well-educated adults). And, these workers, assuming they are in jobs that can easily shift to remote work, hold an outsized share of spending power: an estimated 37 percent of jobs in the U.S. can be performed entirely at home, but those jobs account for 46 percent of all wages.28
While it is difficult to determine with certainty why these residents moved out of the District, past data suggest that housing and work-related reasons are likely explanations.
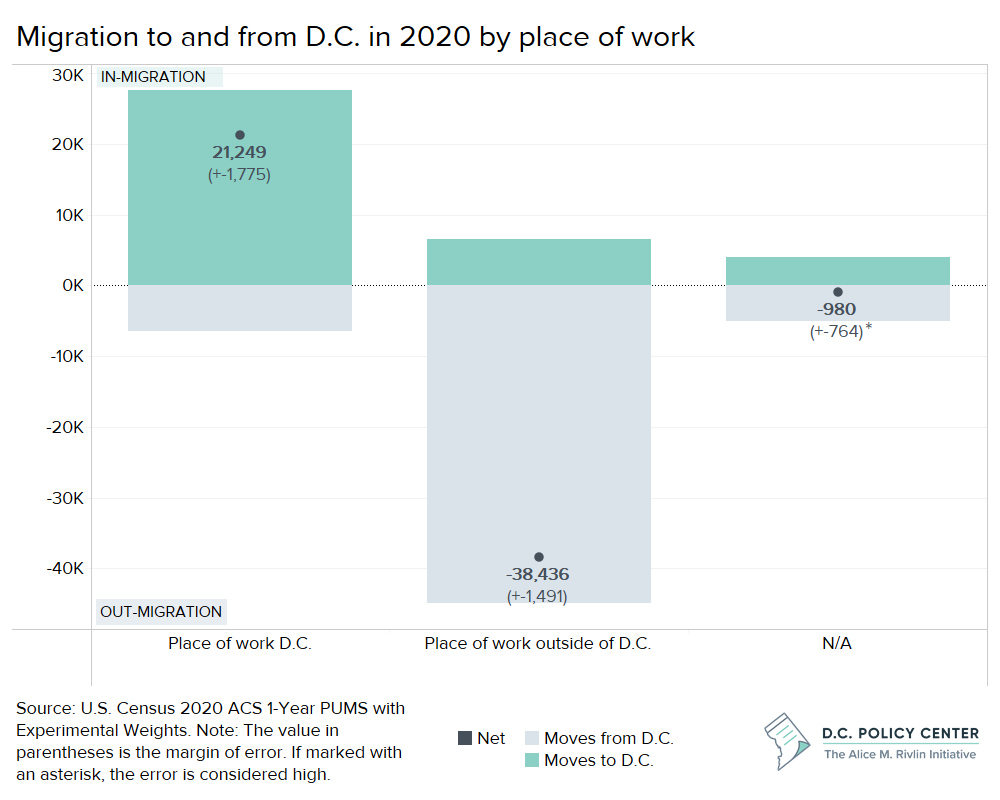
Even prior to the pandemic, it was difficult to determine why households move and whether those moves are permanent. Current Population Survey (CPS) data suggest that between 1999 and 2021, the most common reason that households moved out of the District, at 17 percent of households, was for a ‘new job or job transfer’.29 The 2020 migration data tell a similar story: 80 percent of residents30 who moved out of the District also held jobs outside of the city. On the flip side, workers also move to the District to follow their jobs. In 2020, the city experienced a net gain in workers who hold jobs within the city.
Those who did not move for work likely moved for housing-related reasons. The CPS data suggest that after moves for a ‘new job or job transfer’, the most commonly-cited reasons for households leaving the District are for ‘new or better housing’ at 13.8 percent of households31 or for ‘other housing reason’ at 10.3 percent of households.32
Households could be searching for more space or less expensive housing. Recent research that uses credit card information to track domestic migration estimates that out-migration from the D.C. metropolitan area into lower cost, smaller metropolitan areas has increased by 8.6 percent since the beginning of the pandemic.33 This trend may, in part, be attributed to the declining importance of commute times as remote work becomes more prominent.34 If workers can find cheaper housing with more space outside of the city, they may be more inclined to do so if their jobs are no longer tied to a specific location.
There was also a spike in the number of adults living with a parent or grandparent. Zillow researchers found that the number of adults living with a parent or grandparent was up by 9.7 percent in April 2020 compared to April 2019, hitting an all-time high.35 The pandemic caused widespread job loss and uncertainty, which may have pushed these adults to move back in with parents or grandparents. The risk is that if their moves become more permanent, the connection between where people live and where people work weakens.
On the bright side, USPS change of address data suggests that at least some of the moves out of the District in 2020 will be temporary. In 2020, 29 percent of net moves out of the city were listed as temporary on the USPS change of address form, up 28 percentage points from 2019. However, the total number of permanent moves also increased from 2019 to 2020, indicating that while many of the moves from the city are temporary, there was still a relatively high outflow of people from the District in 2020.36 USPS change of address data also shows that as of May 2021, permanent net moves out of the city were back to pre-pandemic levels.37 This indicates that the worst of the city’s population loss due to the pandemic is likely over, but that the District is still at risk of continued low or stagnant population growth in the future.
Maintaining a net inflow of young adult workers (and retaining them) is crucial to attracting new businesses, as well as ensuring strong fiscal health in the long term.
Even prior to the pandemic, the District was experiencing decelerating population growth, particularly among the young, educated adults who have traditionally driven growth in the city. While it is unknown whether these moves are temporary or permanent, there are long-term risks associated with the loss of these groups. As the District loses young, educated workers, the benefits of their productivity, value to employers, and income growth as they advance in their careers will be realized elsewhere. The ongoing COVID-19 pandemic makes it more challenging for the city to attract and retain residents and workers. The ability to telework may drive some workers out of the District, particularly in search of more affordable housing or more space.
This is a reality that the city will need to adapt to. A hybrid work environment is likely to continue, and even in the pandemic’s third year, workers remain hesitant to return to the office. Prior to the Omicron variant, less than a third of District workers had returned to the office.38 Employers are also offering increased flexibility with many large employers, such as PwC, Deloitte, Google, and KPMG, announcing a permanent shift to work-from-home.39 Not only this, but workers currently have high bargaining power due to a historic high level of job openings.40
The city will need to adapt to this shift in preferences and flexibility among workers. One response would be to focus on policies that maximize employment and attracting new companies to the District. However, this alone might not be enough if people do not follow jobs to the extent that they did in the past. These policies should also be paired with sound employment benefits, a shift to sectors with a higher presence of workers, increased placemaking downtown, and a focus on ensuring there is the right type of housing to accommodate these workers.
Data and methodology
The Census data presented above should be interpreted with caution. As previously stated: We use the 2020 American Community Survey (ACS) 1-year Public Use Microdata Sample (PUMS) from the U.S. Census. Due to the impact of the COVID-19 pandemic on the survey process, this data has nonresponse bias, meaning those that responded had significantly different social, economic, and housing characteristics from those who did not respond. This has resulted in an undercounting of certain groups, such as renters or lower-income residents. Thus, this data should be interpreted with caution and should not be compared to previous ACS data or the decennial census. For more information, visit the Census’s website.
All person-level migration data (all variables analyzed, except migration by income) is filtered to include only non-armed force residents in the labor force. The reason for this is to filter out those that may be moving for retirement or other purposes, as well as to keep the focus on how migration is impacting the city’s workforce not just population.
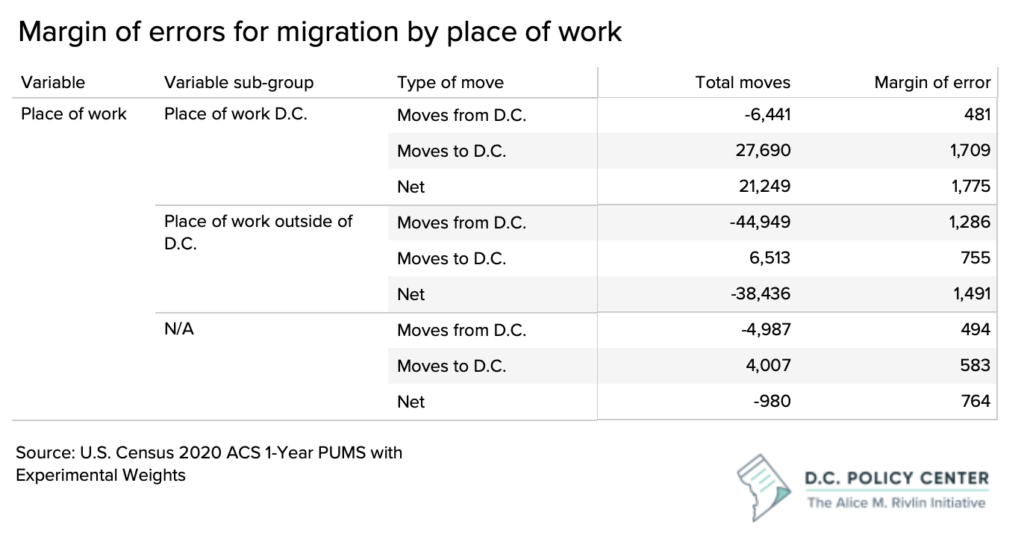
All margin of errors were calculated at 90 percent confidence level and according to Census guidelines. Errors on proportions or net calculations were calculated using the formulas presented in Chapter 8 of the 2018 ACS General Handbook. Errors on all other values were calculated using the successive difference replicate (SDR) method using replicate weights, according to Census guidelines for the use of 2020 PUMS data. We considered an error ‘high’ if it was at least half the value of its data point. A full table of errors is included below.
Endnotes
- Throughout this piece, we refer to those aged 25-34 as ‘young adults’.
- U.S. Census State Intercensal Tables: 2000-2010. Note: The data doesn’t specify if residents by age group are new residents or if they are residents that aged into that group since the last Census.
- The school-age population (ages 5 to 17) grew by 9 percent from 2010 to 2017, and in the same period, public school enrollment from pre-kindergarten to grade 12 grew by 20 percent. Citywide, total assessed real value of single-family homes increased by 8.7 percent from 2010 to 2018. Coffin, Chelsea (2019). “D.C.’s disconnect between enrollment growth and neighborhood change.” D.C. Policy Center, Washington, D.C.
- Sayin Taylor, Yesim (2021). “What is happening to the District’s personal income tax base?” D.C. Policy Center, Washington, D.C.
- U.S. Census “State Population by Characteristics: 2010-2019” featuring Vintage 2019 estimates. Note: This data does not specify if change in population by age is due in-migration or residents aging in place.
- Kathpalia, Sunaina (2020). “The District’s population grows for the 14th year in a row, but at a weaker rate.” D.C. Policy Center, Washington, D.C.
- Sayin Taylor, Yesim (2021). “What is happening to the District’s personal income tax base?” D.C. Policy Center, Washington, D.C.
- Frey, William (2020). “Even before coronavirus, census shows U.S. cities’ growth was stagnating.” Metropolitan Policy Program at Brookings.
- [1] U.S. Census American Community Survey (ACS) 2010 and 2019 1-year data.
- Ed Glaeser’s Triumph of the City (2011) and Enrico Moretti’s New Geography of Jobs (2012) via Cortright, Joe (2014). “The Young and Restless and the Nation’s Cities.” City Observatory.
- Cortright, Joe (2014). “The Young and Restless and the Nation’s Cities.” City Observatory.
- Margin of error: +-0.5 percent
- Margin of error: +-1,483
- Margin of error: +-14.7 percent
- The 18 to 24, 35 to 44, and 55 to 64 age groups have relatively high margins of errors, but not great enough to change the overarching trend that the District lost more residents in the 25 to 34 age group than any others.
- Margin of error: +-2.5 percent
- Margin of error: +-1,879
- Margin of error: +-1.3 percent
- Margin of error: +-0.6 percent
- Margin of error: +-3.9 percent
- Margin of error: +-1.0 percent
- Margin of error: +-3.7 percent
- Due to the large margin of errors on the migration estimates for those that work in education, it is also possible that the District’s second largest loss in residents by industry was education workers.
- Althoff, Lukas and Eckert, Fabian and Ganapati, Sharat and Walsh, Conor (2021). “The Geography of Remote Work.” National Bureau of Economic Research, Working Paper 29181, DOI: 10.3386/w29181
- For more information see: McConnell, Bailey and Sayin Taylor, Yesim (2022). “A new regional playing field: How can D.C. stay economically competitive with its suburban neighbors?” D.C. Policy Center, Washington, D.C.
- Margin of error: +-1.4 percent
- Margin of error: +-26.9 percent
- Dingel, Jonathan and Neiman, Brent (2020). “How May Jobs Can Be Done at Home?” National Bureau of Economic Research, Working Paper 26948, DOI: 10.3386/w26948
- 90% confidence interval: 14.7-19.6 percent. IPUMS-CPS, University of Minnesota, www.ipums.org. Note: We are not able to use CPS data to determine why households moved in 2020 or 2021. Due to low sample sizes year to year, this data is most accurate when aggregated across multiple years. This data was pulled vis the UC Berkeley Survey Documentation and Analysis system.
- Margin of error: +-1.0 percent
- 90% confidence interval: 11.6-16.1 percent. IPUMS-CPS, University of Minnesota, www.ipums.org. This data was pulled vis the UC Berkeley Survey Documentation and Analysis system.
- 90% confidence interval: 8.5-12.4 percent. IPUMS-CPS, University of Minnesota, www.ipums.org. This data was pulled vis the UC Berkeley Survey Documentation and Analysis system.
- Whitaker, Stephan (2021). “Migrants from High-Cost, Large Metro Areas during the COVID-19 Pandemic, Their Destinations, and How Many Could Follow.” Federal Reserve Bank of Cleveland. DOI: 10.26509/frbc-ddb-20210325
- Sayin Taylor, Yesim (2021). “The declining importance of commute times.” D.C. Policy Center.
- Manhertz, Treh (2020). “Almost 3 Million Adults Moved Back Home in Wake of Coronavirus.” Zillow Research.
- Calculated using the data included in the following piece: Moored, Ginger (2021). “D.C. lost at least 17,000 more people during the pandemic than in the prior year, according to USPS data on net moves. At least 9,000 of the loss appears to be permanent.” District, Measured.
- Moored, Ginger (2022). “Pandemic led to DC population loss, but data suggests population rebound last summer.” District, Measured. Note from the author on the data: The USPS data counts international moves out, but not in, so it likely undercounts the number of people returning.
- Data from Kastle Systems
- DiNapoli, Jessica (2021). “EXCLUSIVE PwC offers U.S. employees full-time remote work.” Reuters.
- Between June and November 2021, there was an average of 41,000 job openings per month, which is more than 5 percent of total employment in D.C. And, job openings have been consistently above hires in 2021, indicating that employers are having a hard time filling the positions. Sayin Taylor, Yesim and McConnell, Bailey (2022). “Chart of the week: The tepid monthly employment numbers in D.C. hide the great churn.” D.C. Policy Center, Washington, D.C.