The D.C. Policy Center report “D.C.’s disconnect between citywide enrollment growth and neighborhood change” examines changes in enrollment, school-age population, and housing values, finding that although these three are growing in parallel for the city, they are not linked neighborhood by neighborhood. Download the report as a PDF here.
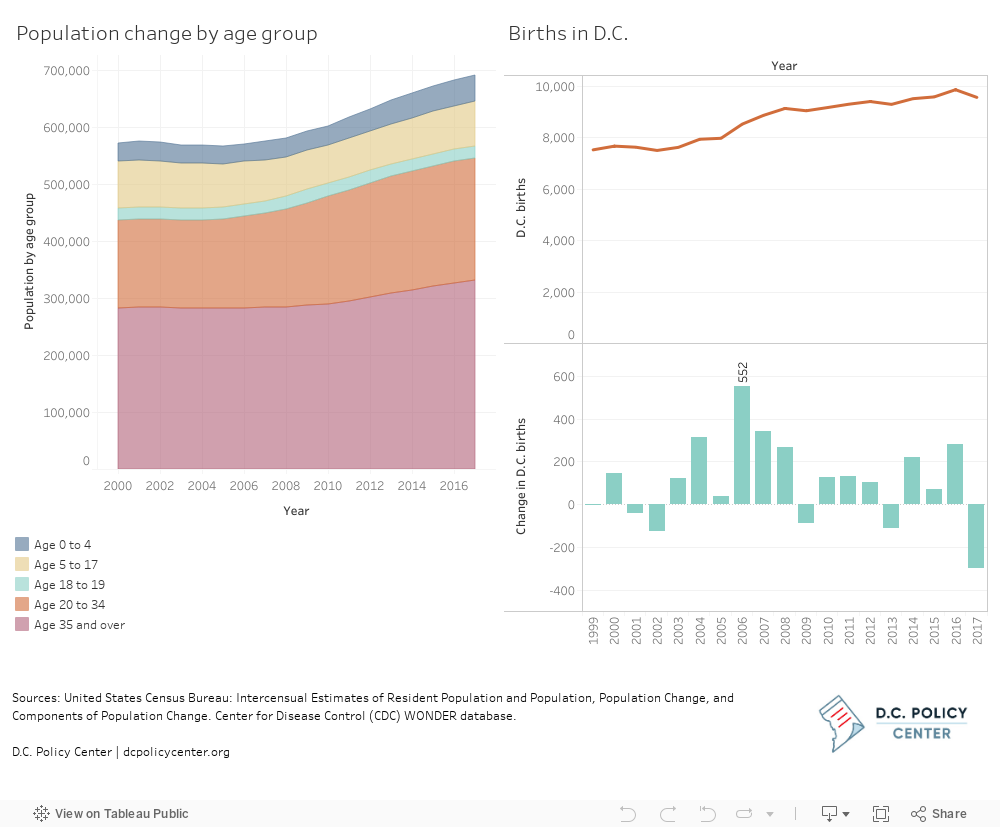
The District of Columbia has become a more popular place to live, especially for families. Population growth began in 2006, with young adults between the ages of 20 and 34 driving much of this growth (see Figure 1). This growth in the number of young adults translated into an increase in the number of babies born per year starting in 2006, and an increase in the school-age population starting in 2012.
Figure 1. Population change driven by young adults and higher levels of births
The school-age population (aged 5 to 17) started to rise a few years later in 2012, growing by 9 percent from 2010 to 2017.[1] Public school[2] enrollment for pre-kindergarten to grade 12 likewise grew by 20 percent over this time period. This population growth has also led to increased demand for family housing[3] and rising property values: Citywide, the total assessed real value of single-family homes[4] increased by 8.7 percent from 2010 to 2018, even while the total number of these homes decreased by 2.8 percent.[5]
In school districts with little public school choice, one would expect such citywide increases in enrollment, increases in the school-age population, and rising housing values to be mirrored at the neighborhood level as well. In other words, an increase in a neighborhood’s school-age population would lead to more students enrolled in that neighborhood’s schools. And in neighborhoods with a fixed housing supply, housing values would be likely to appreciate as demand for family housing increases.
The District’s neighborhood-by-neighborhood growth tells a different story. Although the city’s public school enrollment and school-age population grew in tandem with rising housing prices, a look beneath the surface shows that these changes are happening independently of each other at a neighborhood level. The high degree of public school choice in D.C. weakens the link between where people live and where their children go to school. Accordingly, enrollment changes by neighborhood over the last several years are only weakly correlated with shifts in population or prices of existing single-family homes.[6]
This disconnect between changes in housing values and changes in enrollment is critical as it shows it is possible for District residents to decouple their housing decisions from their decisions about where to send their children to school. Research suggests that the effects of this shift can be mixed, as separating housing and school choices allows for both gentrification[7] and potential integration of neighborhoods. This separation also lets schools to have a more diverse student population as students can attend a school that is outside their neighborhood.
This briefing further examines changes in neighborhood clusters where schools are located[8] to see how enrollment at schools is growing or declining across the city, how other neighborhood characteristics of housing values and population are changing, and which neighborhood clusters have changes that mirror citywide trends. It shows that school locations are neither a leading nor lagging indicator of broader neighborhood change, as citywide trends are occurring at different rates by neighborhood cluster. Planners should not anticipate that enrollment changes will rapidly increase or decrease the school-aged population or housing values in a particular neighborhood.
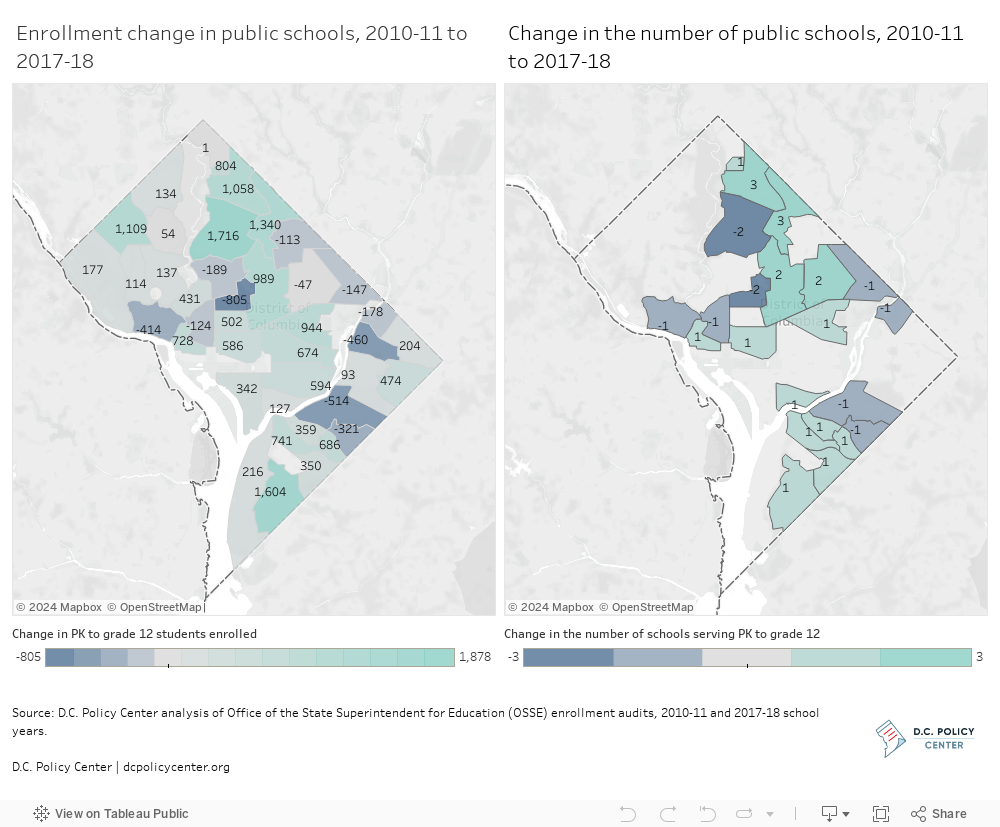
Most neighborhood clusters experienced an increase in public school enrollment
From school year 2010-11 to 2017-18, three quarters of neighborhood clusters experienced enrollment growth in pre-kindergarten to grade 12 at the public schools within their borders (see Figure 2). On average, each neighborhood cluster had 341 more students at its public schools in school year 2017-18 than in 2010-11. However, gains and losses in enrollment occur at schools throughout the city, and are not concentrated, for example, east of the Anacostia River or west of Rock Creek Park (areas that tend to have different populations in terms of income and race[9]). The neighborhood clusters with the most change[10] from school years 2010-11 to 2017-18 are located in all quadrants aside from Southwest.
Interestingly, the increase in the number of schools in neighborhoods did not necessarily lead to more students in these neighborhoods: Just 14 out of 41 clusters with schools had more schools in school year 2017-18 on net than they did in 2010-11. A few clusters experienced a decline in the number of schools but an uptick in the number of students. This shows that enrollment growth is likely to be driven by higher demand or filling to capacity at particular schools instead of growth in the nearby population.
Figure 2. Enrollment changes occur differently neighborhood by neighborhood
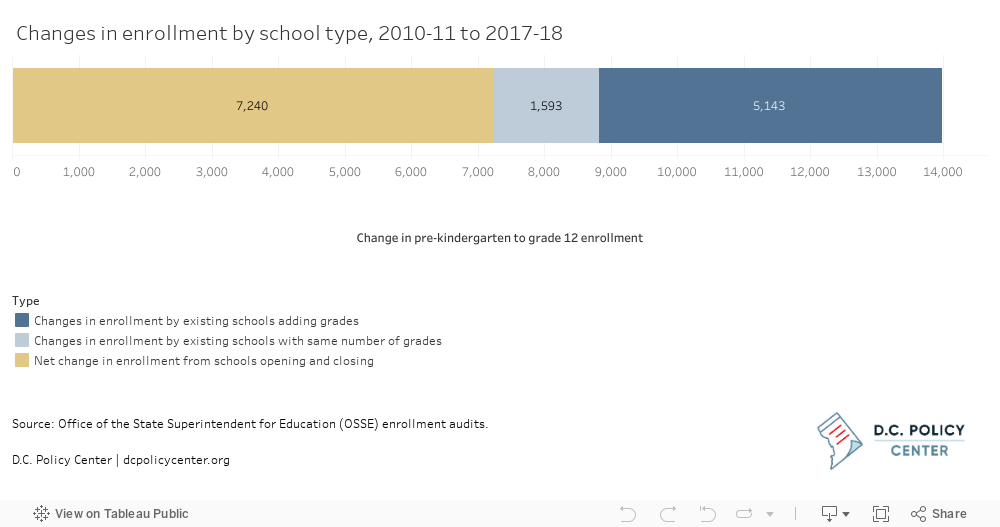
Half of enrollment growth occurred at existing schools
About half of the growth in enrollment resulted from schools that opened or closed between school years 2010-11 and 2017-18 (52 percent) and the other half occurred at schools that existed in both school years (see Figure 3). Most growth at existing schools came from schools that added new grades, which indicates that many schools grew slowly over time and gradually changed their presence in a neighborhood. Thirty-six existing schools added grades over this period, including 11 DCPS schools. Growth was less likely to occur at existing schools that didn’t expand by grade, but may have had excess capacity to take on more students.
Figure 3. Almost half of enrollment change came from existing schools
From 2010-11 to 2017-18, D.C. experienced growth in its public schools, school-aged population, and housing values. Trends for these three metrics moved in the same direction: by 2018, the city’s schools had 18 percent more students in kindergarten to grade 12, the school-aged population aged 5 to 17[11] grew by 8 percent, and assessments of single-family houses were 26 percent higher. In other words, the city added about one resident aged 5 to 17 for every two additional students in kindergarten to grade 12, meaning that more families are choosing to send students to public schools.[12] During this same period, the assessment value of the average single-family home grew by $10 for every additional student[13] enrolled.
Changes in school-age population tend to occur independently of enrollment changes within a neighborhood cluster
By neighborhood cluster, the school-age population aged 5 to 17 has grown by 125 children and youth on average. Out of 41 clusters with schools, 30 experienced growth in the school-age population (see Figure 4). However, change in a neighborhood cluster’s school-age population is not correlated with change in enrollment at its public schools. This discrepancy makes sense as 73 percent of public school students did not attend their in-boundary school in 2017-18,[14] and less than a quarter of students attended the school closest to their home in 2013-14.[15] Even when students do attend their in-boundary school, it may be located outside of the neighborhood cluster of their home. For example, not all clusters have an in-boundary District of Columbia Public Schools (DCPS) middle school: There are only 27 DCPS schools serving grades 6 to 8 compared to 41 neighborhood clusters with schools. In addition, new schools are unevenly distributed by neighborhood cluster, as 18 clusters had no change in the number of schools from school years 2010-11 to 2017-18 compared to 14 clusters that added up to three schools.
Figure 4. School-age population and public school enrollment are growing in different neighborhood clusters

Changes in enrollment do not match changes in housing values over time
Housing assessments for single-family houses[16] increased by an average of $153,140, or 27 percent, in nominal terms for the neighborhood clusters with housing.[17] In general, housing values are associated with perceived school quality. For example, one study examining differences in housing values at school boundaries finds that parents will pay 2.5 percent more for a house in exchange for a five percent increase in test scores.[18] This is true in D.C. as well, where single-family homes that are in-boundary for elementary schools with the highest assessment results are the most expensive.[19]
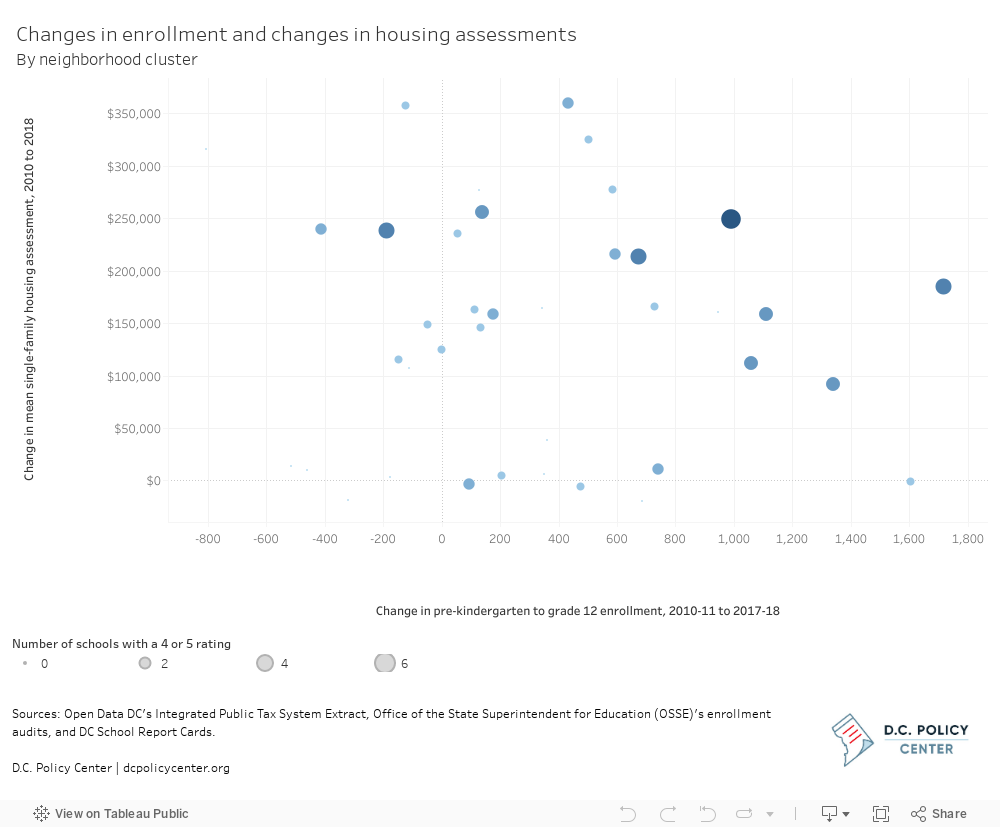
However, the amount of appreciation is only weakly correlated[20] with the change in enrollment in a neighborhood cluster, which means that, generally, shifts in housing values and enrollment are unrelated. This is even true for the neighborhood clusters that have more schools with high quality ratings on the 2017-18 school report card (see Figure 5).[21] Fluctuations in housing prices may not be correlated with enrollment changes for two main reasons. First, families could represent such a small share of buyers that any preferences they may have for a nearby school are washed out by other buyers (an estimated quarter of households have three or more persons in D.C.).[22] Second, D.C. has a high degree of public school choice, which means that school quality is not capitalized as much into housing values.[23] Only 27 percent of D.C. public school students attended their in-boundary school in school year 2018-19, with the remaining attending public charter schools (47 percent), out of boundary DCPS schools (20 percent), DCPS application high school (4 percent), or citywide schools (1 percent).[24]
Figure 5. Most neighborhoods with low change in enrollment or housing values have few schools with a 4 or 5 rating
A handful of neighborhoods are experiencing large changes in the same direction as large changes in enrollment
Large enrollment changes generally are not indicative of broader neighborhood changes in the school-age population or housing values. While some neighborhoods experience growth in school-age population or housing values together with an increase in enrollment, many neighborhoods undergo these changes in different ways. For example, there aren’t any neighborhood clusters where all three factors are increasing quickly. Looking at the top ten neighborhoods experiencing the most growth in each category (or the 75th percentile), just four are growing by the most in both enrollment and mean housing values. The overlap in the highest growth neighborhoods in terms of enrollment and mean housing values is even smaller: only one neighborhood cluster is growing the most in both categories (see Table 1).
Table 1. Only a few neighborhood clusters experience large swings in enrollment and housing values or school-age population
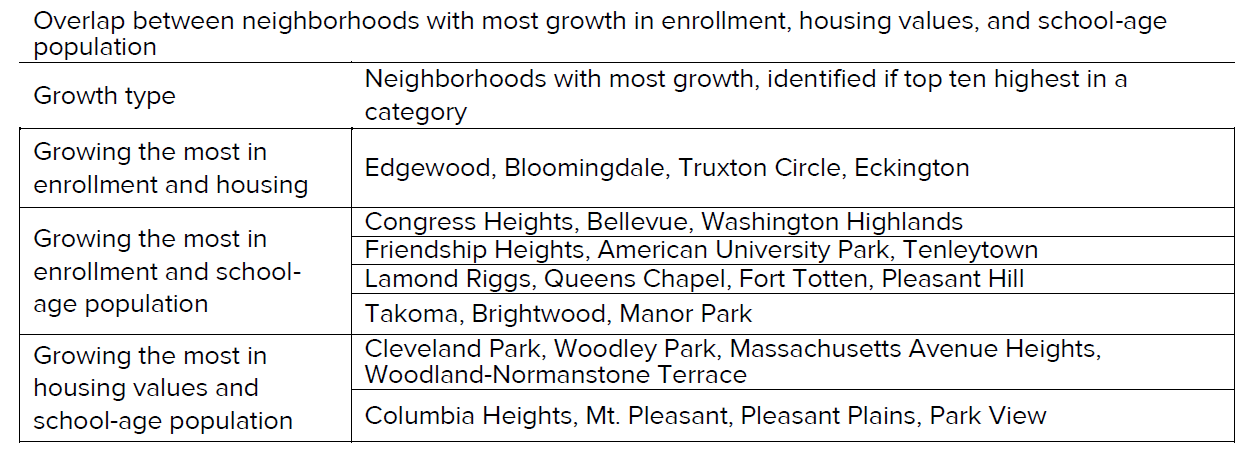 For example, there has been a large increase in enrollment[25] at schools in both the Brightwood Park, Crestwood, and Petworth neighborhood cluster and the Congress Heights, Bellevue, and Washington Highlands neighborhood cluster, but while the Congress Heights cluster has also seen one of the largest increases in children living there,[26] the Brightwood Park cluster has actually seen one of the largest decrease in children living there. The Edgewood, Bloomingdale, Truxton Circle, and Eckington neighborhood cluster stands out for having both strong rising home prices[27] and strong enrollment growth, but many other neighborhoods have seen rapid housing price growth without much change in enrollment (like the Columbia Heights, Mt. Pleasant, Pleasant Plains, Park View neighborhood cluster), or little appreciation in housing prices but strong enrollment growth (such as the Sheridan, Barry Farm, Buena Vista neighborhood cluster).
Takeaways
D.C. has experienced steady population growth since 2005, which includes a boost in the number of children and youth. Citywide, this population increase has been accompanied by higher growth in public school enrollment and rising housing prices.
These changes would be expected to be mirrored at a neighborhood level, as housing and school decisions are often made jointly. However, this analysis shows that changes in enrollment, population, and housing are not aligned with each other at a neighborhood level. This could be due to public school choice in D.C. that separates housing from schools, or that families still have a small enough presence that their housing decisions do not drive all housing values. It could also be related to the uneven distribution of new schools by neighborhood cluster.
This has one important implication for future growth: School locations are neither a leading nor lagging indicator of broader neighborhood change, as citywide trends are occurring at different rates by neighborhood cluster. Planners should not anticipate that enrollment changes will rapidly increase or decrease the school-aged population or housing values in a particular neighborhood.
About the data
The education data in this analysis are from the Office of the State Superintendent for Education (OSSE)’s enrollment audits, the National Center for Education Statistics’ Common Core of Data, and the DC Public Charter School Board Annual Report for 2011. Throughout this analysis, the term “public schools” is used to refer to both traditional public schools and public charter schools.
The housing data in this analysis are from Open Data DC’s Integrated Public Tax System Extract.
The population data in this analysis are from the United States Census Bureau and American Community Survey 5-Year Estimates.
More information about the methodology and direct links to the underlying data can be found here.
Note: Why focus on single-family homes
D.C.’s housing stock is comprised of apartments (40 percent of units in 2017), single-family homes (31 percent), condominiums (21 percent), and co-operative housing (8 percent).[28] Many families will rent instead of buy, but this analysis focuses on single-family homes because of available data on capacity and assessments. Comparing data from Zillow on median two-bedroom rents with costs associated with home ownership from the D.C. Policy Center’s Taking Stock database[29] suggests that rental prices are likely to be similar to housing costs in neighborhoods where a two-bedroom single-family home costs less than $3,400 per month.[30] However, it is not possible to ascertain apartment capacity per unit with the data currently available,[31] limiting a full analysis of the rental market. Condominiums, another category of housing, are unlikely to have child residents and therefore less relevant to a study related to public school enrollment. An analysis of the Public Use Microdata Sample for the 2013-2017 American Community Survey 5-Year Estimates shows that 97 percent of households who pay condo fees in D.C. do not have children as residents. This is confirmed by the Deputy Mayor for Education’s EdScape tool, which estimates a yield of 7 public school students for every 100 condominiums, compared to 40 for single-family homes and 32 for apartments.
About the Education Policy Initiative
The D.C. Policy Center started its Education Policy Initiative in October of 2017 to focus on the demands and pressures on the public education system that result from changing demographics in a growing city. This is the fourth report in the Education Policy Initiative’s paper series, “Changing Schools in a Growing City,” which studies how the District’s schools can attract and retain families of all types.
Acknowledgements
The author is grateful to Education Forward DC and the Walton Family Foundation for their generous support of the Education Policy Initiative. This research was guided by members of the Education Policy Initiative Advisory Board, which includes Matt Chingos, Steven Glazerman, Savannah Gress, Sara Mead, and Jon Valant. At the D.C. Policy Center, Yesim Sayin Taylor and Kathryn Zickuhr offered crucial guidance. Jane Adade and Clare Zaytoun provided valuable research assistance.
The views expressed in this paper are those of the author and should not be attributed to members of the D.C. Policy Center’s Board of Directors or its funders. The research, analysis, and policy recommendations published by the D.C. Policy Center staff and independent experts are not determined by the D.C. Policy Center’s Board of Directors or its funders.