Land is among the most valuable assets in the United States, and its value is a function of how we use land and what we build on it. According to one study, the value of all land in the lower 48 states is estimated at about 1.4 times the nation’s Gross Domestic Product (GDP).[1] Only 6 percent of the nearly 2 billion acres of land is developed, but this small share accounts for nearly half the total value of land. That is, each acre of developed land is worth over 16 times an acre of undeveloped land.
Land is also one of the most tightly regulated resources. We regulate both what we can build on land through zoning, and how we can build it through building codes. While they collectively determine land use, zoning and building codes operate in entirely different ways: zoning is rigid and prescriptive, and therefore limits opportunities of growth and inclusion (often times by design). Permitting is complex, uncertain, and therefore increases costs of construction as well as starting a business or building a house.
Zoning laws
Zoning refers to a vast set of regulations that determine where you can build, what you can build, and what activities you can engage in on your property.[2] For example, it will tell you whether you can build a house or a business on your land—and what kind, to boot. It will tell you how tall your building can be, how far away it needs to be from the curb, or what share of your land you can use for your building. It will tell you how large a lot must be before it is deemed suitable for building anything on it.
Starting at the turn of the century, zoning grew largely out of demand from land-owners who wanted to keep property values intact by keeping out what they considered to be sources of nuisance.[3] The intent moved quickly away from addressing nuisance to segregating people and income levels.[4] For example, in 1870, San Francisco passed the Cubic Air Ordinance that required 500 cubic feet of space per occupant—a law only enforced where Chinese residents lived.[5] Other discriminating ordinances followed, banning public laundries and washhouses, all with an attempt to keep the Chinese residents out of certain neighborhoods.[6] It was common to see zoning ordinances go beyond nuisance issues that had been addressed by common law. The ascribed goals of zoning stretched thin the definition of public interest to include things like “[p]romote the health, safety, morals, and general welfare of the community, to protect and conserve the value of buildings, and encourage the most appropriate use of the land.”[7]
With popular support, zoning laws quickly spread from cities to suburbs, becoming more comprehensive, complicated, and detailed. Modern zoning codes go well beyond allowable types of use to regulate specific features of individual buildings—their width, the share of surface space dedicated to windows on outer walls, the size of balconies, or the distance between entries.[8] Zoning laws are also increasingly used to specify what you can do even after a building is in place: from whether you can run a small business in it, to “[w]hether you can own a chicken to whether you can hang laundry out to dry.”[9]
Building codes
Building codes have been developed in response to shoddy and unsafe construction and the consequent hazards that threaten human lives. Early use of building codes in the United States date back to 17th century and mainly were concerned with reducing fire hazard when wood frames were the main type of construction. Cities increasingly began to adopt codes, generally in response to major disasters such as the 1886 Chicago Fire or the 1906 San Francisco Earthquake.[10] The insurance industry, having a great stake in minimizing hazards, helped found the Building Officials and Codes Administrators, International (BOCA) and their subsequent iterations, issuing the first “model” building codes for localities to adopt. Today, revisions to building codes in the United States are largely done through model legislation that is formulated by architects, engineers, and other invested parties, and adopted with minor tweaks across local jurisdictions.
Almost immediately following their widespread adoption, building codes have also been characterized as unduly costly.[11] For example, a State Committee report from 1920 found that “[t]he building codes of the country have not been developed upon scientific data, but rather on compromises; they are not uniform in principle and in many instances involve an additional cost of construction without assuring most useful or more durable buildings.”[12] In the 1960s, three national commissions identified building codes as important factors affecting the efficient production of housing.[13]
Today, the costs associated with building codes are less about the specifications laid out in the code, but almost always are related to how local governments implement them. Whether a construction project involves an entire office building, a sprawling housing development, a small expansion to a house, or minor alternations to a retail space to accommodate the needs of a new tenant, builders must seek “permits,” go through construction plan reviews—often through multiple agencies—and the project must be inspected before occupancy. It is more so this permitting and inspection process, and less the prescriptions in the code, that has frustrated growth. For example, in its “Doing Business” reports, which measure the relative impact of business regulations on economic growth, the World Bank dedicates an entire section[14] to the permitting process, with steps such as:
- Obtaining all plans and surveys necessary to start the design phase of a project;
- Obtaining and submitting all relevant project-specific documents (for example, building plans, site maps, and certificates of urbanism) to the authorities;
- Hiring external third-party supervisors, expediters, engineers or inspectors, when necessary;
- Obtaining all clearances, licenses, permits and certificates necessary before a business can open doors in a space;
- Submitting all required notifications for the start and end of construction, including for inspections;
- Requesting and receiving all necessary inspections.
Permitting agencies are notoriously resistant to change and appear to be incapable of solving seemingly simple problems such as sharing permit information, making permit applications easy, and the process transparent.[15] Complaints include the lack of information, or the confusing nature of what could be found, the need to do multiple visits to the planning or regulatory departments, the lack of response to questions, and the uncertainties associated with the time and effort necessary to obtain a permit and successfully pass an inspection.
Economic and social costs of land use regulations
Among the most frequently mentioned costs of land use regulations is related to housing. Restrictive land use regulations increase housing costs for residents through three separate yet related mechanisms. First, by restricting supply, land use policies increase prices.[16] Second, costly reviews associated both with zoning changes and with permitting and inspections processes increase the cost of construction. Third, artificial limitations on how land can be used can change urban form. Restrictions operate through project proformas, incentivizing the production of sub-optimal housing such as larger, more expensive single-family homes rather affordable duplexes or triplexes; or tiny, expensive apartments targeting affluent singles and couples rather than larger units in multifamily buildings that can accommodate families.
Land use restrictions define the size and shape of cities, and impact who can live in them. Restrictions—sometimes by design—increase racial and economic segregation. This impacts not just the economic opportunities today, but opportunities available to future generations. The impact of restrictive residential land use policies also operates through the labor market, both reducing growth and increasing current and future income and wealth disparities.
Restrictive land use regulations increase housing costs.
It is not always easy to pinpoint how much of the housing value appreciation in a region is directly related to restrictive land use regulations and how much is related to construction costs, increased demand, or other macroeconomic factors. Use restrictions, as well as demand for housing vary greatly across the country. It is common to see large swaths of land dedicated to low-density use—specifically single-family housing, but the impact of such zoning is different in D.C., New York City, or San Francisco than what it would be in Buffalo, Detroit, or Baltimore. To circumvent these problems, researchers have used clever methods, such as looking at housing value growth in closely situated places with different restrictive regimes; comparing construction costs to housing values to estimate the value premium that cannot be explained by economic fundamentals; and using comprehensive information on land regulation to control for the differences around the country to make judgements of how much of the price increases can be linked to restrictive land regulations. These studies, which go back to the late 1980s, explore different mechanisms and use increasingly sophisticated techniques, but they universally find one thing: restrictive land use practices increase housing prices.
One pioneering study by economists Lawrence Katz and Kenneth Rosen[17] took advantage of the variations across different parts of San Francisco: some neighborhoods had imposed with moratoria on growth or other types of growth controlling plans, while others had not. The authors found that market values for houses were between 17 and 38 percent higher in communities with moratoria on growth or other types of growth controlling plans. Another study from early 1990s—this time comparing various jurisdictions within Montgomery County, Maryland—found that after per capita incomes, housing prices were most responsive to restrictive zoning. And prices were shaped by not just restrictive regulations in the locality itself, but also the restrictiveness of housing policies in nearby localities.[18] A third study explored the differential growth and land use restrictions in New Jersey’s “Comprehensive Management Plan” to show that differential restrictions resulted in measurable differences in housing prices within five to six years.[19]
Similarly, historic district designations have been shown to create a price premium. One study found that this premium was 29 to 38 percent in Chicago neighborhoods with historic designations.[20] The historic district designation premium in New York City is 20 percent.[21] A study of data based on many U.S. metropolitan areas found evidence that moving from less stringent to more stringent regulations generated a premium of 13 to 26 percent in rents and 32 to 46 percent for sales.[22]
Another interesting group of research have examined the difference between the cost of housing and the price of housing to deduce the impact of restrictive policies. Economist Ed Glaeser and his colleagues noticed that the typical home costs no more than 110 percent of the combined costs of the physical structure and the land. However, in the Boston, New York City, Newport News, Salt Lake City, and D.C. metropolitan areas, the gap between construction costs and home prices can be as high as 33 percent. The cities they identified as those with a large gap between construction costs and housing prices turned up to be those that have the most strictly regulated residential land use.[23] We know this because researchers from Wharton School of Business created a national index that captures how strictly residential land is regulated across major housing markets through the country.[24] Their index captured various types of regulatory interventions to show that that coastal markets in the United States are more highly regulated; and land use regulation is stricter in wealthier communities. Researchers using the information from this index found that minimum lot sizes are among the most restrictive policies.[25]
Costly reviews associated both with zoning changes and with permitting and inspections processes increase the cost of construction.
Obtaining construction permits and going through inspections can be substantially different experiences across cities in terms of costs, time, and required procedures. Most of these differences stem from the ease or difficulty of the zoning approval process, the need for reviews from other government agencies, such as environmental reviews, and the efficiency of the building permitting and inspection practices. The impacts of these administrative reviews on housing costs could be significant: across major residential markets in the country, regulatory burdens, on average, account for nearly a quarter of the cost of building single-family homes.[26] Just the costs associated with the development stage—figuring out what could be done, where, including zoning ordinances—is 60 percent of the regulatory costs. Homes are 3.1 percent more expensive, just because of the interest expense for debt-financed land acquisition related to delay due to subdivision and zoning approval. Then there is the opportunity cost: the cost of land unbuilt or undeveloped because zoning would not allow it: 2.6 percent of the final price of a house. In contrast, in housing markets where there are fewer delays, the cost of housing is closer to the construction costs.[27]
Higher construction costs impact commercial development too. Costs of construction permits vary substantially—administrative compliance costs could be as low as 0.3 percent to 0.7 percent of the total cost of construction in Dallas, Raleigh, and St. Louis, and as high as 3 percent in Los Angeles and San Francisco.[28] The regulatory costs across sixteen high-growth cities in the country run an average of 1 percent of the construction costs and 3 months of processing in order to complete a set of, on average, fifteen standard procedures. This process includes both pre- and post-construction phases for small commercial buildings.
Restrictive land use regulations alter urban form.
Restrictive land use regulations influence all aspects of urban form, with deep impacts on labor allocation, workforce behavior, and neighborhood amenities.[29] Density controls and height restrictions have been shown to increase sprawl[30]; or can limit the relative size of the urban area.[31]
FIG 1. Availability and affordability of housing units in D.C., by household size (2017)
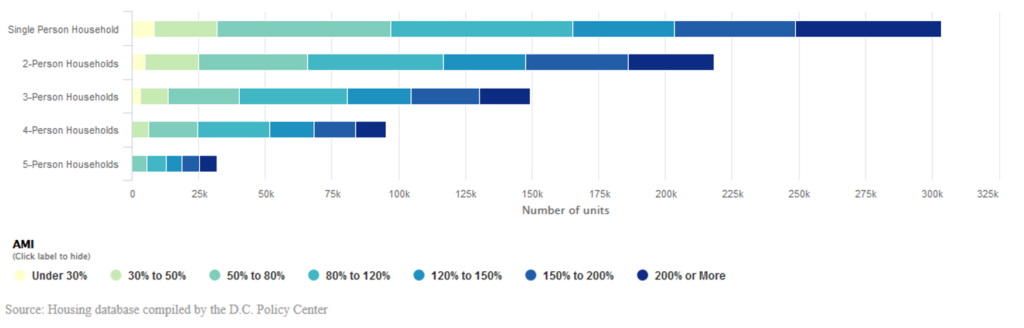
Another aspect of urban form than deeply depends on land use policy is how effectively we use land. This is most evident from rules that determine how much of the land is set aside for single-family homes versus multifamily units. Research shows that when land use is restricted, unexpected increases in average household incomes will raise the amount of multifamily construction by more than single-family construction, because developers will have an incentive to build as densely as they can where land is relatively expensive.[32] When housing supply is restricted, affluent singles and couples can out-compete families for family sized units, as happens in D.C., increasing the pace of gentrification. This further amplifies the displacement impacts of higher incomes.[33]
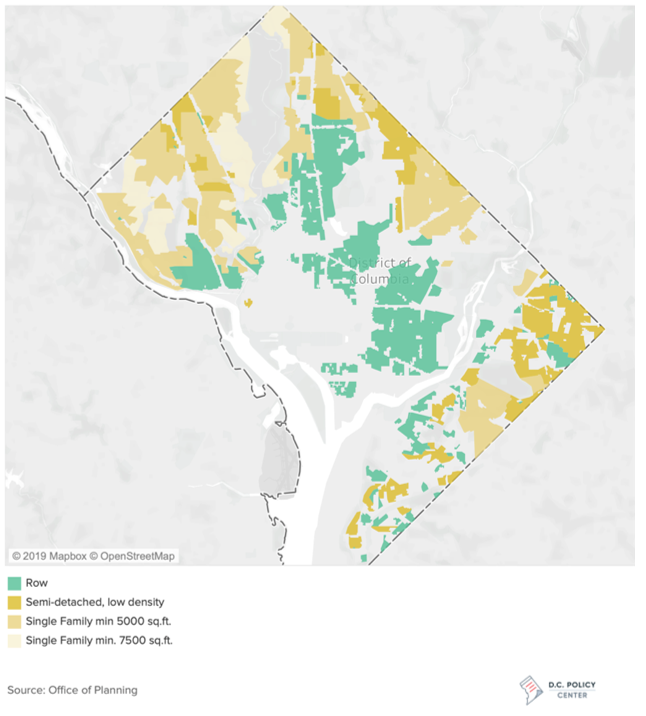
FIG 2. Current zoning map of allowable single-family dwellings in D.C.
In other instances, if zoning restricts multifamily housing, the construction response to an income shock could be shifted towards areas where it is more profitable to construct single-family housing. Builders tend to build fewer smaller or lower-priced homes—evidenced by growing home sizes across the country—because it is hard to pass the regulatory costs to buyers. [34]
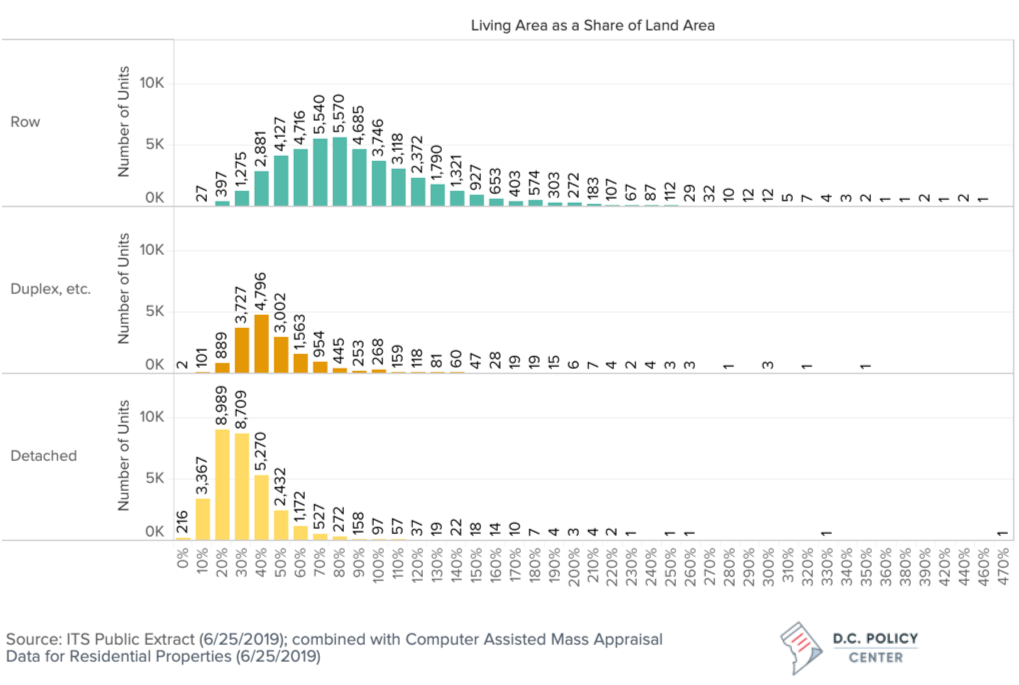
Even within single family zoning, the type of housing can have significant impacts on density. In D.C., land with single-family units add up to about 20 percent of the District’s entire surface area (Figures 2 & 3), 28 percent of all tax lots, 48 percent of all lots not occupied by the federal government or held by the National Park Service,[35] and 74 percent of all tax lots with residential use, including apartments, condos, and cooperatives. This zoning gives the city its suburban feel, but contributes to price pressures. Importantly, parts of the city zoned for single family housing and stricter lot restrictions look very different from parts of the city where row-homes and duplexes are allowed. The median lot size for a detached single-family unit is 3.3 times that of a rowhouse and the 90th percentile lot is 9,970 square feet, or nearly four times the 90th percentile lot for a rowhouse (Figure 3).[36]
FIG 3. Land use intensity by type of single-family home
Furthermore, restrictive land use practices make it costlier to build (or subsidize) affordable housing, causing jurisdictions to spin their wheels when it comes to increasing affordability. Again, in the District of Columbia, community advocates have been increasingly appealing zoning changes the city’s Zoning Commission for large scale development that needs more density than what was originally allowable. These appeals are lengthy, and filled with uncertainties, and can hold up housing production.[37] They not only slow down the pace of market-rate housing production, but also impede the production units with affordability covenants the developers had committed to as a community benefit, in return for the density increase they receive.[38] According to one count between 2000 and 2018, the Zoning Commission approved 76 PUDs for over 20,000 housing units, 4,500 of which were affordable units.[39] About a third of these projects were appealed, stopping the construction of 6,400 homes, of which 2,049 were affordable units.
Restrictive land use regulations increase economic and racial segregation.
Where housing is more expensive low-income households will likely be excluded. In neighborhoods where land use restrictions impede supply, the outcome will be economic segregation. It is hard to isolate the root cause of price increases, but researchers have tried by looking at changes in the neighborhood income composition after a land use restriction is adopted. For example, one study that examines how local growth-control enactment between 1979 and 1988 in California affected housing construction found that regions that adopted controls—especially those that limited available land or downsized zoning—were more likely to have concentrations of high income residents.[40] Again in California, after the creation of a coastal boundary zone to regulate construction near the coastline in 1976, household incomes rose faster in census tracts within the zone.[41]
Similar observations hold true for building codes. One study exploits the variations in building codes across California by climate zones and find that stricter codes are associated with smaller homes and fewer rooms, but only for households in the lower end of income distributions.[42] Furthermore, households in the bottom income quintile use more energy when they are in a stricter-code region, and home values for these households fall whereas home values of high-income households rise. That is building energy codes transfer wealth from lower-income households to higher income households.
FIG 4. Housing patterns across the District
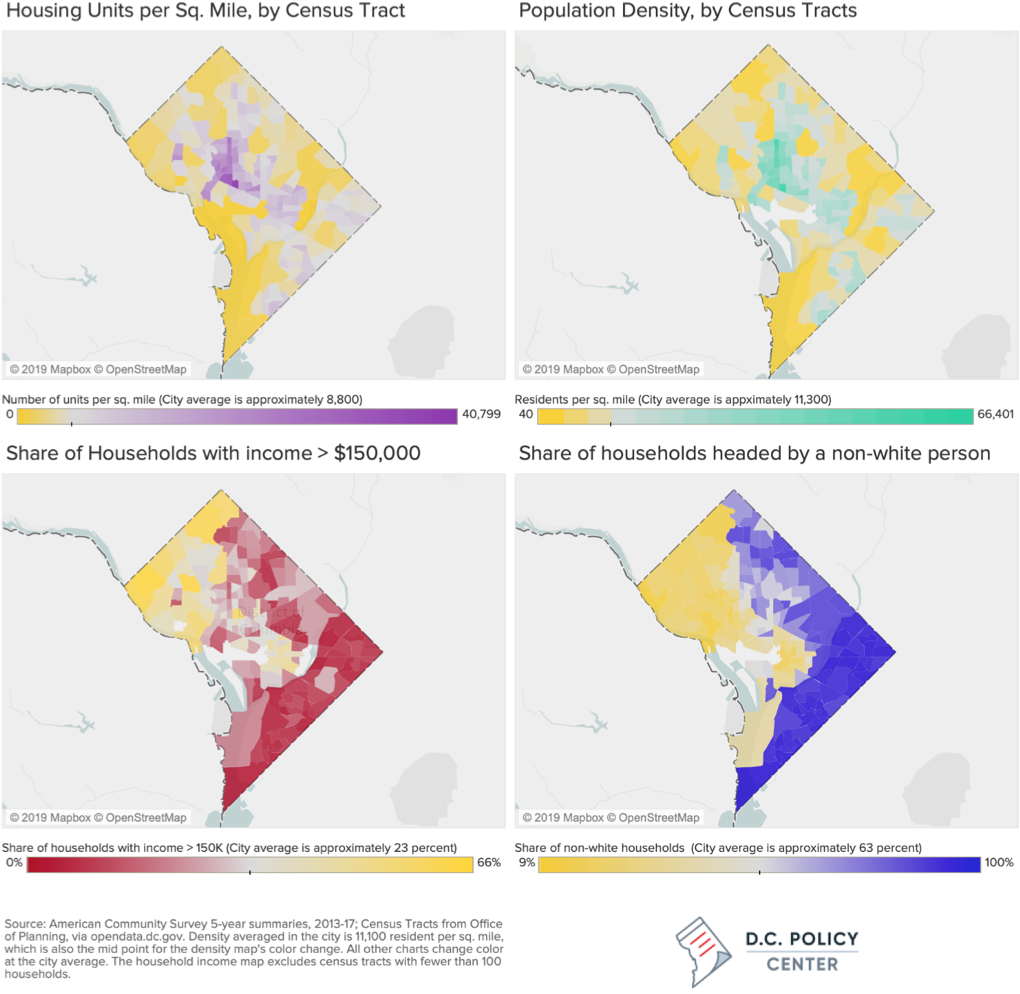
Much of what can be said about economic segregation due to restrictive land use can easily be extended to racial segregation as income and race characteristics of households are closely linked and change in predictable ways. But sometimes, exclusion, especially racial exclusion, is the intent. Federal and local land use decisions, restrictive covenants, redlining, and the placement of public housing, have facilitated the racial segregation in metropolitan regions by design.[43] And it has been successful: quantitative research that dates back to 1990s finds that more regulated communities have seen a decline in the share of minority populations[44], or a slower growth in minority populations.[45]
Restrictive land use regulations increase wealth disparities.
Whether or not the effect is intended, the correlation of restrictive land use regulations with subsequent increases in economic and racial segregation have long lasting effects. Land—specifically when used as housing—is a major means of wealth accumulation. Growth in housing values has been also a major contributor to the growth in net capital income over the past several decades, contributing to the larger share of capital in national income, and increasing wealth inequalities.[46]
According to a recent study, a $1,000 increase in housing prices disqualify over 150,000 households from qualifying for a mortgage.[47] Further distortions follow: When land use is restricted, the value of public investments, too, vest in existing development. In the District of Columbia, housing values tripled between 2000 and 2018. An analysis of appreciation patterns across the city show that more of this new wealth in housing has capitalized in existing homes that were built on significantly restricted land long before the city’s recent economic boom, and not in new construction.[48]
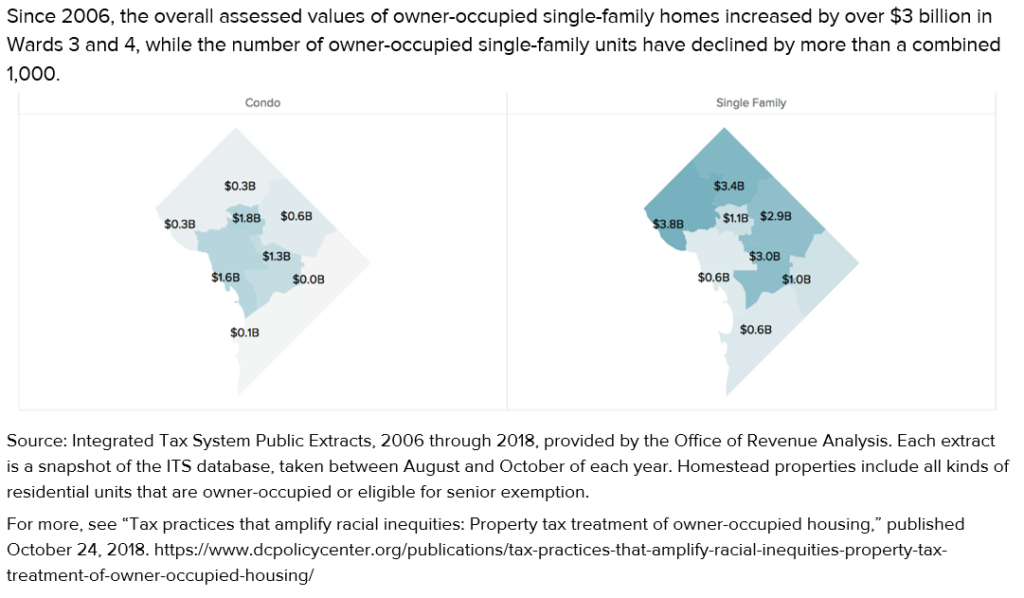
FIG 5. Change in assessed home values by ward among owner-occupied units, 2006-2018
This feedback between public investments and private returns on homeownership is most obvious in jurisdictions that use property taxes to finance local services such as schools or public safety. Higher tax collections help support public services help these communities prosper, and make them an attractive place to live, which in turn raises property values, completing the loop.[49]
Meanwhile, housing that is affordable tends to concentrate in under-resourced communities. The effects of living in economically and racially segregated communities work through schools, criminal justice system, and labor markets, reducing not only current income but incomes into the future.[50]
Land use regulations operate through labor markets, to reduce growth and increase inequality.
Ultimately, higher housing prices because of land use regulations channel workers, especially new workers, or those with few skills, to low productivity markets. When there are changes in demand for labor in a locality, workers move to respond to these changes. To the extent that restrictive land use practices constrain the movement of labor, they could have a meaningful influence on the economic health of local communities.
Recent research shows that when low-skilled workers are excluded from high-productivity, high-return areas because they simply cannot afford to live there, we see slower economic growth and higher income and wealth disparities. One study has found that in states where there is a larger accumulation of state appellate court cases dealing with land use have less in-migration from low-wage locations and stronger sorting of skills.[51] The authors show that by channeling low-skilled labor to low-productivity areas, zoning has contributed to increased wage inequalities estimate that zoning contributed to about 10 percent of the hourly wage inequality from 1980 to 2010. One new study—using data from 220 metropolitan areas—show that housing supply constraints lowered aggregate U.S. growth by 36 percent from 1964 to 2009.[52]
Is there any hope for reform?
Last December, Minneapolis did away with single-family zoning, permitting three-family homes in each lot, abolishing parking minimums, and allowing high-density buildings along transit corridors.[53] In March, Seattle upzoned many of its neighborhoods, including eliminating single-family zoning in some areas.[54] Then came Oregon, which, in late June, passed legislation to eliminate single-family zoning and instead allow by right two- to four-unit (and sometimes larger) buildings on lots that are presently zoned for single-family homes, depending on city size.[55] Some of these changes are driven by the changing preferences. Seattle’s upzoning was a response to increasing home prices, Oregon’s to increasing sprawl; lawmakers in Minneapolis said they were responding to increasing demand from voters that something be done about increasing racial disparities.
Another idea in local and national policy circles is to shift to a land value tax, a property tax regime where the tax is imposed on only the value of the land and not to the value of improvements (i.e., whatever is built on the land). When we consider how a land value tax could be implemented in the District, it becomes clear that such a shift would need to be made in conjunction with upzoning, as restrictive land use regulations in D.C. limit the potential development impacts of a land value tax.[56] (The D.C. government would also need to make significant changes to its real property tax assessment processes, as current assessments do not distinguish between the value of the land and the value of what is built upon it.)
D.C. has taken the first steps to allow for more density in neighborhoods restricted to single-family housing by allowing Accessory Dwelling Units (ADUs)[57] by right, but more significant moves will necessary to meet Mayor Bowser’s affordable housing goals[58]—especially in Ward 3 neighborhoods west of Rock Creek Park, which are predominately composed of detached single-family homes in large lots.[59] If D.C. follows in the footsteps of Minneapolis or Oregon, the effects on the city’s skyline would likely be minimal, but the gains in density could be great; even small increases in allowable density in single-family zones could have significant impacts.