Over the past several decades, Black residential segregation in the metropolitan area of Washington, D.C. has slowly but steadily decreased, dropping from a segregation index of 81 (hyper-segregation) in 1970 to 61 (nearing medium segregation) in 2014.
Over roughly that same period, however, the level of economic residential polarization in the metropolitan Washington has steadily increased, rising from an economic polarization index of 34 in 1970 to an economic polarization index of 41 in 2014.
Metro Washington’s trends mirror national trends. For the 58 largest metro areas (plus Bridgeport, CT and Albuquerque, NM), Black residential segregation decreased in every one, and the Black segregation index dropped from an average of 82 in 1970 to 57 in 2010.
Conversely, economic polarization increased in each and every one of these same metro areas. Economic polarization increased from an average index of 31 in 1970 to 38 in 2014.
Segregation by income is replacing segregation by race.
The economic polarization index
My economic polarization index is based on the work of Prof. John Logan of Brown University. For all 380 metro areas Logan calculated a variety of measures of economic segregation, including the degree to which “poor” residents (defined as the lowest 10 percent of the income scale) are residentially segregated from everyone else and, conversely, the degree to which “affluent” residents (defined as the highest 10 percent of the income scale) are residentially segregated from everyone else.[1] I have combined these two indices to produce an “economic polarization index.”
Many factors have contributed to what has been labeled the “sorting” out of America,[2] but two key factors still are the degree of residential distribution by race and income. In 2015, both Black and Hispanic families recorded less than 60 percent of Anglo median family income, so there is substantial overlay between racial segregation and economic segregation.
And though Black segregation has decreased and Hispanic segregation has increased in recent years, Census Bureau data shows that economic polarization within Black and Hispanic communities has been growing as well – as it has within the White community (topics that will be explored in a future article).
Key factors associated with economic polarization
The full database can be accessed here, but I’ve found statistically that four, non-economic factors correlated significantly (a fairly robust 0.615 r-square) with the level of metropolitan economic polarization in 2014:
- Black segregation: Higher levels of segregation between Black and Anglo families is associated with higher economic polarization;
- Hispanic segregation: Higher levels of segregation between Hispanic and Anglo families is associated with higher economic polarization, regardless of the rate of increasing Hispanic in-migration;
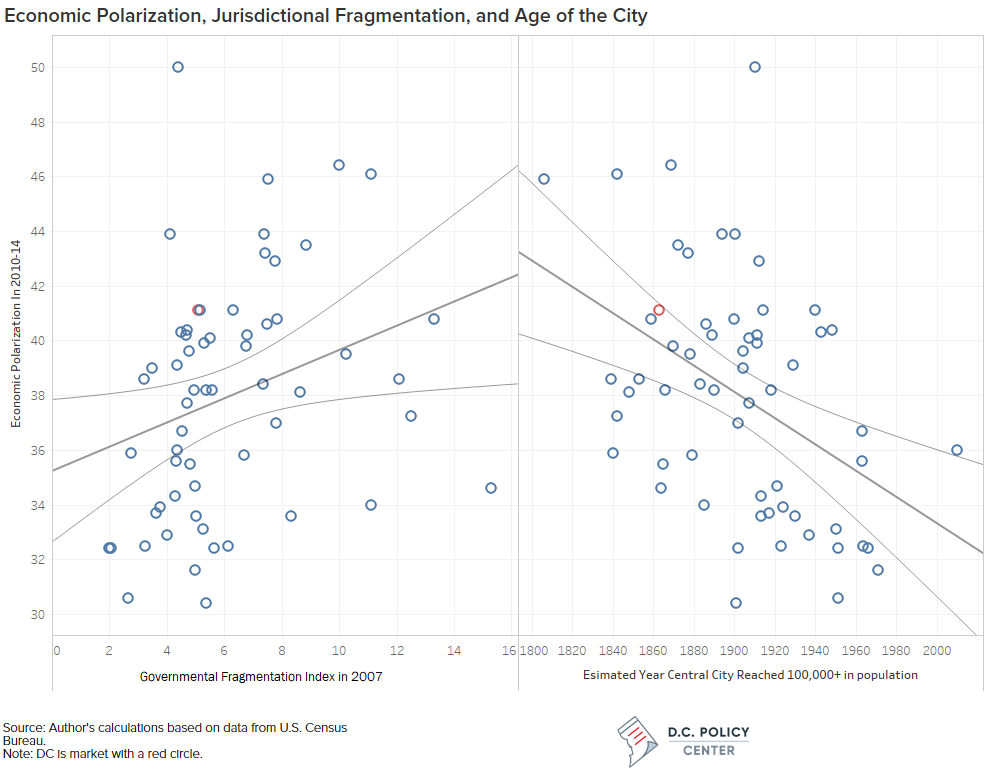
- Central city age: As measured by the estimated year in which the central city surpassed 100,000 residents, the older the central city, the higher economic polarization; and
- Governmental fragmentation: The more fragmented a metro area is into multiple municipal governments, the higher the economic polarization.
These four factors cluster together. This is illustrated in the graph below, which groups these 60 large metro areas by quintiles according to their economic polarization levels. The 1st quintile groups the dozen most economically polarized metro areas. The 5th quintile groups the dozen least economically polarized metro areas.
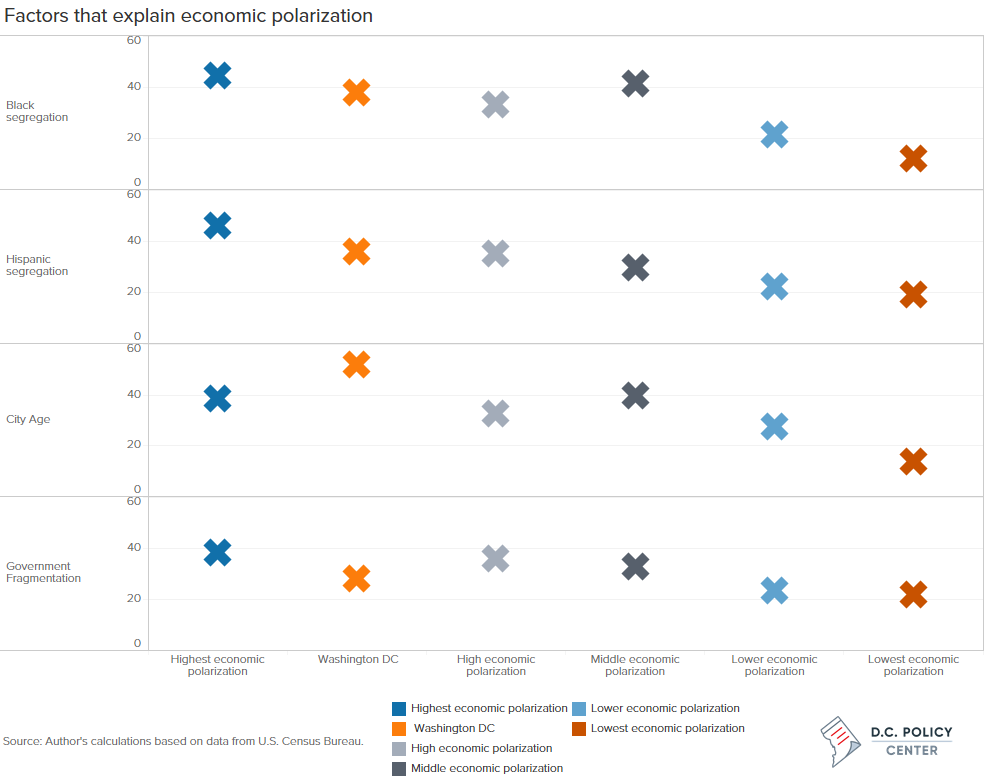
To provide a common metric, the 60 metro areas have been ranked from 60 (highest/worst) to 1 (lowest/best) for each of the four factors.
Most of the oldest central cities are located in the Northeast and the older Middle West (known as the “Northwest Territories” in the 18th century). Whatever the geographic population size of their central cities (giants like New York City, Philadelphia and Chicago, or relative dwarfs like Bridgeport, Hartford, and Camden), they are surrounded completely by a myriad of small cities, towns, villages, and townships (“little boxes”) – hence, experiencing a high level of governmental fragmentation. “Little boxes” regions are also the more highly segregated for Black and Hispanic residents. Six of the 21 “little boxes” regions are found in the 1st quintile of economic polarization, including the four worst ranked (i.e., Bridgeport, CT; Newark, NJ; Philadelphia, PA; and New York, NY).
By contrast, most of the younger central cities are located in the South and West. Both their population and geographic size have been growing rapidly, the latter through annexation and (more rarely) city-county consolidation. Typically, such central cities have few incorporated suburbs, and can expand by annexing unincorporated land under the governance of overlapping county governments. In these “Big Box” regions” Black and Hispanic residents are also less segregated. “Big Box” regions account for eleven of the 12 metro areas in the 5th quintile of economic polarization. (The exception is Camden, NJ, a suburban “little boxes” region, which is usually treated as a sub-region of the greater Philadelphia, PA-NJ area.)
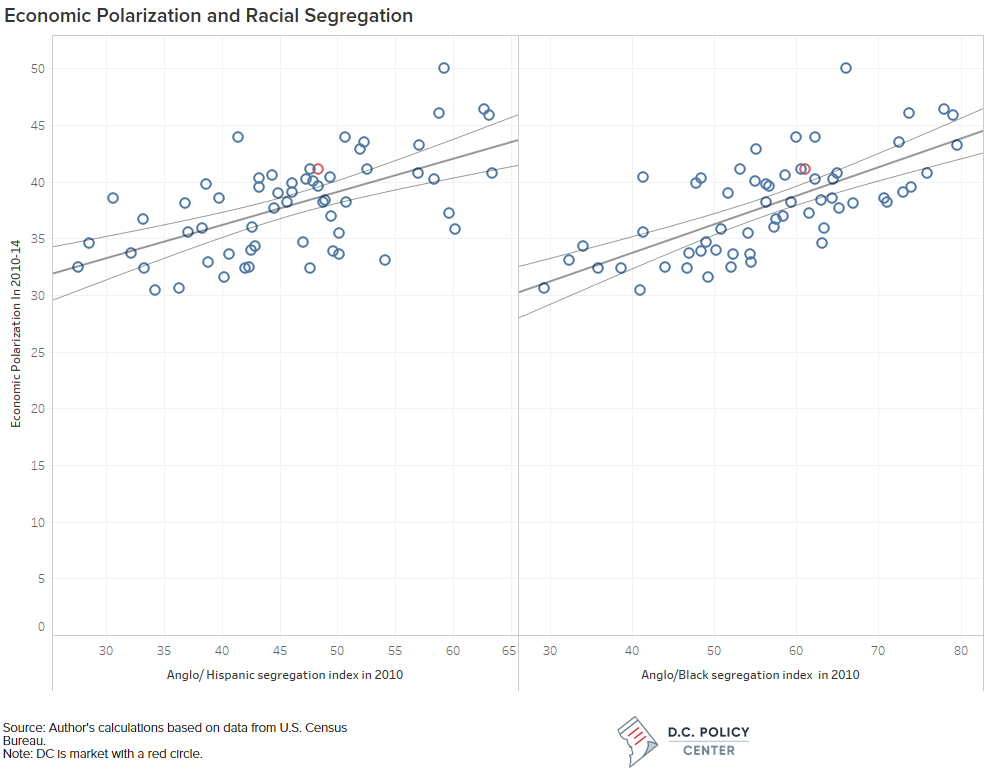
Each graph denotes Metro Washington, D.C. in red; it was 10th (tied with Charlotte and Houston) on the scale of economic polarization – on the boundary between the 1st and 2nd quintiles.[3] Its outlying factor (the highest bar) is city age. D.C. had attained an estimated 100,000 residents by about 1863 during the Civil War. The City of Washington was the country’s ninth oldest “big city” after New York City (1806), Baltimore (1839), New Orleans (1840); Boston and Philadelphia (1842), Cincinnati (1848), St. Louis (1853) and Chicago (1860).[4]
However, though the District of Columbia’s borders were fixed by the federal constitution (and shrunk further by Congressional retrocession of its 31-square mile Virginia portion in 1846), D.C. is surrounded by “Big Box” suburban counties that can adopt economically inclusionary zoning policies – as indeed many have.
This effectiveness of the region’s inclusionary zoning policies will also be explored fully in a future article.
“Big Box”/“little boxes”, and a reality check for personal bias
Readers may question why I added the Bridgeport CT and Albuquerque NM regions to the list of 58 metro areas over 1,000,000 in population. Part of the reason was to round out 60 regions that could be divided neatly into quintiles of a dozen metro areas each. Neither the Bridgeport-Stamford-Norwalk CT MSA (916,820) nor the Albuquerque NM MSA (887,077) missed the 1,000,000 threshold by much, and for several decades the Connecticut suburbs of New York City have been the most economically polarized region in the country. (The disparity between Bridgeport’s ghetto and ultra-wealthy Greenwich is truly Third World.)
But Albuquerque? Previous to my two decades in Albuquerque (1971-91), I had lived in the San Francisco Bay area, New York City’s suburbs, and within the boundary-constrained Washington, DC.
Living within a constantly expanding city like Albuquerque was an eye-opening experience for me. Albuquerque’s city limits had expanded from 11 sq. mi. in 1940 (the year I was born … in Oakland, CA) to 82 sq. mi. by the year we arrived. It would expand by another 50 sq. mi. during the two decades we lived there (including during my mayoralty) and by another 56 sq. mi. since we moved in 1991.
In the process, “elastic” Albuquerque captured 85 percent of Bernalillo County’s population growth and over 90 percent of its new tax base. While the fiscal consequences might be clear, what also captured my attention was a high degree of social integration. Readers who dive into the database for this article will find that Metro Albuquerque (dominated by the expanding central city itself) has the lowest level of Black/Anglo segregation, the 8th lowest level of Hispanic/Anglo segregation, and the 2nd lowest level of economic polarization.
Is this just a function of Albuquerque’s being the 8th youngest “big city” with much of the regional housing supply having been built in the post-civil rights acts era? That is undoubtedly a factor, but my sense was that within a “Big Box” city and a unified, county-wide school district, public officials (both elected and professional staff) tended to have a sense of serving (and accountability to) a broad, diverse constituency. Both institutional policies and culture encourage families of different racial backgrounds and different income levels to move around more fluidly from neighborhood to neighborhood and school to school within a “Big Box” than is true of moving among “little boxes’ elsewhere. And metro Albuquerque is certainly a “Big Box,” having the 3rd lowest level of governmental fragmentation.
Am I overly influenced by my Albuquerque experience? In the quarter century since, I have made community-specific presentations and consulted in 19 of the 21 “little boxes” regions and 30 of the 39 “Big Box” regions listed in the database.
I see the “Big Box”/“little boxes” phenomena constantly reflected both in the data I analyze and in the attitudes and aspirations of public officials, business and civic leaders, and concerned citizens whom I meet.
How local governance is organized within our nation’s metropolitan areas makes a difference.
Notes
[1] On a MSA-by-MSA basis, Dr. Logan’s data can be accessed at https://s4.ad.brown.edu/Projects/diversity/IncSegsorting/Default.aspx
[2] Most notably in The Big Sort: Why the Clustering of Like-minded America Is Tearing Us Apart by Bill Bishop and Robert Cushing (2008).
[3] In 2009, with economic polarization indices of 39.8 and 37.6, respectively, the Washington and Charlotte regions ranked 23rd and 34th respectively, indicating how relatively small changes in values can significantly affect relative ranking.
[4] In popular perception, Boston and Philadelphia were “big cities” much earlier but that perception embraced the two core municipalities’ numerous suburbs as well. The first national census in 1790, for example, listed the population of the City and County of New York as 33,131 (including a Harlem Division of 803 residents); City of Philadelphia (28,522) and “its suburbs” (13,998), or 42,520 in total; and Boston (18,038) plus 23 other towns in Suffolk County (26,837) – some of which in the next half century would be absorbed by the City of Boston (such as Roxbury, Dorchester, Brighton and Charlestown). Of note, the 1790 census recorded 2,180 slaves in the City of New York and 210 slaves in the City of Philadelphia. However, slavery had been outlawed by case law throughout Massachusetts, including Boston. For Massachusetts the 1790 census listed 5,463 “all other free persons” out of a statewide population of 378,787, or a presumed free black population of 1.4 percent. Massachusetts was the only state reporting zero slaves in the first census.
David Rusk is a Senior Fellow at the D.C. Policy Center. Rusk is a former federal Labor Department official, New Mexico legislator, and mayor of Albuquerque, the USA’s 32nd largest city. He is also the author of Cities without Suburbs. Now a consultant on urban policy, Rusk has worked in over 130 US communities in 35 states. Abroad, Rusk has lectured on urban problems in Canada, England, Germany, South Africa, and The Netherlands.