Over the past half century, the level of Black residential segregation in metropolitan Washington declined steadily, decade by decade. The Black segregation index (see an explanation of it here) dropped from 81 (hyper-segregation) to 61 (the threshold of medium segregation).
Residential segregation of Hispanics in metropolitan Washington has followed a reverse trend. Hispanic/Anglo segregation index rose from 31 in 1980 to 48 in 2015.
During the 1960’s, when my Argentine wife Delcia and I first lived in D.C., the Washington region’s small Hispanic population (2.5 percent) revolved largely around international agencies and the diplomatic community. Returning to D.C. in 1991 after two decades in Albuquerque, New Mexico, we found the region’s Hispanic population transformed. Updated to 2015, the Hispanic population has increased eleven-fold, now accounting for 16.0 percent of the ten, closer-in jurisdictions that comprised the metro area when we had left in 1971.
And the profile is strikingly different. Metro Albuquerque’s Hispanic population dates back four centuries. In 2015, only 19 percent of adults were born abroad, as were less than 4 percent of children. By contrast, 72 percent of Metro Washington’s adults were born abroad and 11 percent of its children.
Countries of Origin
Where have all these newcomers come from? In 2015, of Metro Washington’s 875,260 Hispanics:
- Almost one-third (280,262) were Salvadorans –an astounding number that would rank Washington as El Salvador’s second largest city. In fact, Robert F. Kennedy Memorial Stadium is often referred to as “El Salvador’s national soccer stadium” for the enormous number of Salvadoran soccer fans that turn out for the annual matches of El Salvador’s national soccer team at RFK. (DC United, our local professional team and my passion, found out how proud and devoted local Salvadoran soccer fans are when in 1998, we traded away our Salvadoran star, Raul Diaz Arce, after two outstanding seasons, permanently alienating several thousand heretofore DC United Salvadoran soccer fans. They’ve never returned.)
- Mexicans (132,096) were the second largest nationality group solely on the basis of being so dominant nation-wide. Less than half of one percent of all Mexican ancestry persons in the USA lived in the Washington area.
- Third were Guatemalans (63,622) who share a tumultuous recent history in Central America with Salvadorans but were less than a quarter of the latter’s numbers locally.
- Fourth were fellow citizen Puerto Ricans (60,378) whose homeland may become our 51st state before D.C. ever attains statehood.
- Fifth were Peruvians (48,741) and sixth were Bolivians (45,059) – an extraordinary 40 percent of all Bolivians in the whole USA. (Two of whom – Marco “El Diablo” Etcheverry” and Jaime Moreno – were DC United’s all-time greatest players.)
As I outlined in my previous article, Suburbia: the Promised Land?”, declining Black segregation was driven primarily by steady suburbanization of D.C.’s Black population (76 percent of the metro area’s total in 1970).
Relatively Even Distribution
But even in 1970, the region’s small Hispanic population was never concentrated in the central city; only 22 percent of the region’s Hispanics lived within DC then. And the massive, eleven-fold increases in the region’s Hispanic population have been pretty well scattered proportionally among the region’s core jurisdictions.
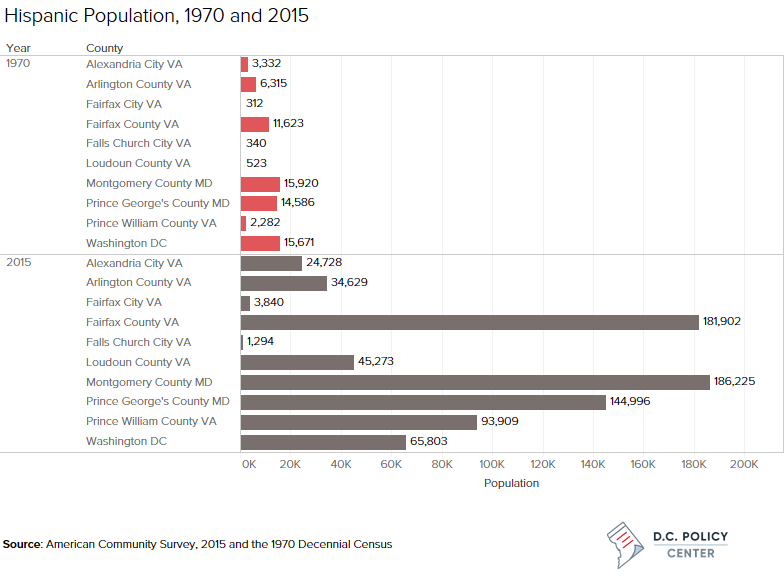
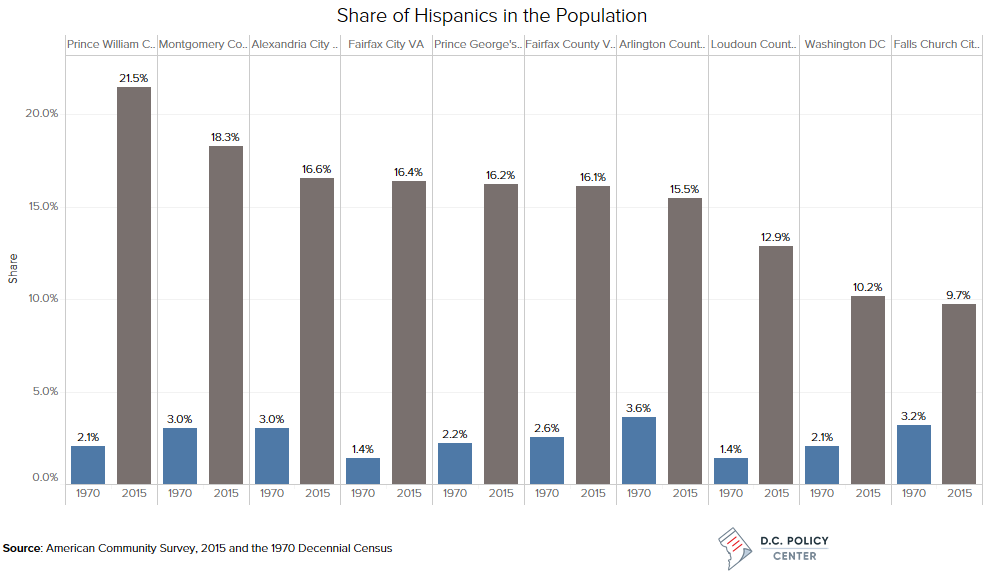
The distribution varied from 1.4 percent (Loudoun County and Fairfax City) of the jurisdictional population to 3.6 percent (Arlington County) around a region-wide 2.5 percent in 1970. In 2015, though the region-wide percentage of Hispanics had ballooned to 16.0 percent, it varied only from 9.7 percent (Falls Church City) to 21.5 percent (Prince William County). However, within these jurisdictions there has been a degree of clumping together of Hispanics in certain neighborhoods – hence, the increase in the Hispanic/Anglo segregation index from 31 in 1980 to 48 in 2015.
Such racial/ethnic concentration has never been as extreme for Hispanics as it has been for Blacks. Even with the progress made over the past 45 years, in 2015 metropolitan Washington still had 43 census tracts within D.C. (all east of the Anacostia) and 35 in Prince George’s County that were more than 90 percent Black.
Metropolitan Washington had zero census tracts that were more than 90 percent Hispanic. The region did have 36 census tracts that were majority Hispanic residents – 13 in Prince George’s County, 10 in Montgomery County, but none in DC itself. The average proportion of Hispanics in majority Hispanic tracts was 61 percent.
The National Picture
How do Metropolitan Washington’s trends regarding Hispanic segregation compare with other large metro areas? This table divides 49 metro areas of more than 1 million residents into six categories (A to F) : first, by the percentage of Hispanics they had in 1980, then, by their percentage growth in Hispanic population between 1980 and 2010.
 While everyone would agree that growth rates of 1,125 percent to 3,723 percent represents “explosive growth,” it’s doubtless hard to accept that a growth rate of 265 percent (that is, almost quadrupling) should be characterized as “modest growth” yet that’s the relative reality of Hispanic population dynamics over these three decades.
Note that the category A (less than 5 percent Hispanic/explosive growth) metro areas—there are six of them, and most are in the south–saw their Hispanic/Anglo segregation indices leap upward, on average, from 26.3 to 44.9 – an 18.7 point increase. The twenty category B metro areas (with less than 5 percent Hispanic/rapid growth) also, on average, saw significant increases in Hispanic segregation indices from 33.8 to 42.9 – and this is the category into which Metropolitan Washington falls.
At the other end of the spectrum, the three category F metro areas (more than 20 percent Hispanic/modest growth) saw an overall reduction in Hispanic segregation indices from 55.8 to 51.8. In fact, setting aside Las Vegas NV (a national outlier in almost every demographic metric), the other categories which were either Rust Belt/slow job growth metro areas (category C) or which had more appreciable, established Hispanic populations in 1980 (categories D, E and, as noted, F) effectively average relatively stable or declining Hispanic segregation indices.
Temporary “Ponding” or Permanent Barrios?
Does the increase in Hispanic segregation in regions with explosive or rapid Hispanic growth (either through immigration from abroad or internal migration from other areas of the USA) represent just a temporary “ponding together” of newcomers for mutual aid and support of relatives, friends and ethnic societies and churches as has occurred historically with other immigrant groups? With time and greater demographic stability will Hispanics scatter out into a wider range of more diverse neighborhoods? Or does this increase presage the creation of permanent, highly isolated, largely low income Hispanic barrios akin to Black ghettoes?
The data do not provide a clear answer yet.
But my experience of Albuquerque offers hope. Metro Albuquerque’s population was 36 percent Hispanic in 1980 and, with its Hispanic population growing to 47 percent in 2010, still saw a steady decrease in Hispanic segregation indices from 45.0 in 1980 to 36.4 in 2010.
In text note:
[metro] The Washington DC-MD-VA metro area in 1971 was composed of the District of Columbia; Montgomery and Prince George’s counties in Maryland; and Arlington, Fairfax, Loudoun, and Prince William counties and the cities in Alexandria, Fairfax and Falls Church in Virginia.
This post has been updated to fix minor grammar mistakes.
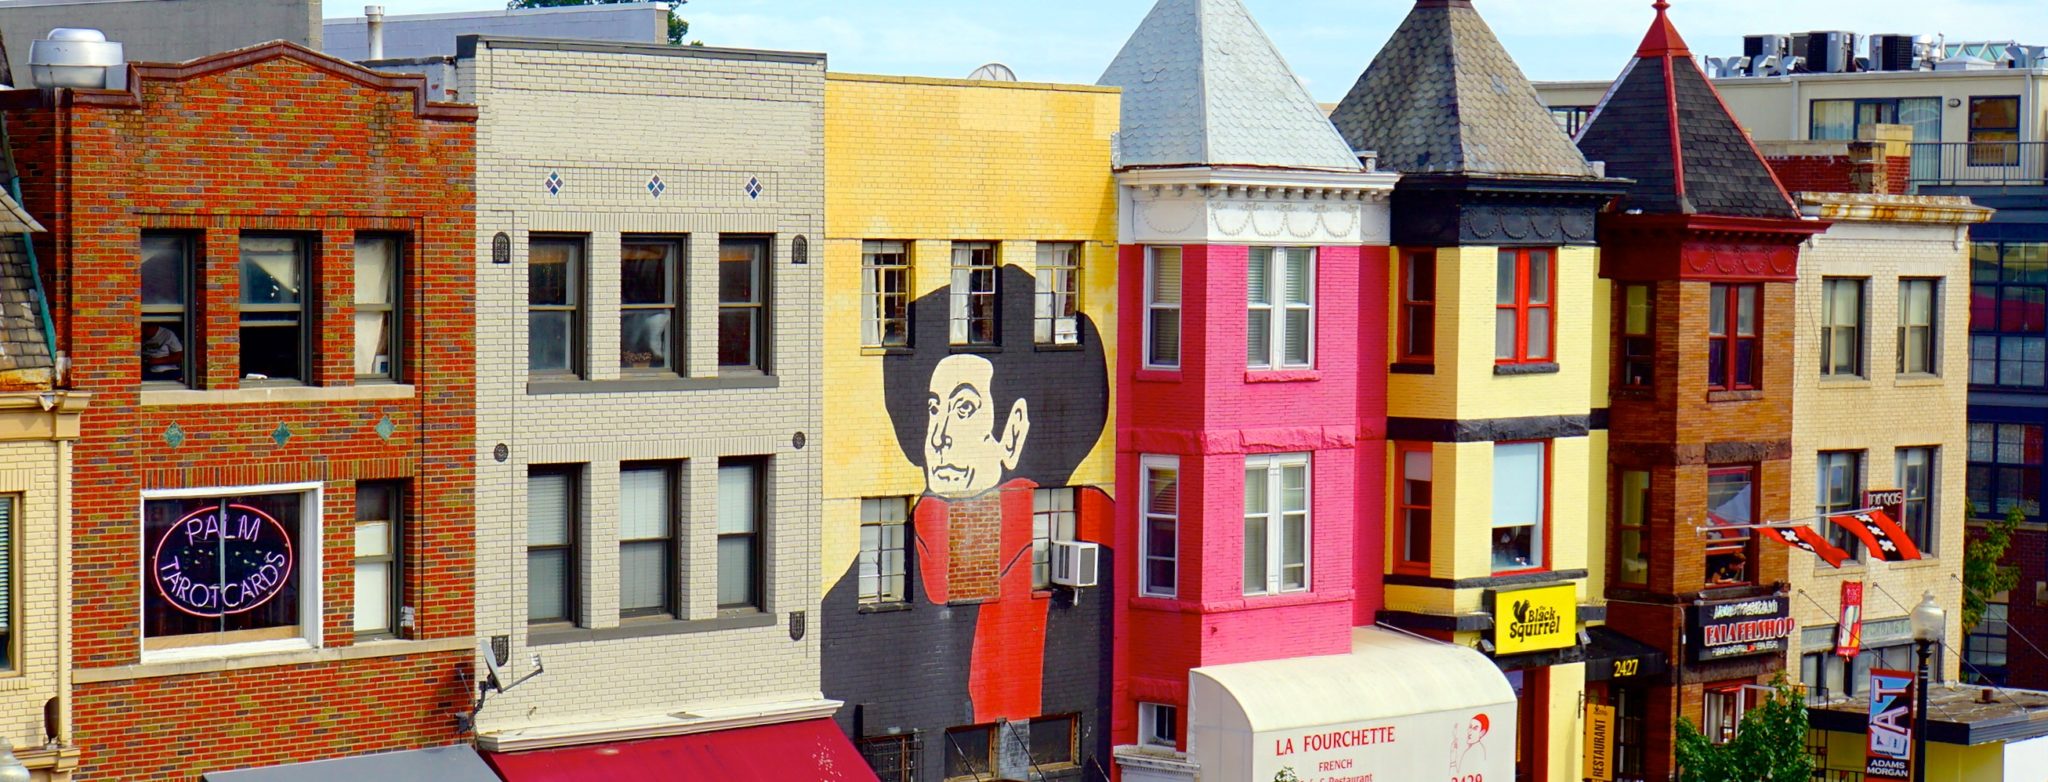
Feature photo by Ted Eytan (source).
David Rusk is a Senior Fellow at the D.C. Policy Center. Rusk is a former federal Labor Department official, New Mexico legislator, and mayor of Albuquerque, the USA’s 32nd largest city. He is also the author of Cities without Suburbs. Now a consultant on urban policy, Rusk has worked in over 130 US communities in 35 states. Abroad, Rusk has lectured on urban problems in Canada, England, Germany, South Africa, and The Netherlands.
Table of Metropolitan Area Groupings used in this study
| Metro Category | % growth in Hispanics 1980-2010 | Average Hispanic segregation index in 1980 | Average Hispanic segregation index in 2010 | Average change in Hispanic segregation index 1980-2010 |
| Group A. less than 5% Hispanic; explosive growth | 1125% to 3723% | 26.3 | 44.9 | 18.7 |
|
||||
| Group B. less than 5% Hispanic; rapid growth | 330% to 988% | 33.8 | 42.9 | 9.2 |
|
||||
| Group C. less than 5% Hispanic; modest growth | 84% to 265% | 47.8 | 46.0 | -1.8 |
|
||||
| Group D. 5% to 10% Hispanic; modest/rapid growth (without Las Vegas) | 193% to 1521% (193% to 629%) | 47.6 (50.8) | 48.5 (49.3) | 0.9. (-1.5) |
|
||||
| Group E. 10% to 20% Hispanic; modest/rapid growth | 78% to 589% | 46.2 | 49.9 | 3.7 |
|
||||
| Group F. more than 20% Hispanic; modest growth | 127% to 180% | 55.8 | 51.8 | -3.9 |
|
||||
| Table Note: Segregation index: scale 0 to 100 (100 = total apartheid); lower numbers represent improvement | ||||