

In school year 2022-23, the District of Columbia implemented an Equitable Access (EA) option in the common lottery for public schools – to prioritize at-risk students’ applications in the common lottery and increase socioeconomic diversity at schools with small percentages of at-risk students.
This report examines the profile of EA schools, the number of at-risk applicants to high-quality schools in pre and post lottery rounds, which schools had enrollment changes after the option was implemented, matriculation rates for students accepted in these schools, and the impact of the EA option on enrollment. It also highlights schools’ plans for moving forward with the EA option in later school years.
Quick Links
- Access a printer-friendly PDF version of the full report here.
- Access the 1-page report summary here.
- View the launch event, including a recording, here.
Other reports in this series
- At-risk priority in D.C.’s common lottery: Potential implications for access and diversity
- At-risk application patterns in D.C.’s common lottery
Executive Summary
In school year 2022-23, the District of Columbia introduced an Equitable Access (EA) option at the systems level in the common lottery system for public schools.1 This allowed District of Columbia Public Schools (DCPS) and public charter schools to prioritize applications from students who are designated as at-risk for funding purposes (henceforth referred to as “at-risk students”).2
Two studies conducted in 2020 by the D.C. Policy Center’s Education Policy Initiative3 4 indicated an EA option could significantly change enrollment patterns for some schools and for some at-risk students and promote socioeconomic diversity at these schools. This report now examines the outcomes of the first year of EA, revealing the proportion of at-risk students increased among participating schools.
The key findings of the report are the following:
- In its inaugural year, 25 schools (out of 251) opted into EA.
- Six schools filled 17 percent of their seats via an EA preference in the common lottery, while 19 schools filled, on average, 18 percent of their seats, through “designated seats.”
- Before they participated in the EA option, schools that participated in EA were typically serving a lower proportion of students who are designated as at-risk (38 percent) compared to the District-wide average of 52 percent.
- In school year 2022-23, there were 33,525 applicants to the common lottery,5 and 47 percent of these applications were from at-risk students.6 Notably, this year, the share of at-risk applicants who applied before the lottery deadline increased by 4 percentage points to 48 percent.
- The share of common lottery applications from at-risk students increased by more than 8 percentage points between school years 2021-22 and 2022-23.
- EA schools saw a significant increase in their at-risk applicant numbers: applications more than doubled across all EA schools.
- As a result, most schools implementing the EA option experienced an increase in the percent of students who are at-risk in their entry grades.
- Specifically, 14 of the 25 EA schools had so few at-risk students (fewer than 10 at-risk students in their entry grade) in school year 2021-22 that the Office of State Superintendent of Education did not disclose the number of at-risk students. Eight of these schools increased the share of at-risk students in their entry grade to an average of 29 percent (approximately 16 at-risk students) after adopting the EA option.
- Matches from EA were more likely to result in student enrollment compared to matches from the overall lottery. 59 percent of EA-matched students matriculated compared to 55 percent across all seats.
Additionally:
- A D.C. Policy Center-administered survey among school principals indicated a majority (74 percent) felt EA outcomes in the first year were in line with their goals, which included increasing diversity, access, enrollment, or alignment with the school’s mission. To better serve the increased number of at-risk students, many schools offered some form of additional resources to support at-risk students, with a plan to increase their enrollment goals in the following year.
- Preliminary analyses of the 2023 common lottery (Year 2 of EA) showed an increase in the popularity of the EA option, with nine additional schools offering the EA option through designated seats or a lottery preference and matches increasing to 583.7
I. Why is it important to examine implementation of the EA option?
In 2020, leaders in the District wanted to include a priority for at-risk students in the common lottery, the centralized system for placing students in public charter schools, District of Columbia Public Schools (DCPS) citywide schools, DCPS schools as out of boundary students, and pre-kindergarten at any school. To inform and shape this policy, the D.C. Policy Center collaborated with school leaders and education agencies and conducted two studies to understand how such a preference might work, especially in schools with lengthy wait lists but a small number of at-risk students.
The research revealed that while giving priority to at-risk students through the common lottery could have limited effects across the entire public school system, it could significantly change access to highly sought-after schools that currently have few at-risk students. It was also found that while a lottery preference might enhance access for at-risk students, designating seats for them could be more effective. This is because many at-risk students tended to submit their applications after the lottery deadline, which often placed them at the bottom of the waitlist.
In the District of Columbia, there is a high degree of public school choice. Only 28 percent of students attend their in boundary DCPS school, meaning at least 72 percent of students have used the common lottery at some point to access their current school. That is, the common lottery, rather than boundary designation, is the key mechanism for matching students to public schools.8 Preferences incorporated into the lottery are influential — they determine 35 percent of matches at the time of the lottery.9 These preferences can have outsized impacts on school demographics. As such, understanding how the EA option worked in its first year is crucial, especially in terms of increasing diversity.10
The disparity in the share of at-risk students across schools also makes it critical to examine how EA was implemented in its first year at the systems level (DCPS had two newly opened schools participating for two years prior to school year 2022-23).11 In school year 2022-23, 52 percent of students were designated as at-risk.12 However, at schools with the longest waitlists (over 200 applicants in an entry grade), only an average of 15 percent of students were designated as at-risk. Factors like the sibling preference (making up 17 percent of all matches and up to 29 percent of matches in PK3)13 and word of mouth (about half of D.C.’s public school parents consider it a influential factor in school selection14) significantly affect enrollment. When siblings are admitted and word of mouth spreads within communities, these factors create a challenge in altering student composition, especially at schools with a low percentage of at-risk students. The EA option has the potential to increase socioeconomic diversity at these schools, but the pace of change would depend on how school leaders implement it.
This report examines EA’s first year impact on schools and influence on applicant behaviors. This report further explores how schools adapted their recruitment strategies and overall practices to support at-risk students academically and engage their families.
The findings can guide the future implementation of EA and the consideration of new preferences or expansions in 2023 Boundary and Student Assignment process led by the Office of the Deputy Mayor for Education (DME).
II. How does EA work?
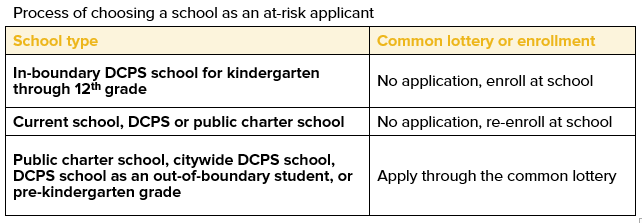
EA is intended to increase access for at-risk students in D.C. to their school of choice, including their in-boundary District of Columbia Public Schools (DCPS) option. If at-risk students are most interested in their in-boundary DCPS school, they have a guaranteed seat beginning in kindergarten. If they seek a DCPS school as an out of boundary student, a public charter school, citywide DCPS school, or a pre-kindergarten seat, they must apply in the common lottery.
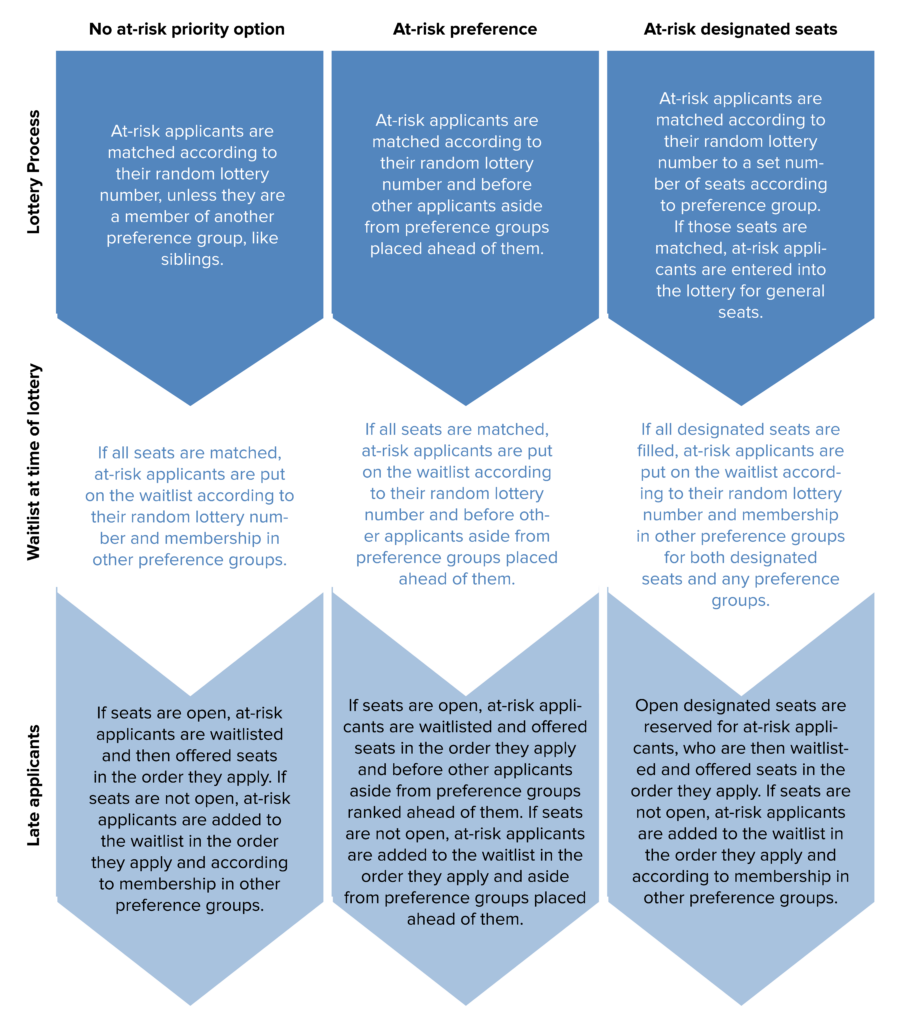
For those applying in the common lottery, schools have two primary methods to give priority to at-risk students. First, they can opt for an at-risk preference integrated into the common lottery. Alternatively, schools can reserve designated seats for at-risk students and keep these seats exclusively open for at-risk applicants until they are all filled or until June 1st, the earliest date recommended by My School DC to keep seats open. Local education agencies (LEAs) can choose whether to use a preference option or designated seats and how to implement—although the DC Public Charter School Board (DC PCSB) must approve LEA applications to implement the option, and DCPS has its own process to determine how schools implement it.
Preference option
When a school chooses a preference option, they must choose how highly to place at-risk students in their preference order. If a school places at-risk applicants ahead of other groups, at-risk students participating in the lottery are matched first. If seats are filled before all at-risk students are matched, the unmatched at-risk students are placed at the top of the waitlist. On the other hand, if a school places different preference groups, like siblings, at-risk students will only be offered seats after all sibling matches are made. If an at-risk student applies after the lottery deadline, they will be placed at the bottom of the waitlist for other at-risk applicants (potentially ahead of other groups that are ranked below). If an at-risk student is eligible for multiple preferences, they will be matched according to the preference the school places most highly.
Designated seats option
If schools designate seats, they are committed to matching all the designated seats by at-risk students at the time of the lottery. Within the designated seats category, schools also have a set of preferences that can include in-boundary for DCPS schools or siblings, for example. Under this scenario, if on the lottery day there are not enough at-risk students to fill available seats, schools will be able to offer these seats to at-risk applicants who submit their application after the lottery deadline. If schools do not match all the EA seats through the lottery, they can keep them open through the post-lottery period.
III. Which schools implemented the EA option and what was the outcome?
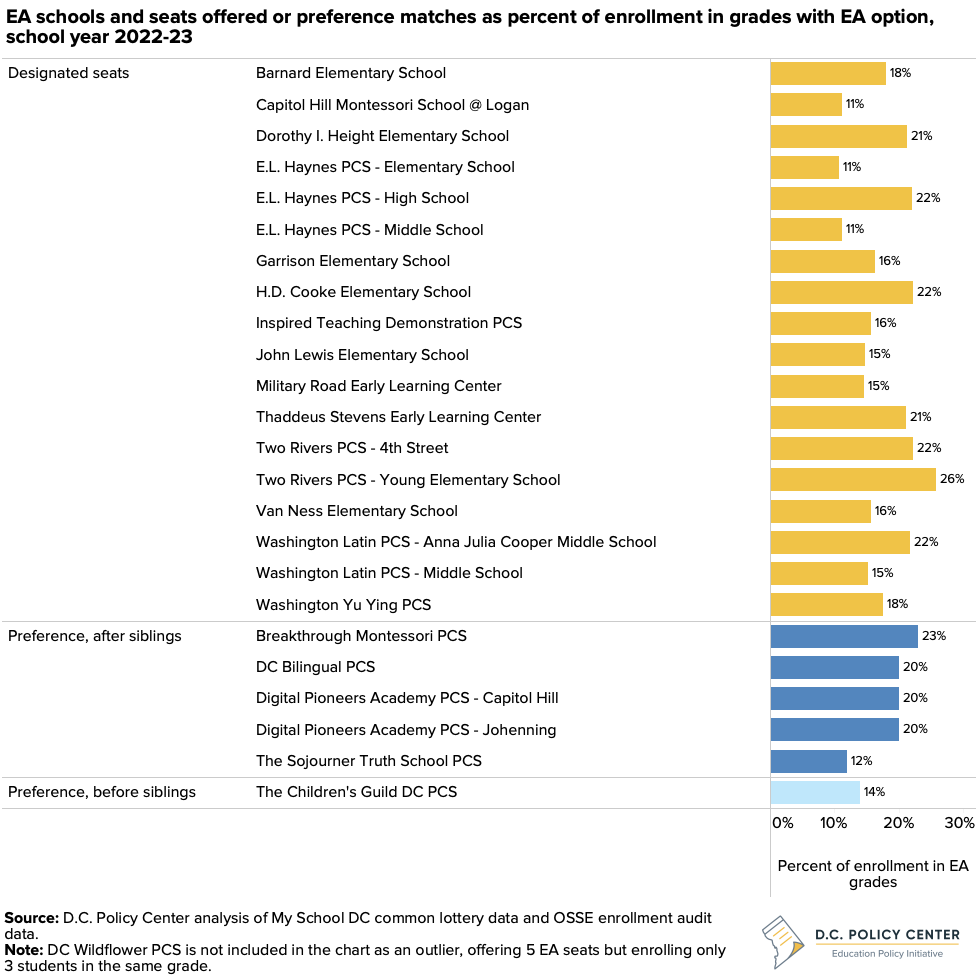
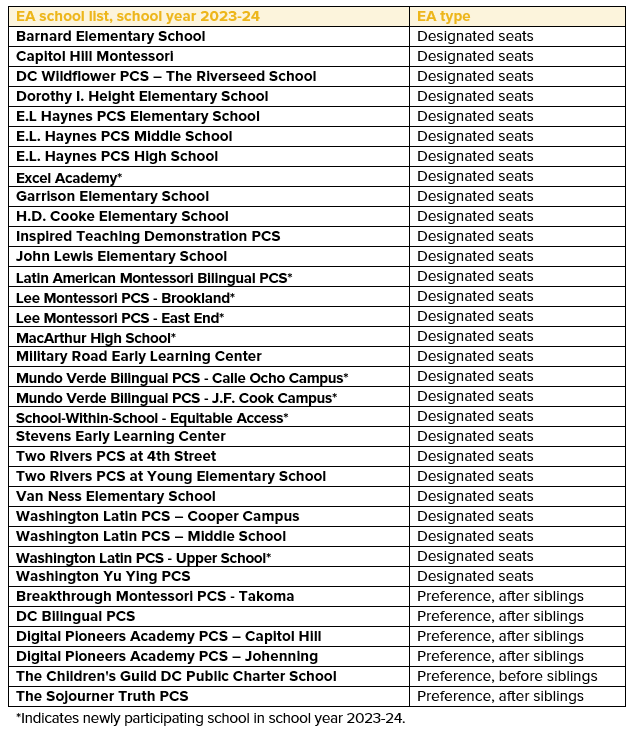
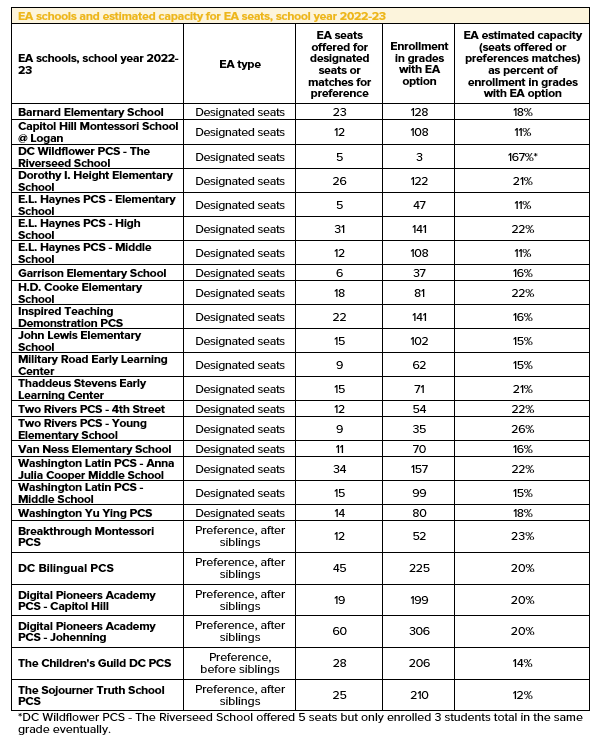
In school year 2022-23, among 251 schools serving students in pre-kindergarten through 12th grade, 25 used the EA option in the common lottery. Of these, six schools implemented EA as a preference—matching 18 percent of seats in offered grades through EA. Five out of the six schools with a preference ranked EA after siblings, a commonly used preference. Meanwhile 19 schools chose to designate seats, also generating, on average, 18 percent of the enrollment in grades where they offered the EA option (see Appendix E for more information). An additional nine schools incorporated the EA option in the upcoming 2023-24 school year (see Appendix B: EA school list, school year 2023-24 for a list).
Profile of EA schools
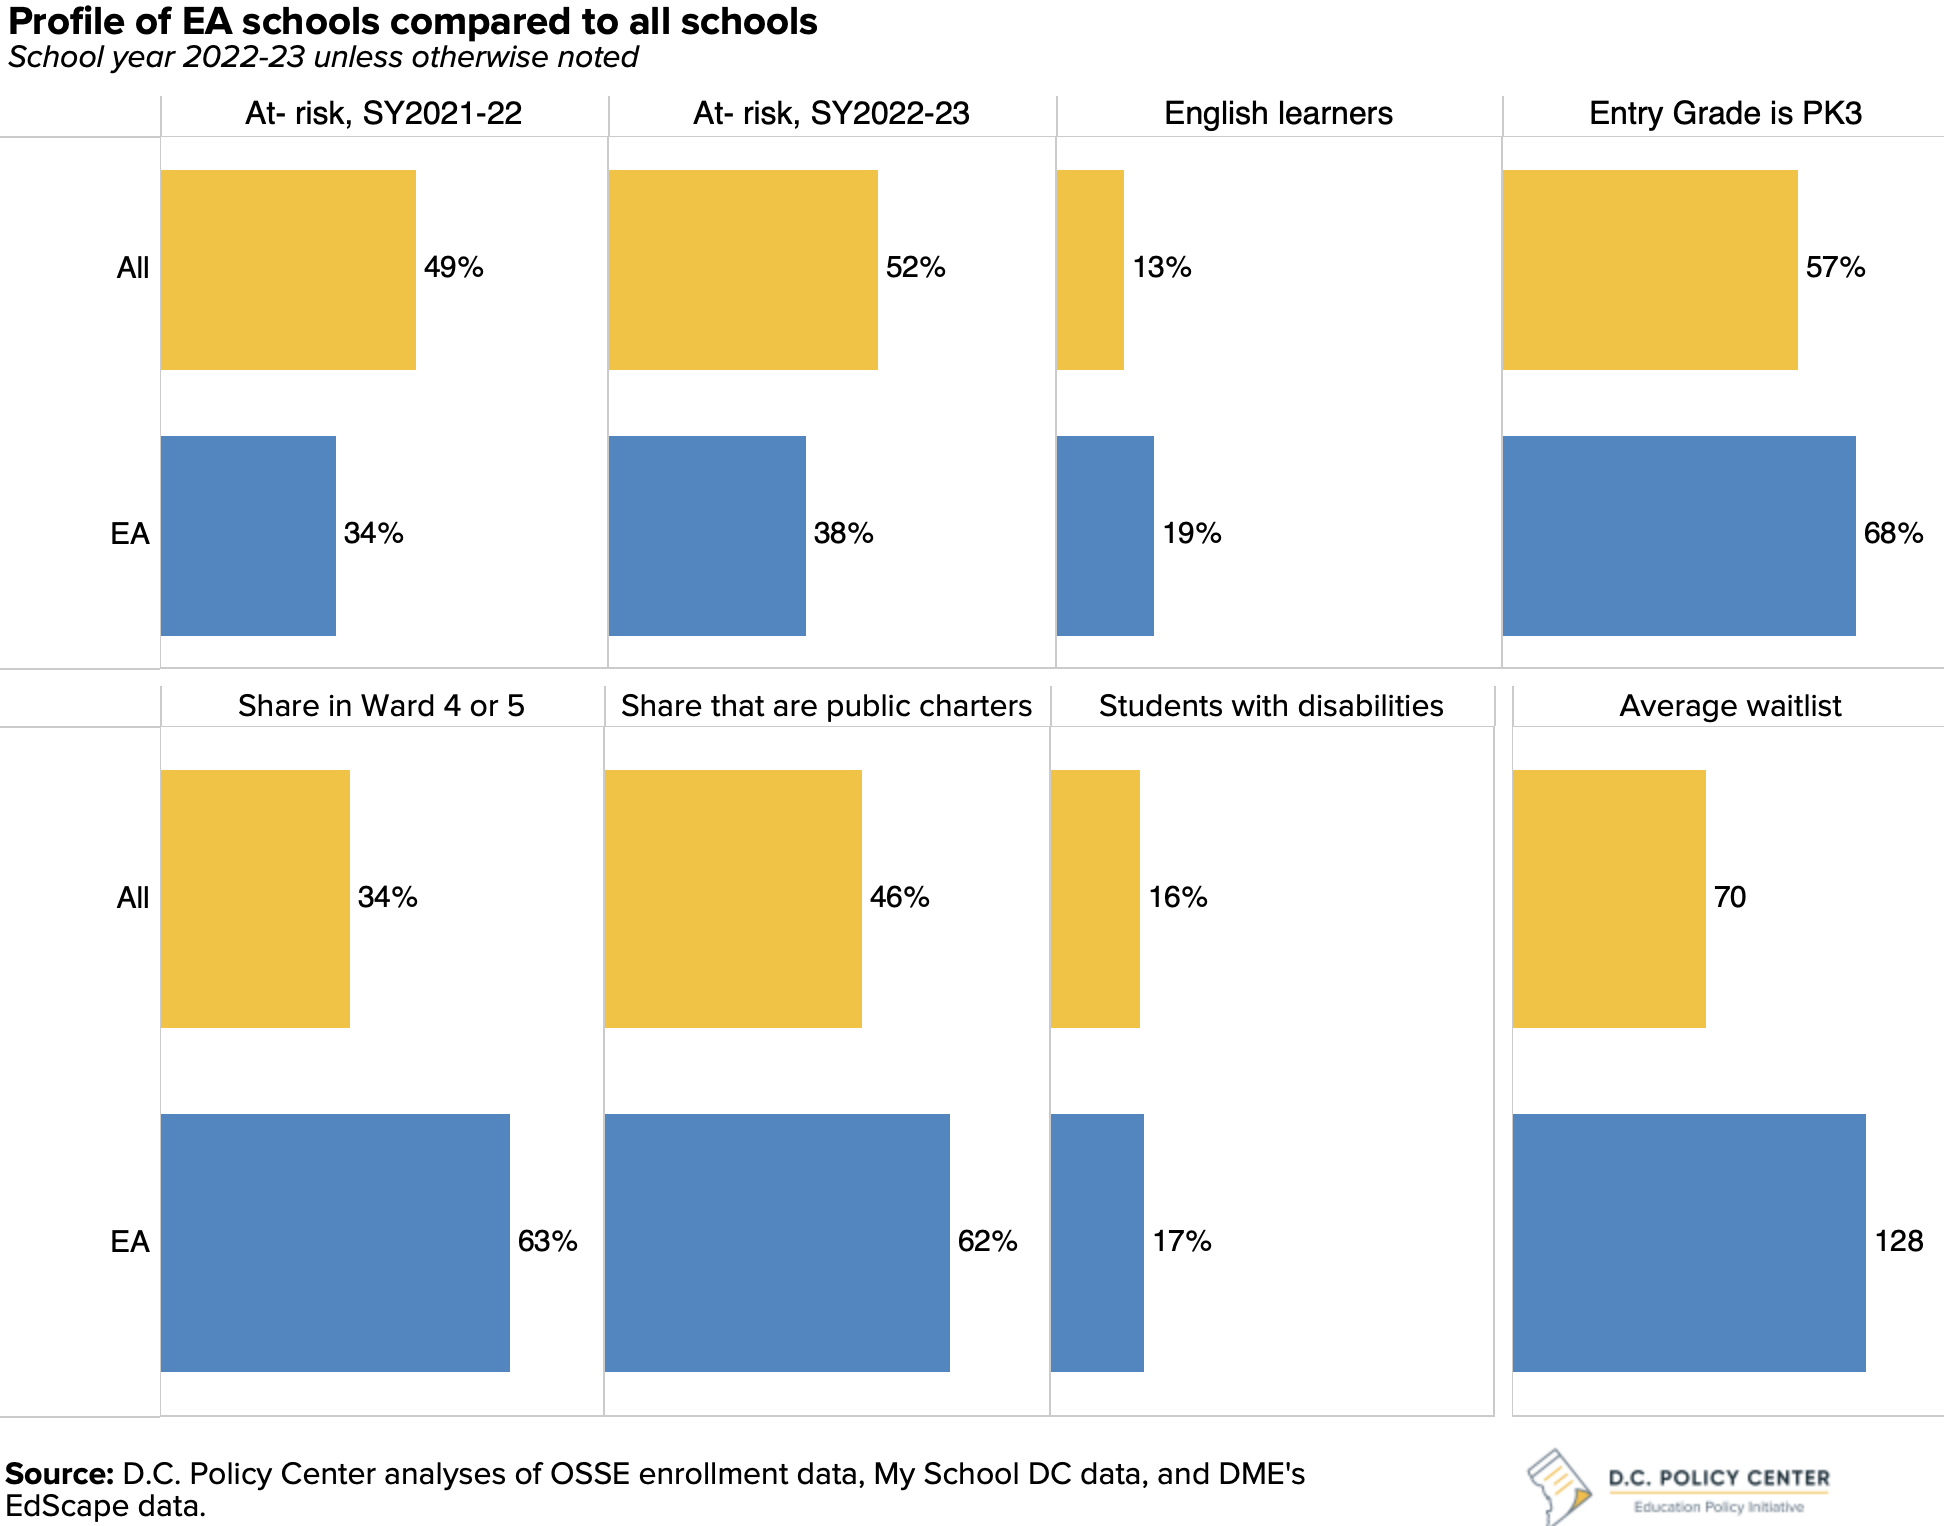
The 25 schools that utilized the EA option differed from the typical pre-kindergarten through 12th grade school in D.C. in five different ways, before they offered the option.
- EA schools tend to serve a smaller percentage of students designated as at-risk, standing at 38 percent, compared to 52 percent of students at all schools. This aligns with the EA’s goal of increasing at-risk enrollment.
- EA schools have a higher proportion of English learner students comprising 19 percent of their enrollment compared to 13 percent across all public schools.
- EA schools are more likely to be public charter schools: 62 percent of EA schools are public charter schools compared to 46 percent of all schools.
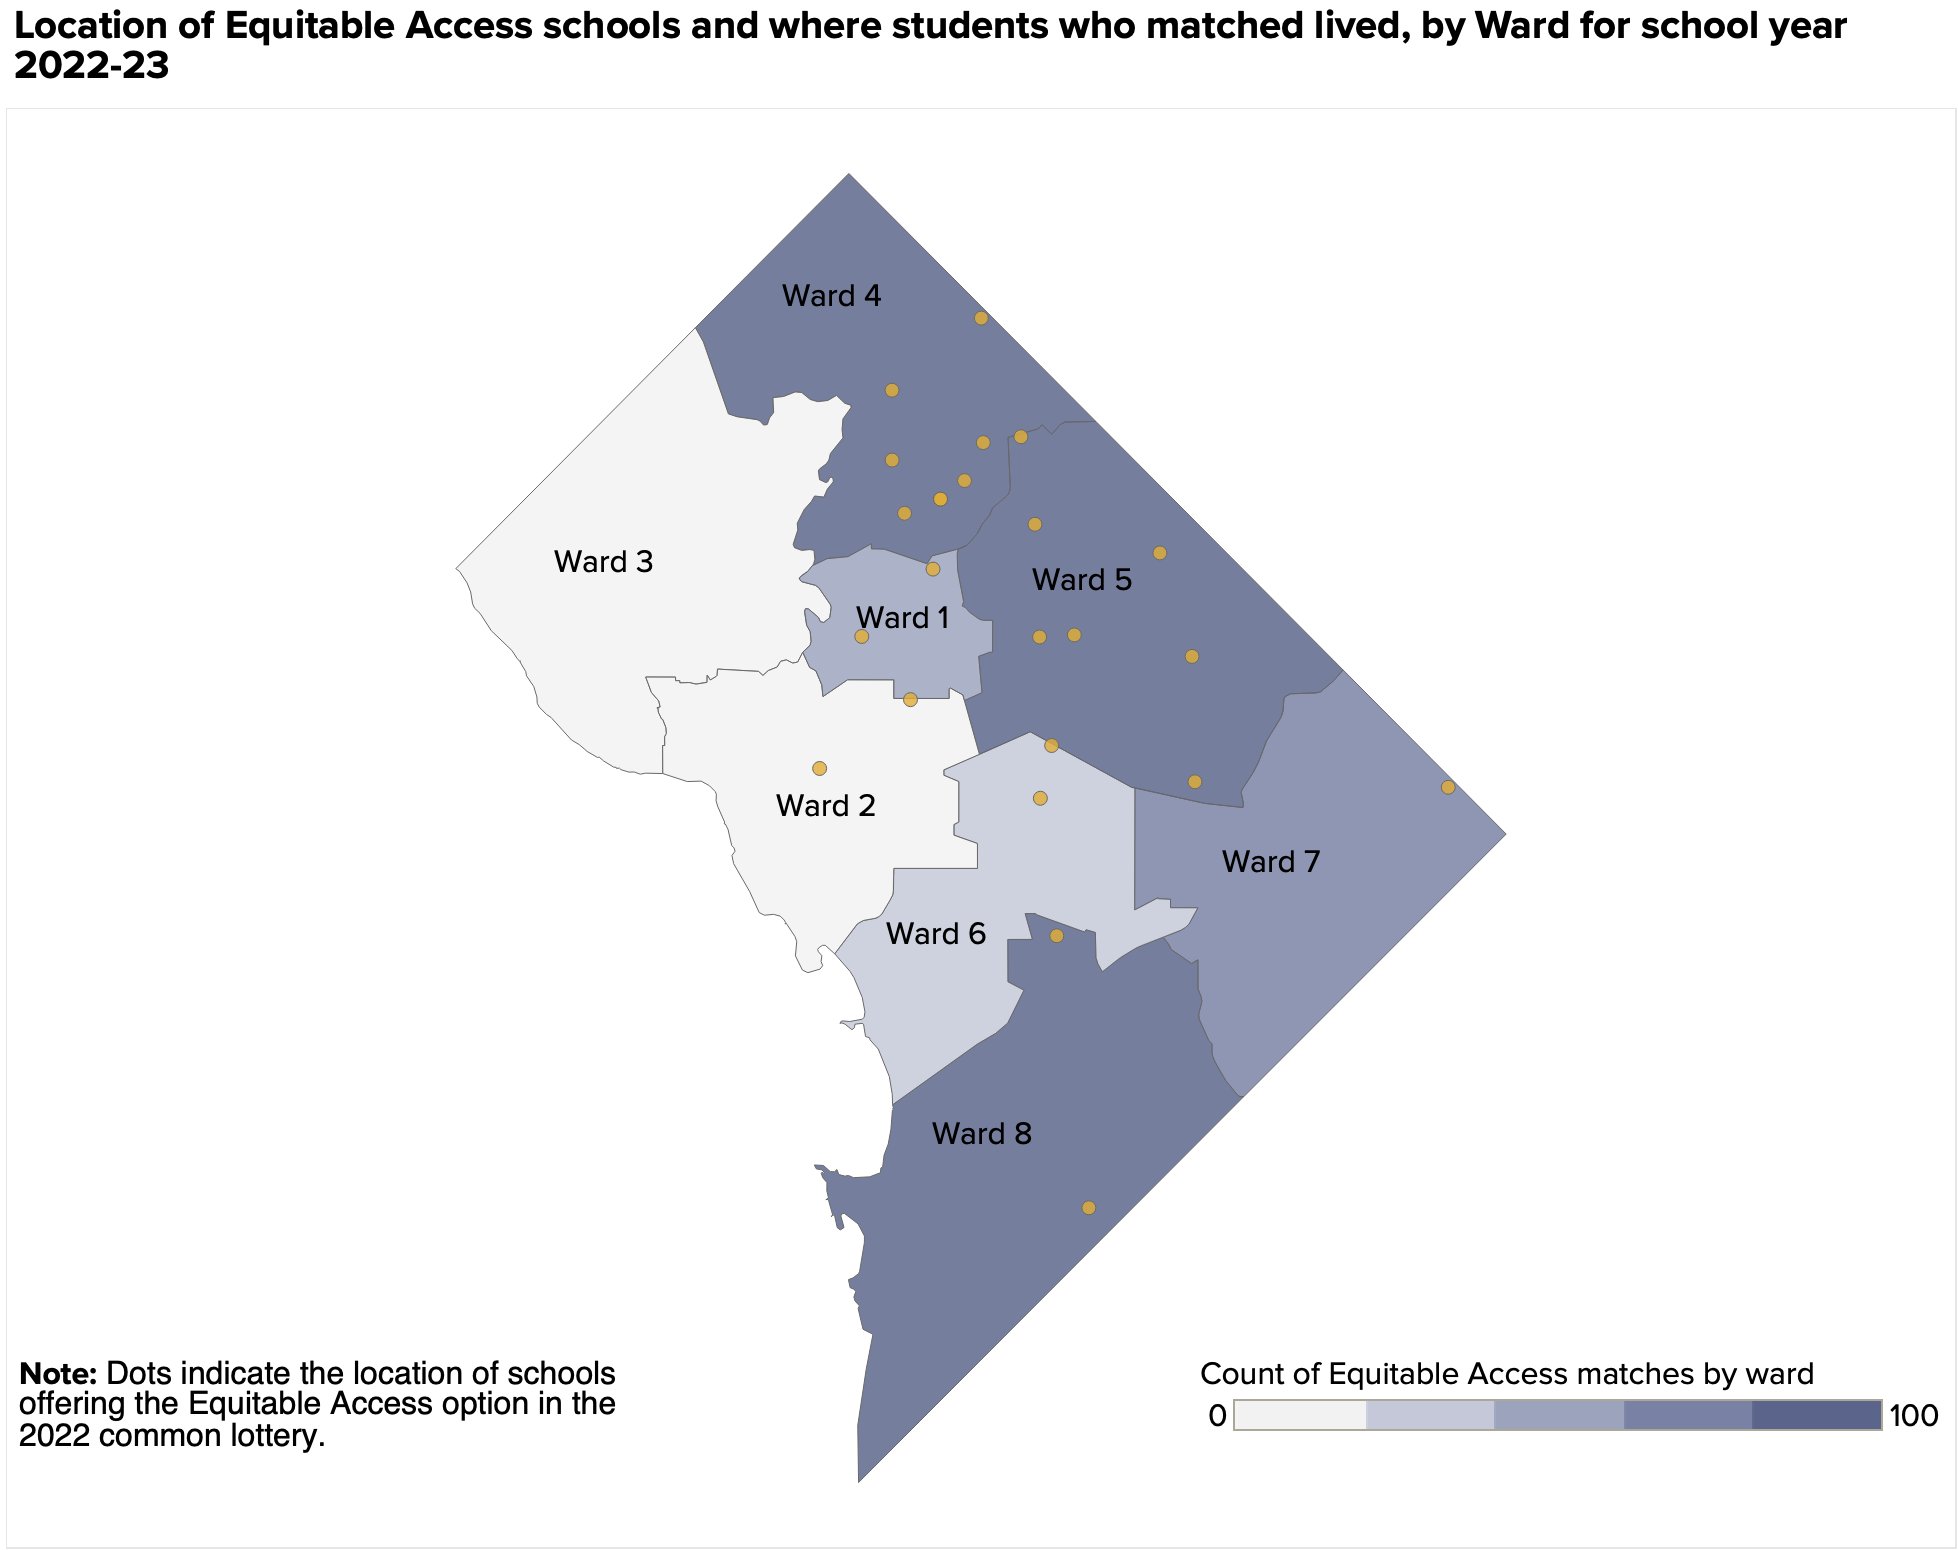
- EA schools are notably concentrated in Wards 4 and 5 – 63 percent of EA schools are located in these two wards compared to 34 percent of all schools that are located in Wards 4 and 5.
- EA schools have longer waitlists in their entry grades, with an average of 128 applicants compared to 70 applicants across all schools.
IV. Seats made available through EA and matches
At the time of the lottery, there were 400 matches through EA option, which accounted for 2 percent of all 16,279 matches systemwide (this is not a net measure and does not account for at-risk students who matched outside of EA, for example with a sibling preference, or at-risk students who would have matched without EA). Matches are created through the common lottery’s algorithm, and they are based on a randomly generated lottery number, any preferences or designated seats the school offered, and the order in which students ranked schools on their applications.
Designated seat matches
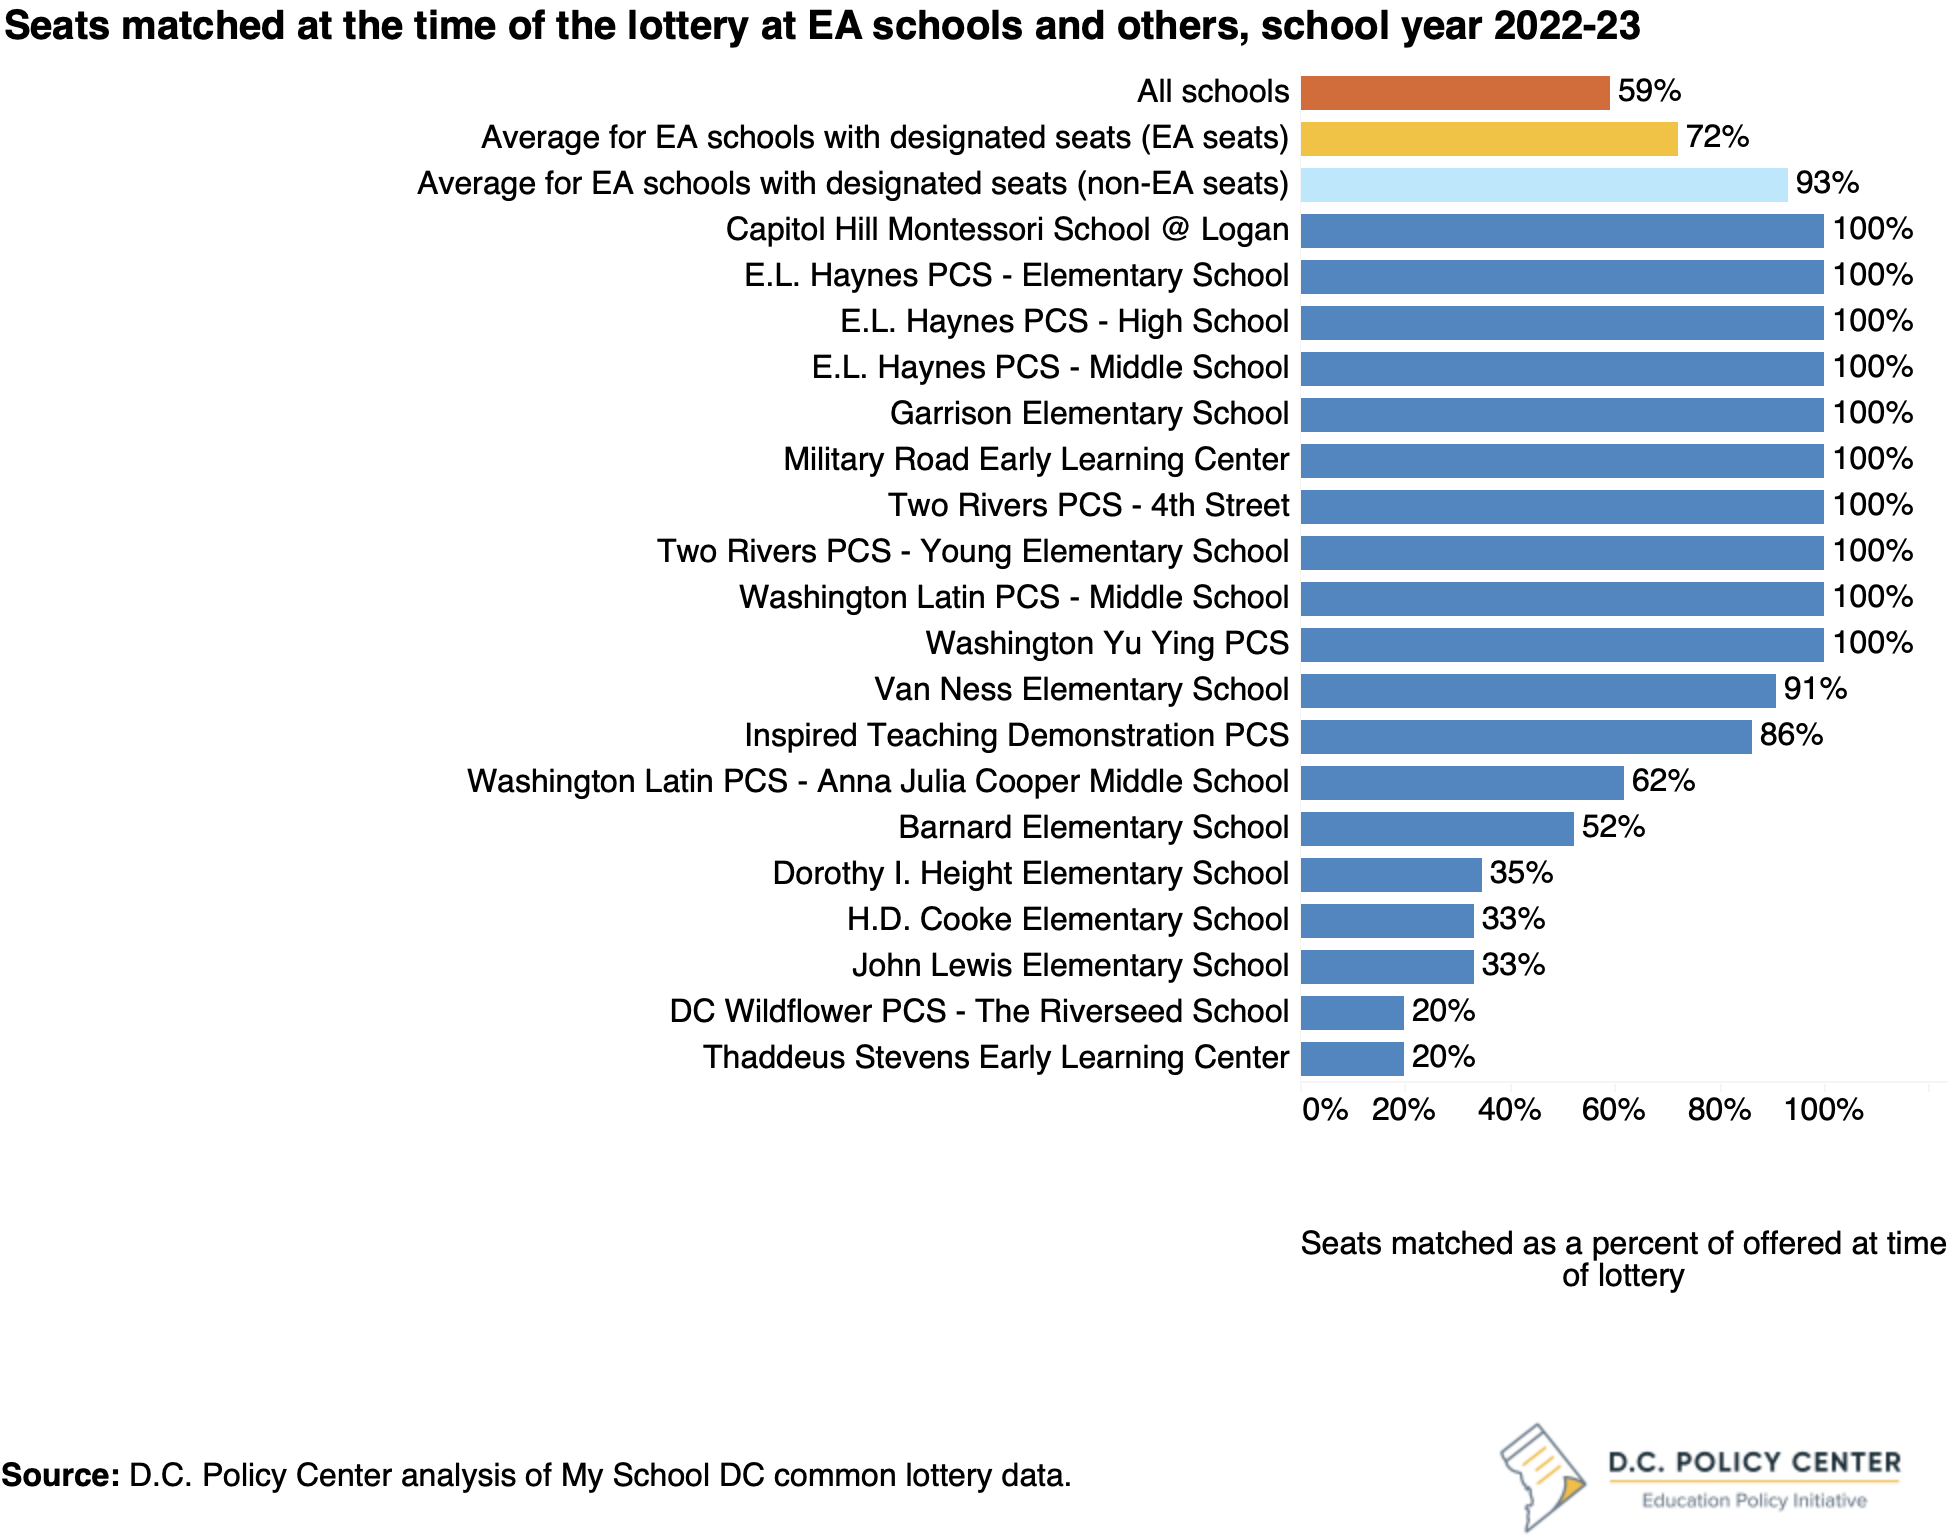
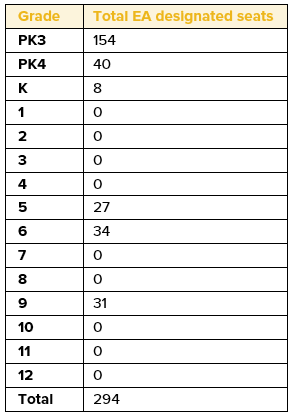
Across 19 schools that chose to designate seats, 294 seats were made available through the EA, with the highest number available in PK3, totaling 154 seats. As noted before, designated seats differ from the preference seats as they are exclusively reserved for at-risk students even after the lottery.15 By early April 2022, 211 at-risk students were successfully matched to these designated seats, filling 72 percent of seats made available at the time of the lottery. This match rate stands higher than the 59 percent rate for seats offered by all schools combined.
However, across EA schools, there were noticeable differences: 10 out of 19 schools with designated seats matched all their offered seats, but two schools could only match 20 percent. Variations in match rates might be due to differing recruitment strategies. Some schools, especially those with historically long waitlists, might need to intensify their efforts when recruiting at-risk students. Interestingly, while the designated seats’ match rate for EA schools surpassed the city average, the match rate for non-EA seats in those same schools was even greater, at 93 percent.
Preference matches
In total, 189 applicants were successfully matched through the EA lottery preference, with the highest number of matches occurring in 6th grade, amounting to 50 matches. Additionally, 126 eligible applicants were waitlisted at schools offering EA as a preference. For additional context, while preferences are influential, they do not shape the entire lottery. An estimated 65 percent of all matches had no preference. And EA ranks the third most-common preference at 3 percent of all matches, following sibling (17 percent of the matches) and in-boundary (9 percent) preferences. Unlike in-boundary preference, which is typically offered at PK3 and PK4, at least some seats in all grades except 12th grade have been made available through the EA preference.
Findings from school questionnaire: Changes to school approaches
In spring of 2023, the D.C. Policy Center circulated a questionnaire to evaluate the first-year implementation of EA. Among the 25 schools implementing EA, 14 schools responded to the survey. Respondents were comprised of 12 public charter schools and two DCPS schools and collectively made up 58 percent of enrollment at EA schools. The questionnaire covered topics such as schools’ objectives, recruitment strategies, engagement with families and the community, as well as support systems provided to students.
The primary reason schools participated in EA was to boost the enrollment of students designated as at-risk, followed by the statement that the EA preference was aligned with the school’s mission. Among those who responded, 74 percent indicated EA outcomes in the first year were mostly (28 percent) or very much (46 percent) aligned with their particular goals.
Specifically, 57 percent of responding EA schools stated the number of enrolled EA students was at or very close to target number. However, 14 percent of schools fell short of their EA enrollment target. The most significant barrier reported by schools was a lack of awareness of the equitable access preference, followed by language barriers, which may have prevented non-English speaking parents from learning more about the EA opportunities.
Many respondents highlighted the need to enhance communication about the EA preference to ensure parents and other stakeholders understand its nature and eligibility criteria. The most common proposed solution to address these barriers was increased distribution of citywide information (86 percent of respondents). The second most common suggested solution was a citywide information fair (36 percent of respondents).
The most common recruitment strategy mentioned was the use of social media. 71 percent of schools reported relying heavily on social media as their primary means of recruiting students to achieve their target enrollment goals. Following closely, 64 percent used canvassing. Schools also used flyers and hosted (or co-hosted) local events to recruit families and students.
Schools mentioned many factors that led to enrollment outcomes for their EA seats, but school culture and staff emerged as the most common theme; 50 percent of respondents indicated their staff and community (family support, staff/leadership support) led to meeting their target for EA enrollment. In addition, three schools emphasized the need for the EA option to hold higher priority for the city. They stressed the importance of increasing awareness among families regarding eligibility and suggested schools need additional materials to effectively promote the EA preference within their communities. My School DC has created additional flyers on EA to support outreach.
Among the respondents, 56 percent indicated the majority of students who enrolled through the EA option remained enrolled through the school year. Most of these schools prepared for the influx of at-risk students by providing additional supports and resources to teachers.
Every school that responded to the D.C. Policy Center survey confirmed their intention to continue with the EA option in school year 2024-25. Among them, 57 percent indicated their plans to increase their target EA enrollment number, even if their school didn’t meet their intended target in their first year. All DCPS schools offering EA seats stated they would increase their goals. Five out of 14 schools expressed that they did not plan to increase their EA enrollment target, and one school was unsure.
V. How did the applicant profile and application pattern change?
Profile of applicants
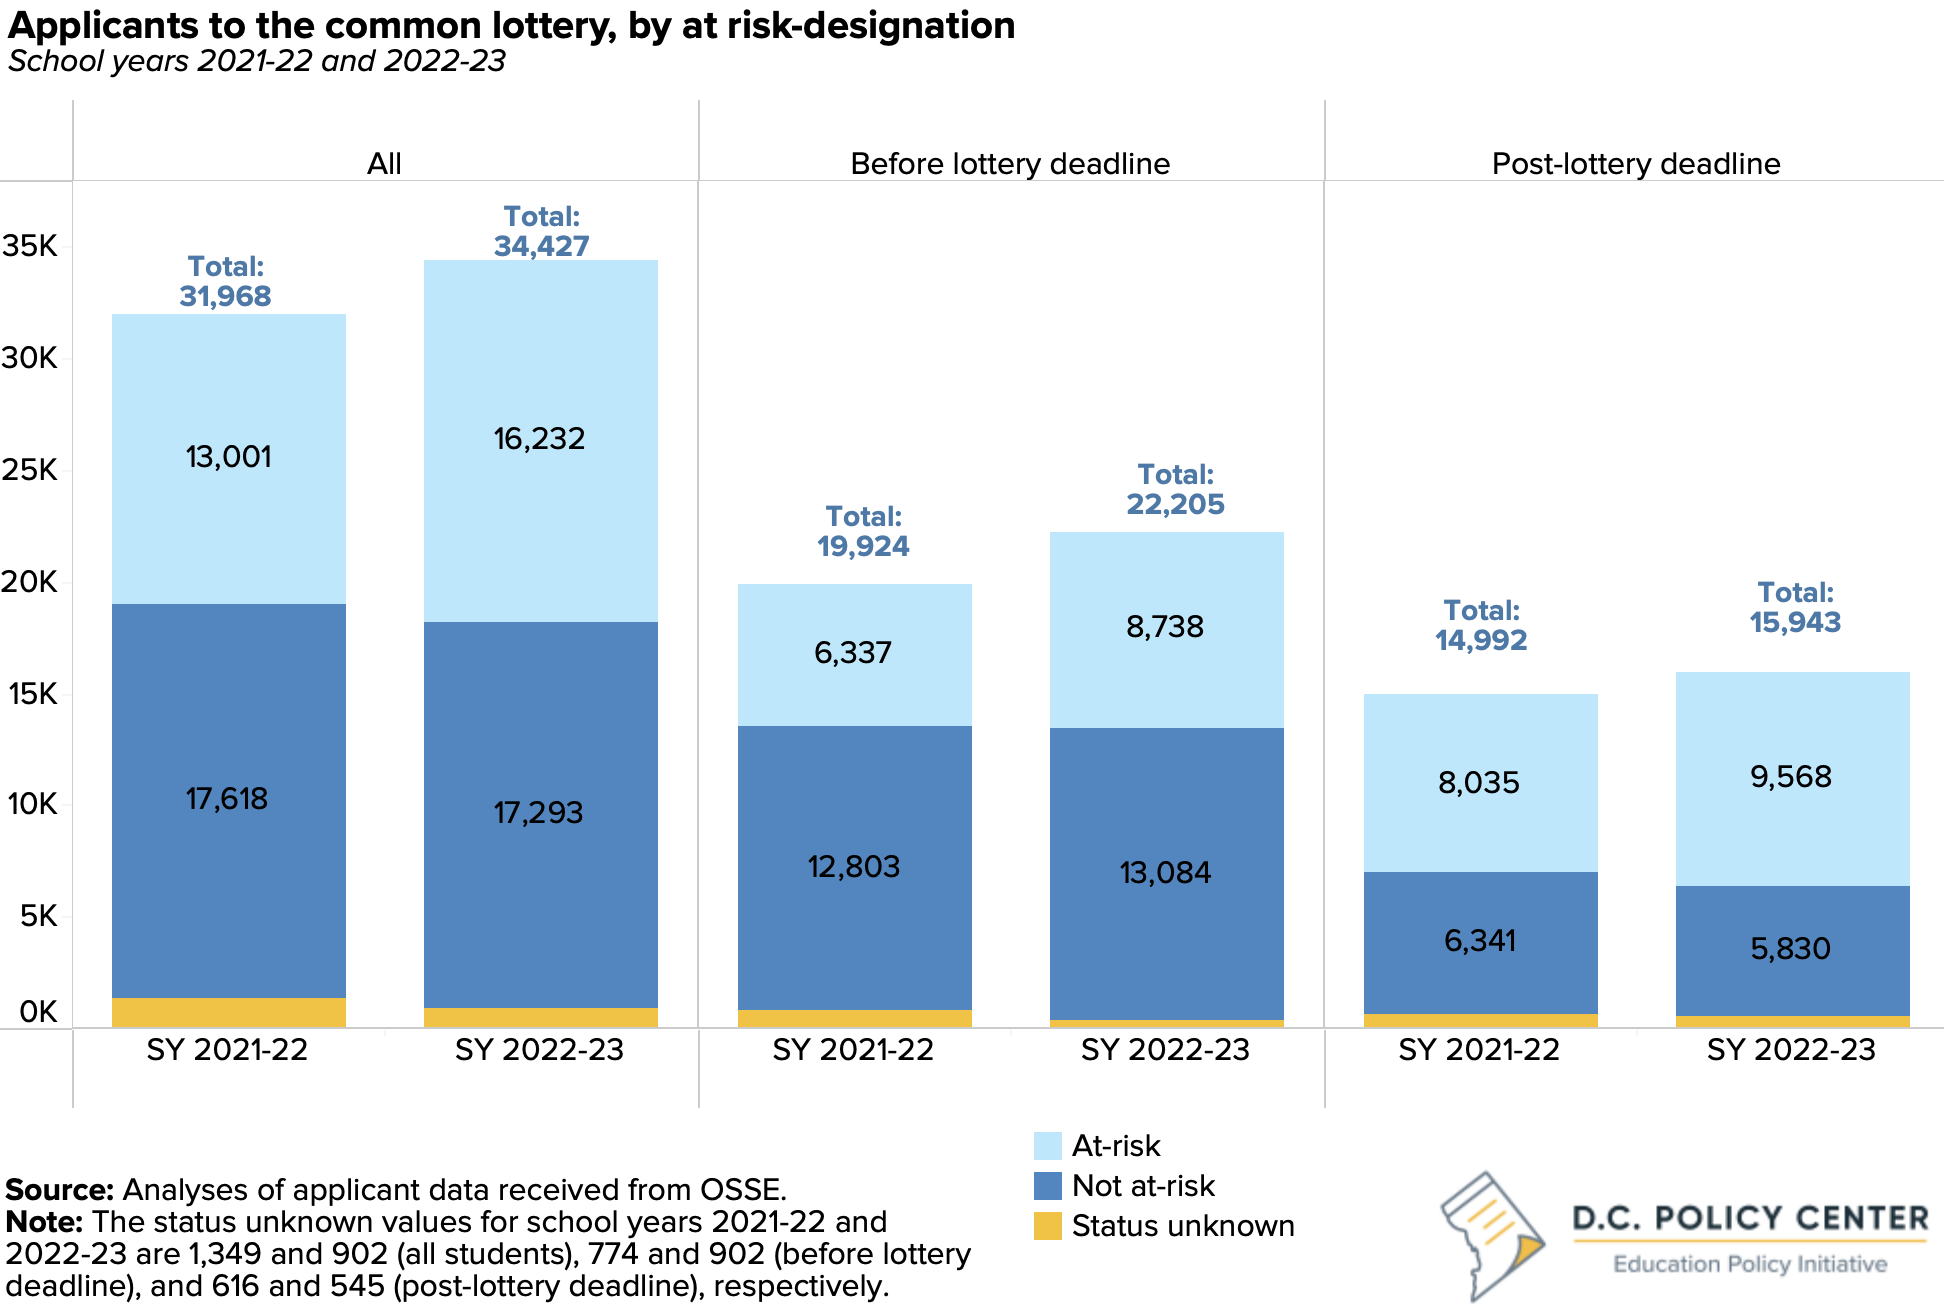
In the school year 2022-23 lottery, 33,525 applicants submitted a common application. Of those, 47 percent were at-risk and 50 percent were not at-risk (no determination could be made for 3 percent). At-risk applicants are more likely to submit an application after the deadline: For school year 2021-22, only 44 percent of at-risk applicants submitted their application before the deadline compared to 67 percent of not at-risk applicants who did so.
Data suggest the EA option could have incentivized more at-risk applicants to submit their applications and do so before the lottery deadline. For school year 2022-23—EA’s inaugural year—the number of applicants increased by 7 percent, but at-risk applicants increased by 25 percent. An additional 2,459 applicants participated in the common lottery; this growth was driven by applications from at-risk students.
The share of at-risk students applying from the lottery deadline grew even faster, increasing by 4 percentage points to 48 percent.
Change in at-risk application patterns
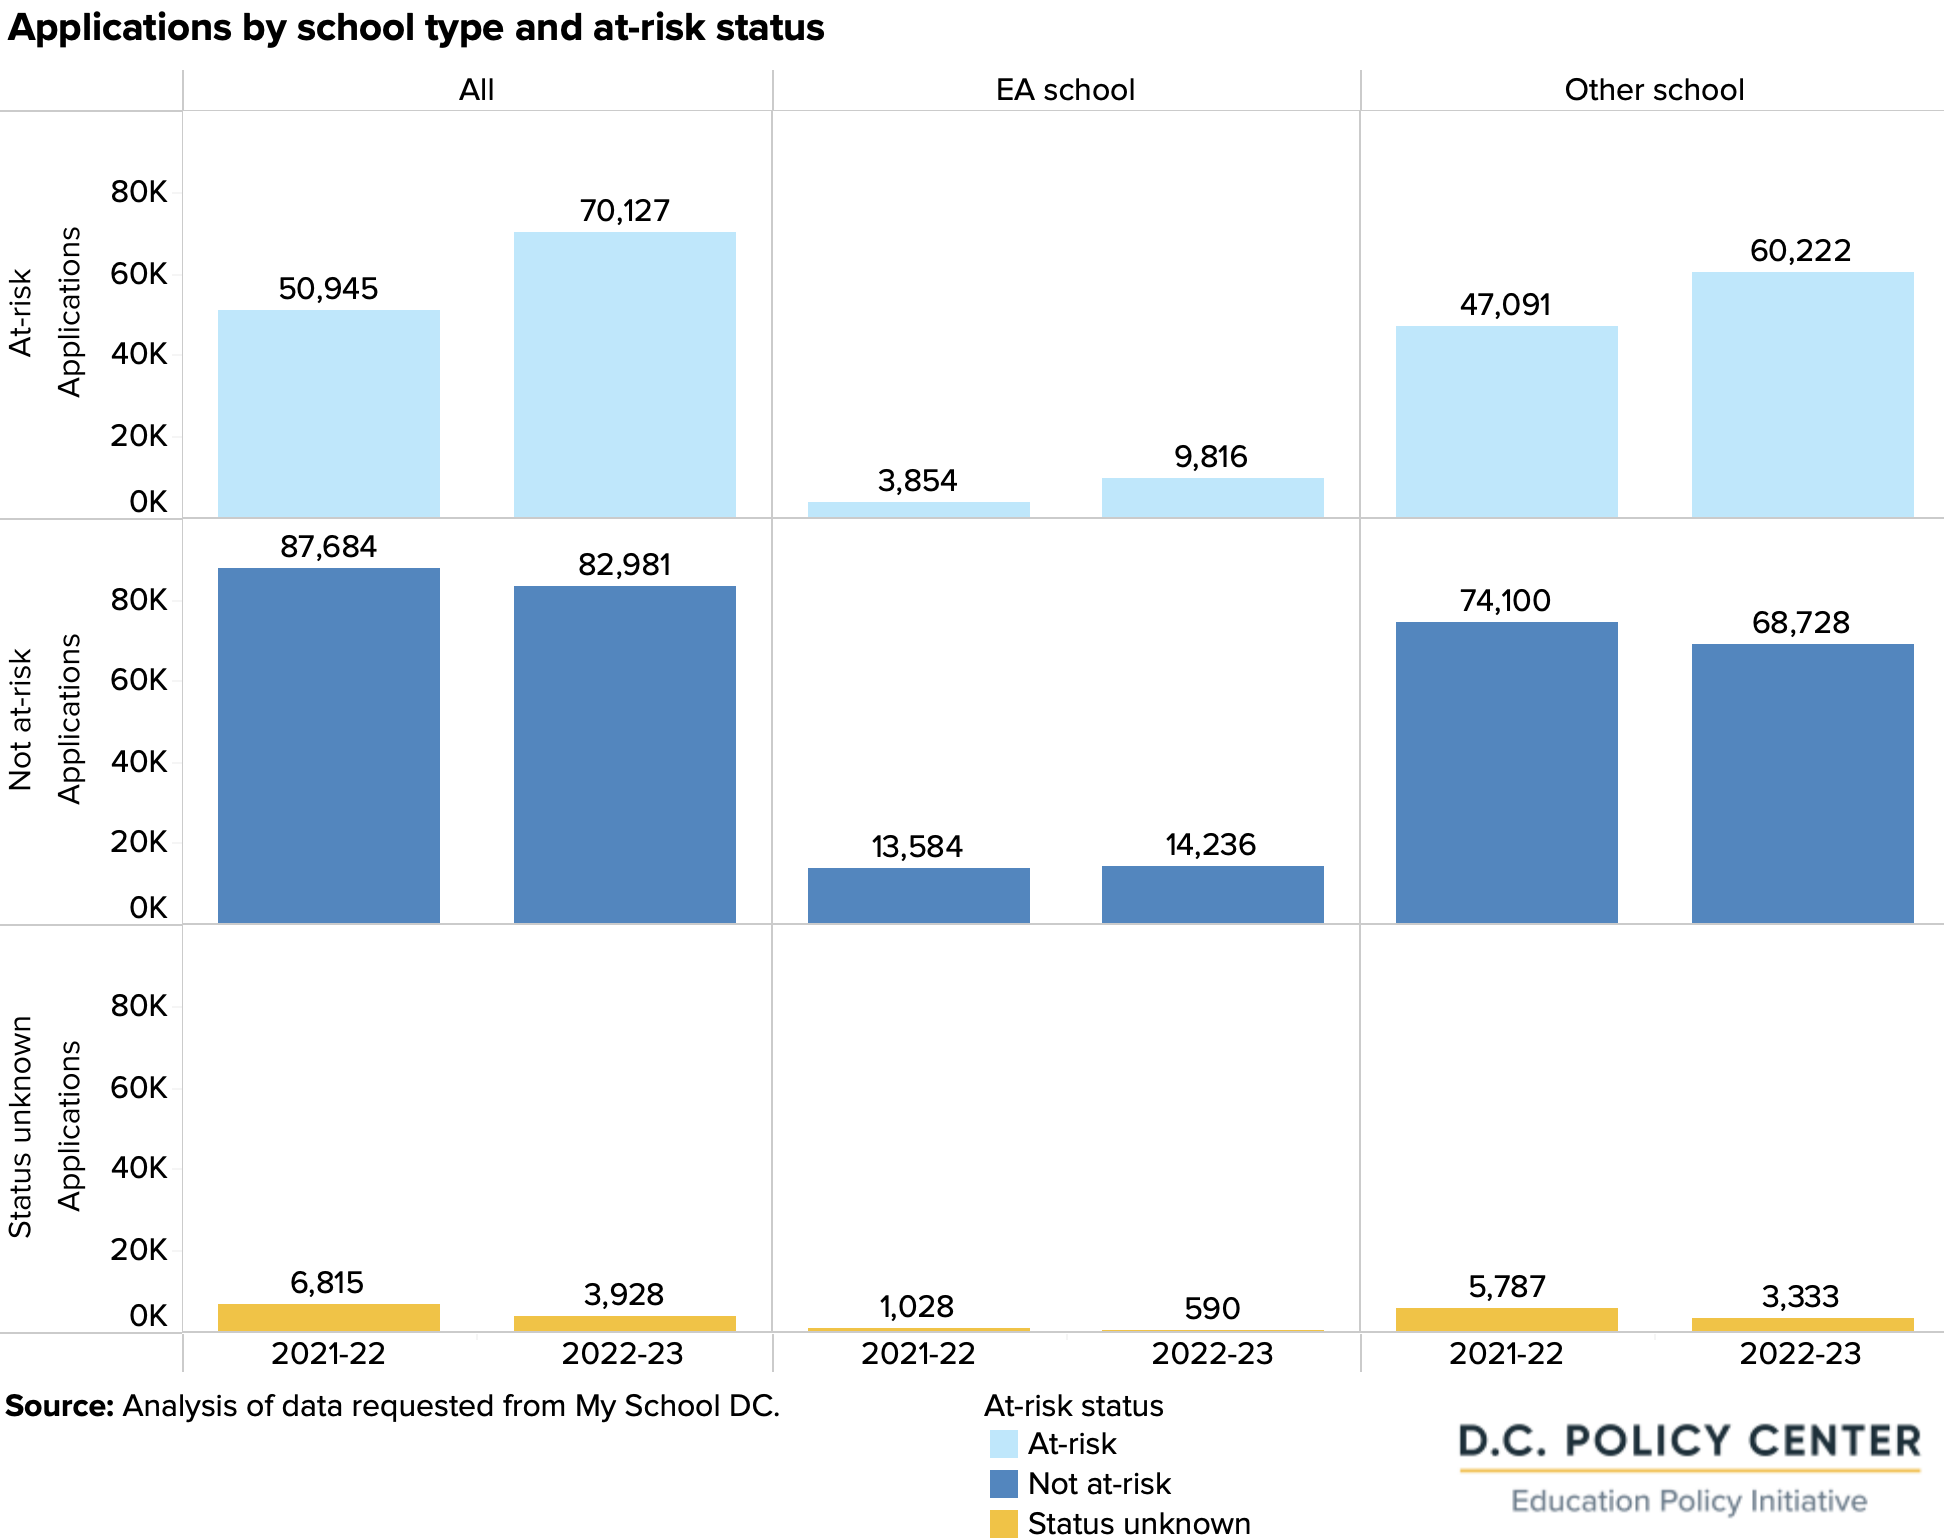
For school year 2022-23, the 34,427 unique applicants submitted a total of 157,036 applications to 234 schools through the common application. This number marks a 7 percent increase in the number of applicants but an 8 percent increase over the 145,444 school requests for the previous school year. Notably, 45 percent of applications were from at-risk applicants, a significant rise from the 35 percent recorded in school year 2021-22.
Specifically, there was a remarkable surge in the number of applications from at-risk applicants to EA schools in grades where they offered this option. Applications from at-risk applicants to these schools increased by two and a half times between the 2021-22 and 2022-23 school years, a substantially higher growth than the 8 percent increase in applications from at-risk applicants overall. This significant rise potentially indicates more demand for EA schools or a sense of increased student confidence in securing a seat due to EA. 40 percent of applications to EA schools were at-risk for school year 2022-23 compared to 21 percent of applications to the same set of schools in school year 2021-22.
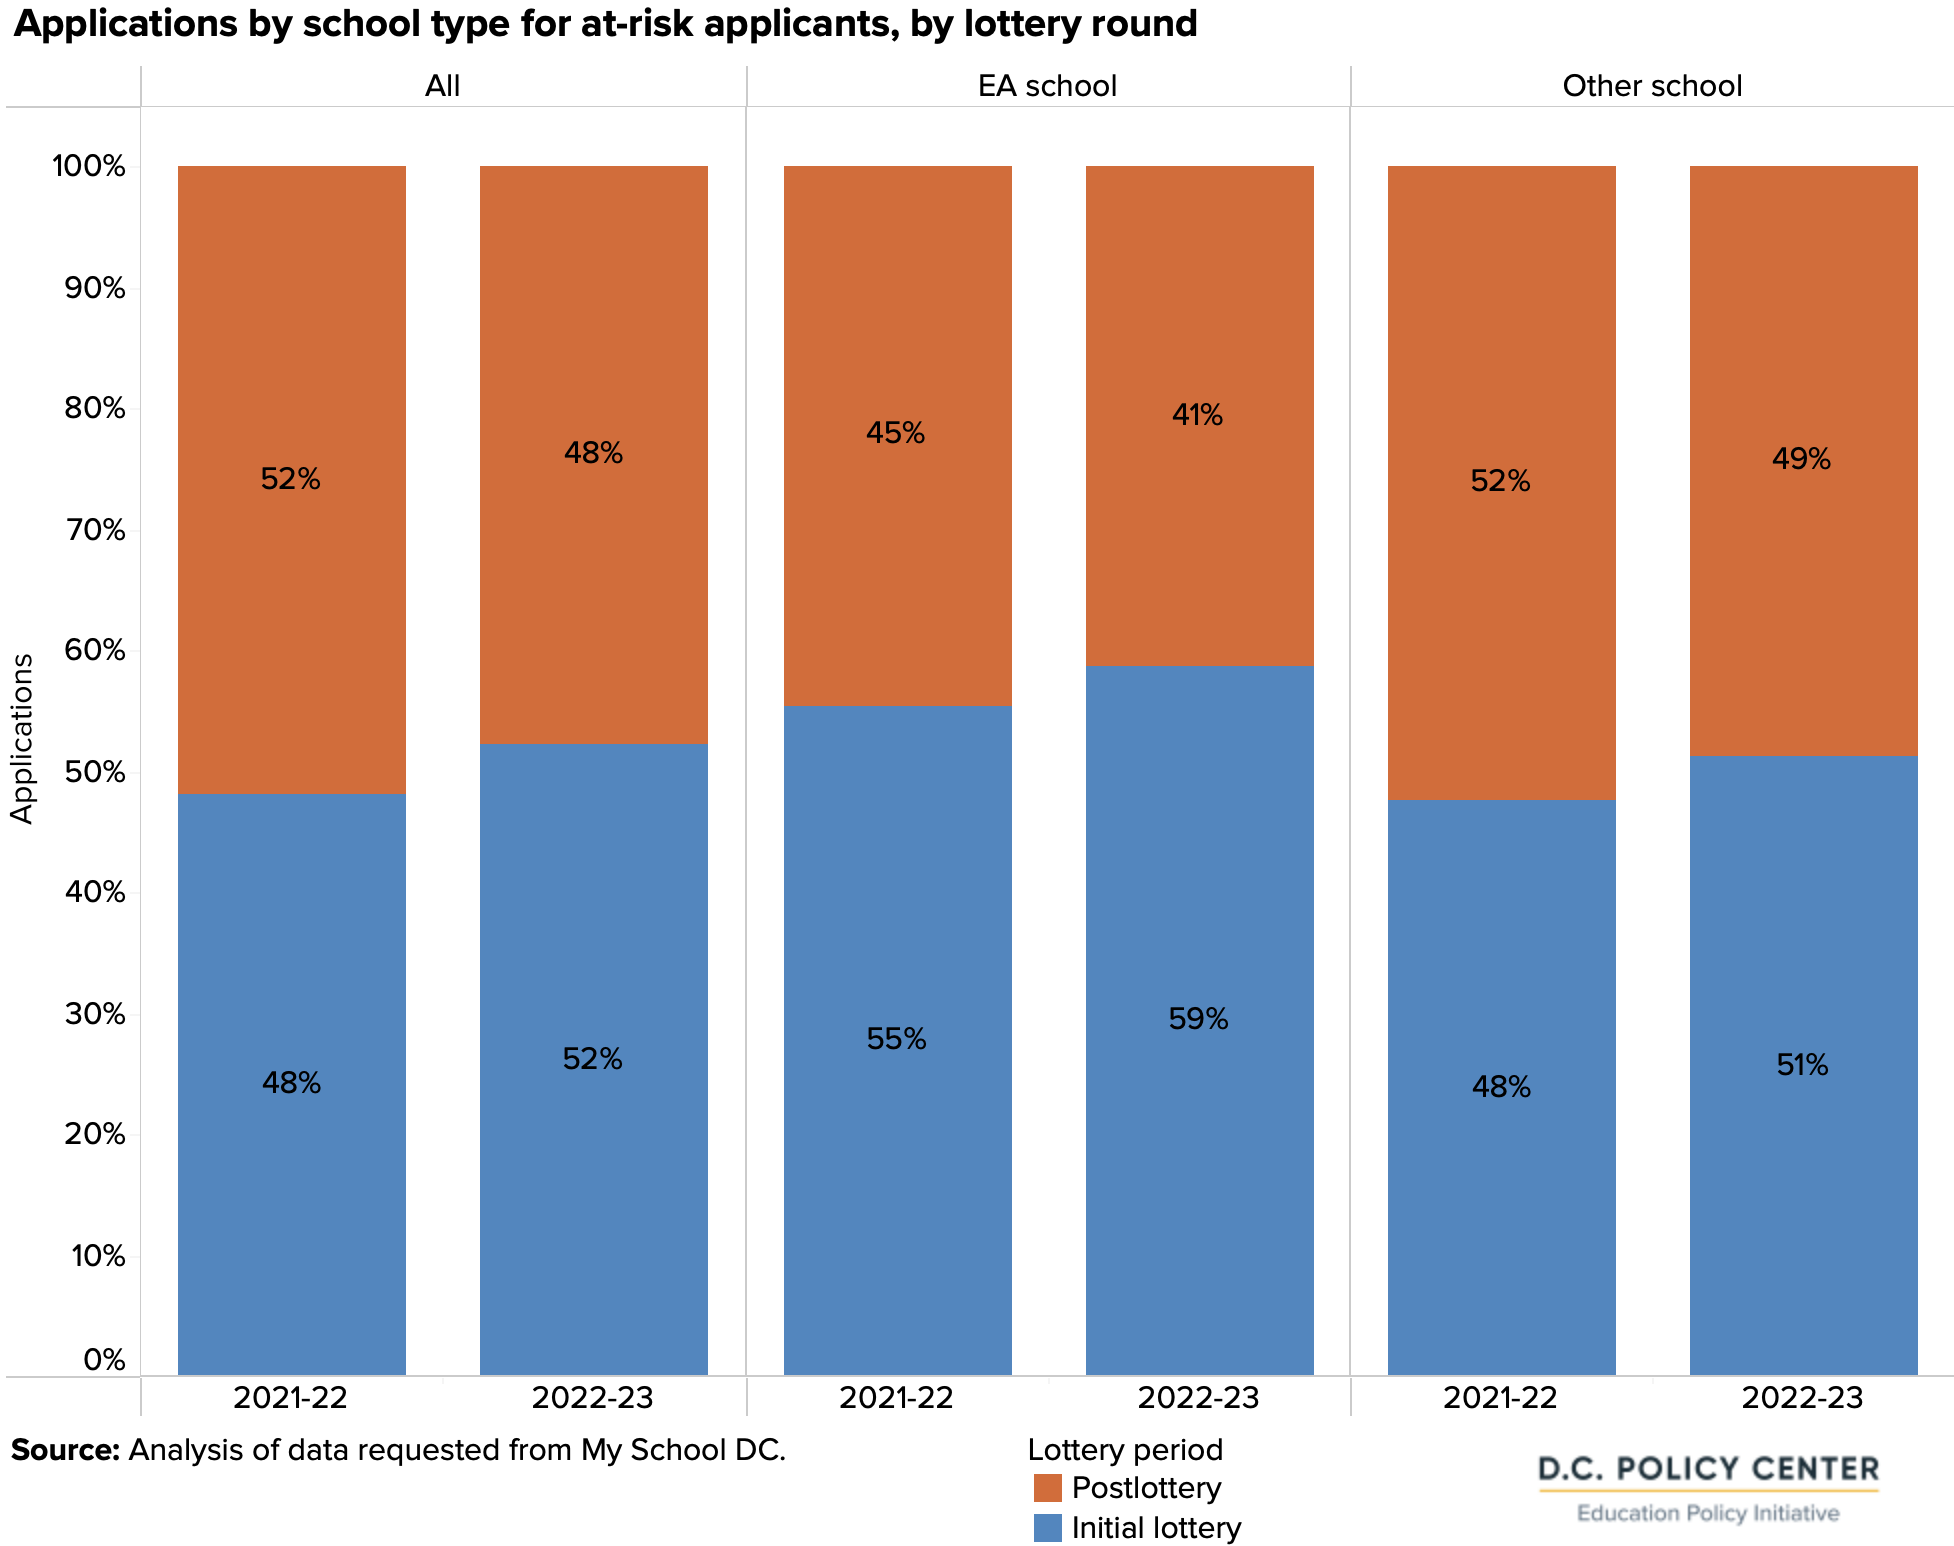
Applications from at-risk applicants were more likely to be submitted by the lottery deadline in school year 2022-23, especially at EA schools.
Applying before the lottery deadline significantly improves the likelihood of securing a seat at schools that are in higher demand. In school year 2022-23, 52 percent of applications from at-risk students were submitted before the deadline, up 4 percentage points from school year 2021-22. Among EA schools, the share was even higher: 59 percent of applications from at-risk applicants were submitted before the lottery deadline, marking a 4 percentage point increase from school year 2021-22.
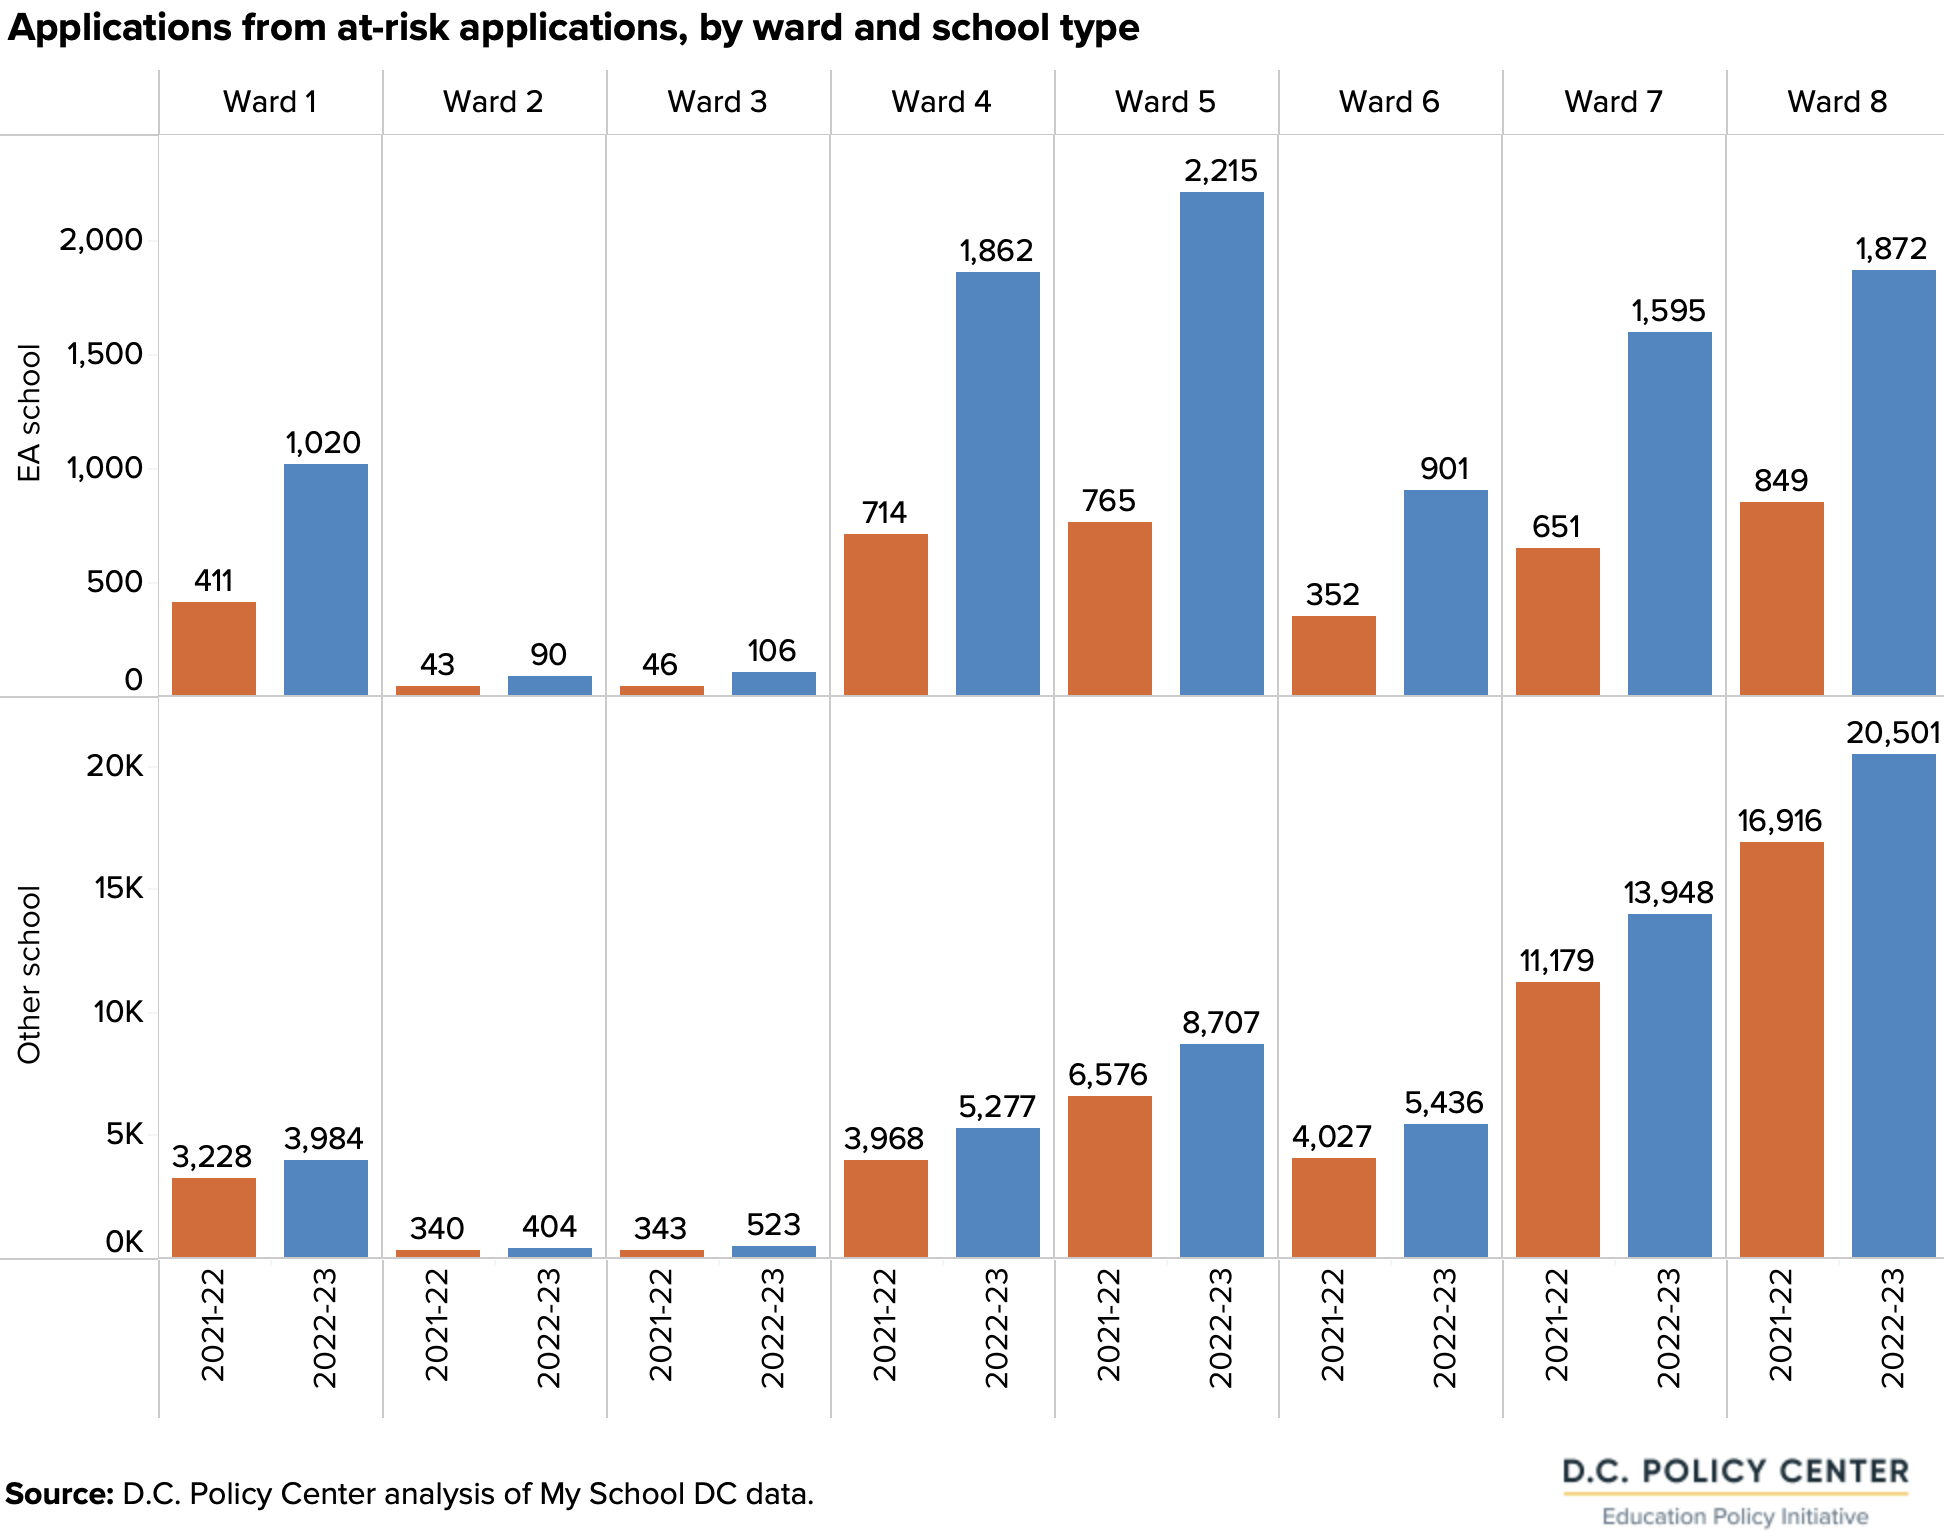
Applications from at-risk applicants to EA schools increased in school year 2022-23 by at least 6 times in Wards 1, 4, 5, and 6—with most EA schools in Wards 4 and 5.
In school year 2022-23, schools offering an EA option received 9,816 applications from at-risk applicants, or 5,962 more than the previous year, marking a 1.5 times growth. During that period, the number of at-risk applications grew, too, by 35 percent. Some of this is driven by an increase in the share of students designated as at-risk. Wards 1, 4, 5, and 6 experienced the largest percent increase over school year 2021-22, an average of 160 percent. Explaining part of this increase, the majority of EA schools are in Wards 4 and 5.
Matriculation
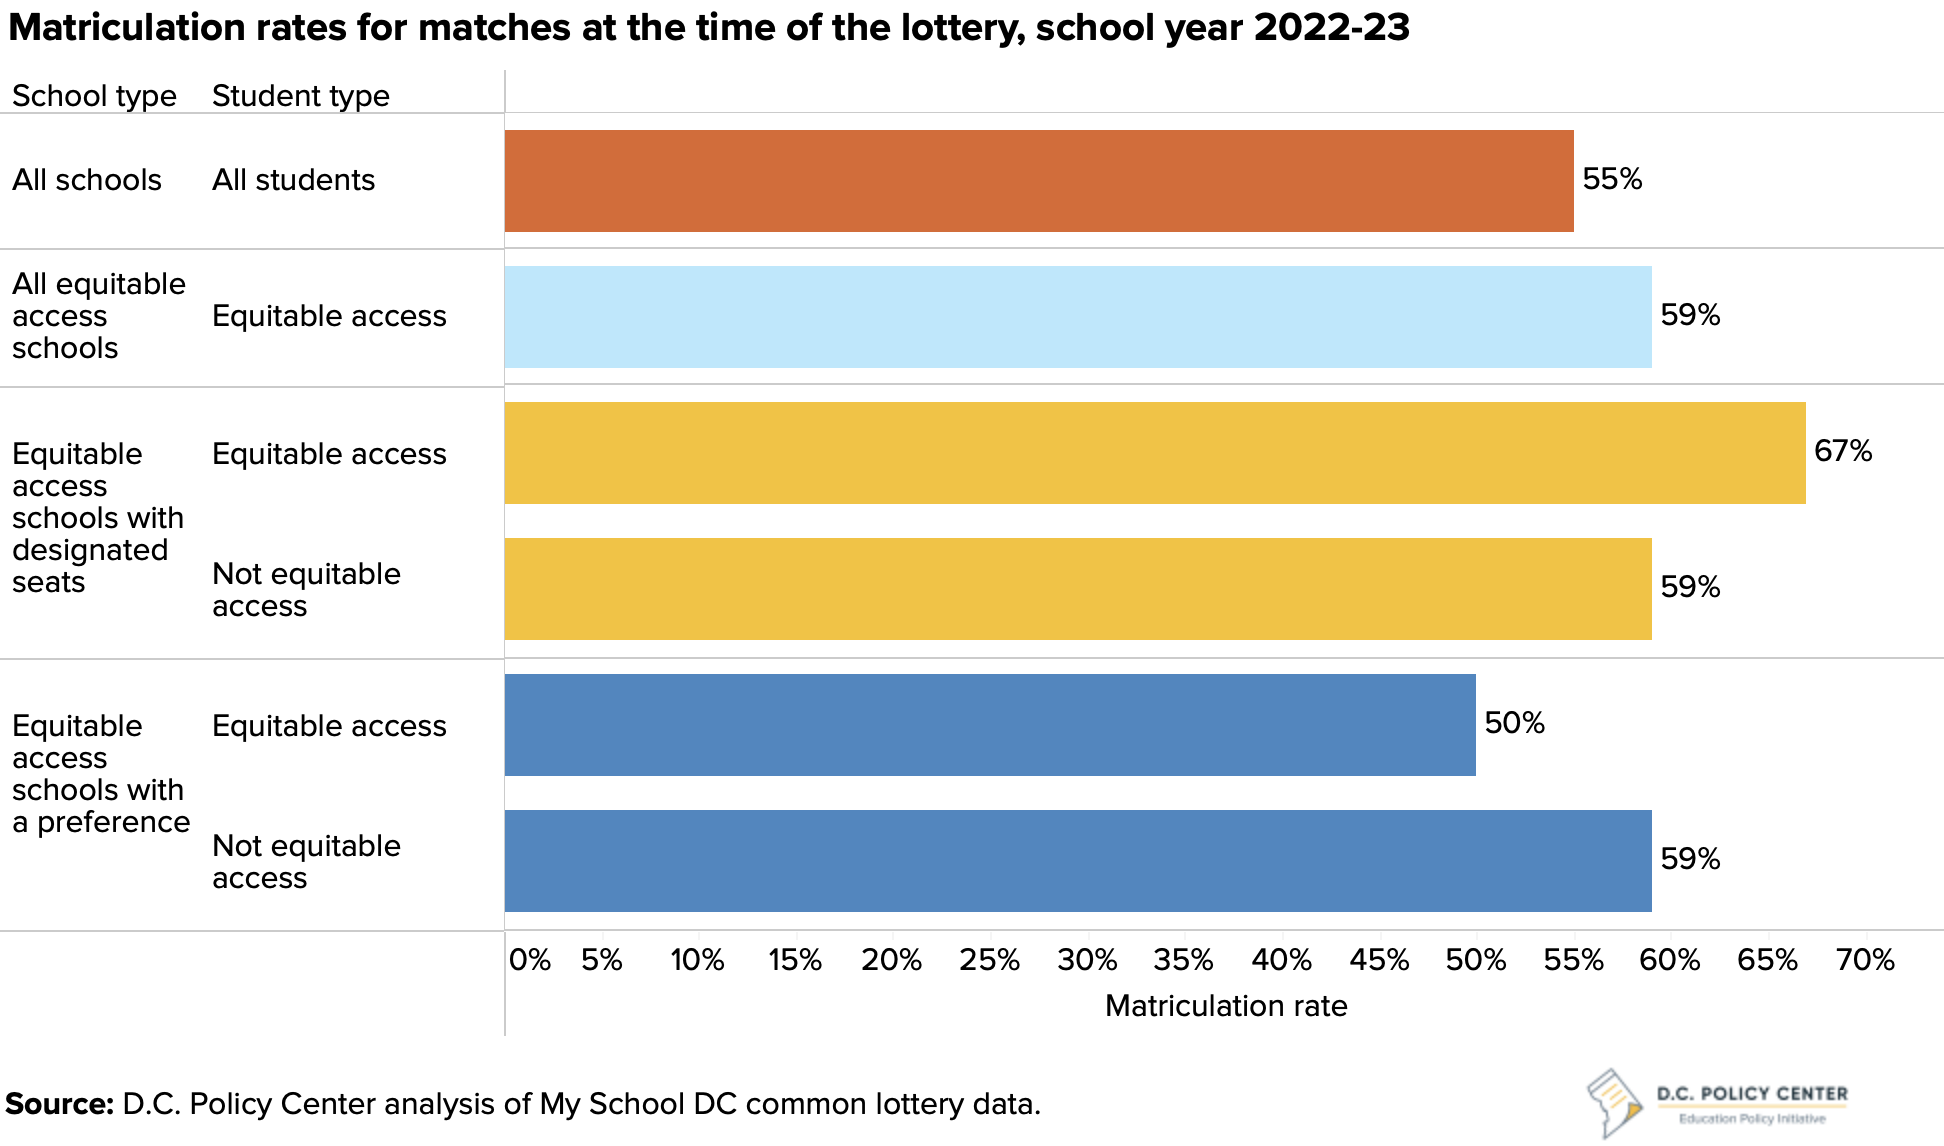
Among the applicants who matched through the EA option, 59 percent enrolled in the school they received a match with. This rate is higher than the overall matriculation rate of 55 percent across all applicants matched through the common lottery.
The matriculation rate was higher for designated seats. 67 percent of students matched through designated EA seats enrolled in their match school. Across these schools, the EA matriculation also outperformed non-EA matriculation, which was 59 percent.
The matriculation rate for EA seats were lower across schools that adopted a preference, at 50 percent. In these schools, non-EA matriculation was higher than EA-matriculation, at 59 percent.
Analysis: In grades that offered EA, how did the at-risk percentage change?
Among the 25 EA schools, 21 were open in both school years 2021-22 and 2022-23. In school year 2021-22, of these 21 schools, only seven had more than 10 at-risk students in OSSE-reported data on the number of at-risk students in their entry grade. The entry grade is important. It has the most potential to sway school demographics in the long run because entry-grade students will stay in the school for the longest time and could also amplify future at-risk numbers if they have siblings, who typically receive a preference. Among the seven schools with data on at-risk students in both years, the percentage of at-risk students in the entry grade increased by 4 percentage points to 47 percent. This is a slightly higher growth rate than the systemwide increase of 3 percentage points.
Among the 21 EA schools open in both years, 14 had fewer than 10 at-risk students in their entry grade in school year 2021-22 out of an average grade size of 45 students. For these schools we cannot calculate the share of at-risk students for school year 2021-22 because of OSSE’s data suppression policy, which, for example, suppresses at-risk student data with denominators under 10 and their corresponding percentages.16 Nonetheless, these are schools where the EA option could have a substantial impact. Out of these 14 schools, six—all of which offered designated seats—still had fewer than 10 at-risk students in school year 2022-23 and therefore we still cannot know the share of at-risk students. This does not mean that these schools did not add any at-risk students, but that this number is still too low to report. However, eight of the 14 had increased their at-risk students at the entry grade to over 10 and now, on average, 29 percent of their entry grade enrollment is comprised of at-risk students (16 students on average who are at-risk in the entry grade).
Conclusion
The implementation of the EA option in the District of Columbia’s public school system during the 2022-23 academic year marked a pivotal shift in prioritizing students designated as at-risk within the common lottery system. This initiative allowed schools to give preference to or reserve seats for at-risk students to increase their enrollment in schools, particularly those with limited representation of at-risk populations.
D.C. Policy Center studies conducted prior to the implementation revealed that while prioritizing at-risk students within the lottery could have modest effects across the entire public school system, it could significantly impact access to highly sought-after schools with low at-risk student representation. The EA option aimed to potentially enhance socioeconomic diversity in such schools, but its success hinged on how willingly and effectively school leaders implemented it.
EA schools
During the 2022-23 school year, 25 of 234 pre-kindergarten through 12th grade schools utilized the EA option. Six schools implemented it as a preference, while 19 designated specific seats for at-risk students. On average, EA preference matches at the time of the lottery and EA designated seats accounted for 18 percent of enrollment in seats with an EA option. EA-utilizing schools differed from typical D.C. schools in several aspects: a smaller percentage of at-risk students, a higher proportion of English learners, a larger share being public charter schools, a concentration in Wards 4 and 5, and longer waitlists in entry grades.
EA lottery results
At the time of the lottery, 400 students matched through the EA option, constituting 2 percent of all matches. Schools offering designated seats filled 72 percent of those seats at the time of the lottery, outperforming the citywide average of 59 percent.
The results from the school year 2022-23 indicate that the introduction of an at-risk preference accompanied both applicant profiles and applicant behavior. Analysis of the applicant pool indicated a significant increase in at-risk applicants, with a 25 percent rise in applications from at-risk students. Notably, EA schools experienced a surge in applications from at-risk students, indicating a heightened demand for these schools once the EA option became available. This growth was particularly strong for schools located in Wards 1, 4, 5 and 6.
While a larger share of applicants submitted their application prior to the lottery deadline, this growth was larger for at-risk students, compared to students who are not designated as at-risk.
Matriculation rates for EA seats varied: designated seats had a 67 percent matriculation rate, surpassing the overall matriculation rate of 55 percent. However, schools with EA preferences witnessed a lower matriculation rate of 50 percent.
EA moving forward
A survey of participating schools highlighted their intent to continue with the EA option in the upcoming academic year, with some planning to increase their target EA enrollment, aiming to bridge the gap between intended and actual enrollments.
The implementation of the EA option in D.C.’s public schools showed promising signs of increasing access for at-risk students. It revealed shifts in applicant behavior, an increased demand for schools offering the EA option, and a noteworthy impact on the demographic composition of schools, particularly in entry grades. However, ongoing efforts to raise awareness, improve communication, and refine recruitment strategies are crucial for the sustained success of this initiative in promoting equitable access for all students.
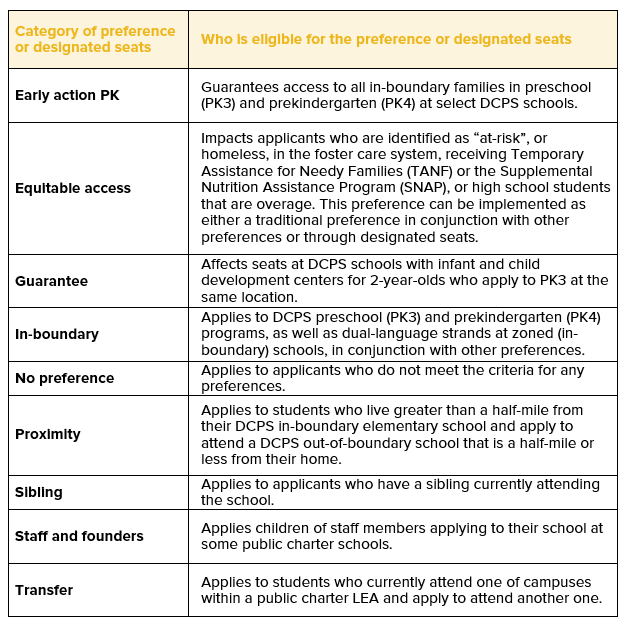
Appendix A: Glossary of preferences and designated seats
Appendix B: EA school list, school year 2023-24
Appendix C: EA designated seats made available by grade
Appendix D: Data and methodology
Data on common lottery applications were requested from My School DC and used for school years 2021-22 and 2022-23 due to completeness. Across these two years, 3 percent of applicants are missing data on at-risk status because applicants never enrolled in a public school in D.C. and therefore never had a student identification number. When at-risk status was missing for those who did enroll, potentially because their names or birth dates didn’t perfectly match with enrollment information, My School DC has reported these applicants as not at-risk because that is how they are treated in the common lottery system.
Appendix E: Estimated capacity for EA seats by school
Endnotes
- District of Columbia Public Schools (DCPS) had schools participating in Equitable Access for two years prior to school year 2022-23. In school year 2020-21, Thaddeus Stevens Early Learning Center opened as the first DCPS school to participate in Equitable Access. In school year 2021-22, Military Road Early Learning Center opened and offered Equitable Access.
- Eligible applicants are those who meet at least one of the following criteria: experiencing homelessness, in the District’s foster care system, receiving Temporary Assistance for Needy Families (TANF) or Supplemental Nutrition Assistance Program (SNAP), or in high school and at least one year older than the expected age for their grade.
- Coffin, Chelsea. 2020. At-risk priority in D.C.’s common lottery: Potential implications for access and diversity. D.C. Policy Center, Washington D.C. Available at https://www.dcpolicycenter.org/publications/at-risk-priority/
- Coffin, Chelsea. 2020. At-risk application patterns in D.C.’s common lottery. D.C. Policy Center, Washington D.C. Available at https://www.dcpolicycenter.org/publications/at-risk-applications/
- See Appendix D for more details.
- 50 percent of the applicants were not at risk, and no status determination could be made for 3 percent.
- Coffin, Chelsea. 2023. Charts of the week: Roughly one third of students who match in the common lottery do so through a preference. D.C. Policy Center, Washington D.C. Available at https://www.dcpolicycenter.org/publications/preferences-common-lottery/
- Office of the Deputy Mayor for Education (DME). 2023. “EdScape: Chapter 4 – Enrollment Patterns, Trends in Enrollment by Sector.” DME. Retrieved from https://edscape.dc.gov/page/trends-enrollment-sector
- Coffin, Chelsea. 2023. “Charts of the week: Roughly one-third of students who match in the common lottery do so through a preference.” D.C. Policy Center. Retrieved from https://www.dcpolicycenter.org/publications/preferences-common-lottery/
- The EA option in the common lottery is as one of several ways that schools in D.C. offer preferences and designated seats for different student groups, such as siblings or those living within a geographic boundary (for more information, see Appendix A: Glossary of preferences and designated seats).
- In school year 2020-21, Thaddeus Stevens Early Learning Center opened as the first DCPS school to participate in Equitable Access. In school year 2021-22, Military Road Early Learning Center opened and offered Equitable Access.
- Office of the Deputy Mayor for Education (DME). 2023. “EdScape: Chapter 1 – Population and students, Public School Students by Special Needs Categories.” DME. Retrieved from https://edscape.dc.gov/page/trends-enrollment-sector
- Coffin, C. 2023. “Charts of the week: Roughly one-third of students who match in the common lottery do so through a preference.” D.C. Policy Center. Retrieved from https://www.dcpolicycenter.org/publications/preferences-common-lottery/
- Coffin, C. and Sayin, Y. 2021. Exit & Voice: Perceptions of the District’s public schools among stayers and Leavers. D.C. Policy Center. Retrieved from https://www.dcpolicycenter.org/publications/school-leavers/
- For more information on designated seats by grade, see Appendix C.
- Office of the State Superintendent of Education (OSSE). 2022. District of Columbia Office of the State Superintendent of Education Student Privacy and Data Suppression Policy. OSSE. Retrieved from https://osse.dc.gov/sites/default/files/dc/sites/osse/publication/attachments/OSSE%20Student%20Privacy%20and%20Data%20Suppression%20Policy_FINAL_1.27.22.pdf