
While D.C. has been successful in keeping its COVID-19 viral reproductive number low, it has nonetheless consistently had 20-80 daily new cases since July. This low-level, ongoing crisis begs the question, what kinds of challenges does COVID-19 bring to bear on the District of Columbia? Is the District equipped with the physicians, nurses, respiratory therapists, and other providers needed to meet this public health crisis? Does D.C. have adequate health care workforce capacity to handle the health care need and demand of its residents during the pandemic? What supply gaps exist, and what impacts do those gaps have on residents?
Using data from the D.C. Department of Health (DOH) and other clinical boards in the Washington metropolitan area, the authors examine the overall condition of the District’s health workforce, as well as localized variation, to identify supply gaps, describe their potential impact, and assess their potential for exacerbating inequitable health outcomes from COVID.
This article is the first in a series on COVID-19 and the District of Columbia’s health care workforce, which discusses the ecosystem of health care clinicians, evaluates patients’ access to clinicians, and measures health care capacity.
Read the other articles in the series:
The nation’s capital has fared relatively well in controlling surges of COVID cases over the past several months. As of October, D.C. had 2,182 COVID cases per 100,000 people and 632 deaths.[1] The steady plateau of viral spread in D.C. is likely due to services available in the city, such as the rapid deployment of free testing centers and housing programs to quarantine and protect the homeless. A general culture where social distancing is the norm, bolstered by the District’s mask order, has also helped keep large-scale rapid spread at bay.
While D.C. has been successful in keeping its viral reproductive number (R0) low, it has nonetheless consistently had 20-80 daily new cases since July. This low-level, ongoing crisis begs the question, what kinds of challenges does COVID-19 bring to bear on the District of Columbia? Is the District equipped with the physicians, nurses, respiratory therapists, and other providers needed to meet this public health crisis? We wondered if D.C. has adequate health care workforce capacity to handle the health care need and demand of its residents during the pandemic, what supply gaps exist, and what impact those gaps have on residents.
Using data from the D.C. Department of Health (DOH) and other clinical boards in the Washington metropolitan area, we examine the overall condition of the District’s health workforce, as well as localized variation, to identify supply gaps, describe their potential impact, and assess their potential for exacerbating inequitable health outcomes from COVID. Ultimately, we build on the analysis conducted in 2018 by the DOH Primary Care Needs Assessment (PCNA) to create context around D.C.’s health care workforce capacity during this unprecedented health crisis.
Who makes up D.C.’s health care workforce?
A wide spectrum of health care clinicians (HCCs), non-health care professionals, and even family members provide care for people with COVID. Most COVID patients do not experience critical or even severe illness — these milder cases are more likely to receive care from HCCs other than physicians.[2]
Health care clinician (HCC) is a term covering a number of clinical occupations. Each HCC occupation provides a different dimension of care, dependent on state-determined supervision requirements and scope of practice.[3],[4] In D.C., both nurse practitioners and physician assistants (PAs) are enabled with the upper bounds of prescriptive authority. Thanks in part to this prescriptive authority, in the context of COVID, they can provide a wide range of crucial services.
Because of the significant roles that a broad swath of the health care workforce plays in caring for COVID patients we define the relevant health care workforce to include the professions below:
- Physicians (MDs and DOs)
- Nurse Practitioners (NPs)
- Physician Assistants (PAs)
- Registered Nurses (RNs)
- Home Health Aides
- Medical Assistants
- Nursing Assistants
- Respiratory Therapists (or Respiratory Care Practitioners)[5].
The health care workforce pipeline has implications for health equity. Addressing gaps will require a long-term approach.
Joining the health workforce pipeline, especially at the upper levels of clinical training, is demanding of both time and money, and often requires networks and social capital to connect to schools or certain hospitals. Despite initiatives to increase diversity in the health workforce, nationally, only 11% of physicians are Black or Hispanic,[6] only 19% of RNs are non-white,[7] and just 17% of Physician Assistant (PA) matriculants are non-white[8] (the allied health professional workforce is generally more diverse[9]).
There is a direct connection between racial/ethnic diversity and health outcomes. Racial disparities in health care treatment are well documented—access to health care professionals of the same race as a patient can improve health outcomes. For instance, a recent study suggests that matching Black male patients to Black doctors could reduce the Black-white male gap in cardiovascular mortality by 19%.[10],[11] This is likely attributable to stronger doctor-patient relationships borne out of culturally competent interactions and a reduction in internalized bias and racism. Connection across language, culture, and race/ethnicity can also improve patient experience and medication adherence.[12][13]
At the organizational level, racial and ethnic diversity in the health care workforce is a form of cultural competency. Integrating feedback mechanisms from people of different races as well as having a diverse leadership team can help an organizations provide better care for non-white populations.[14] Because the time- and resource-intensive nature of clinical training privileges those who have financial and social resources at their disposal, it will take a long-term approach – looking 10 or 15 years down the road – to appropriately address racial and socio-economic gaps in the District’s health care workforce. As Washington, D.C. has a relatively low uninsurance rate (3.2%-3.5%) and does not suffer from the lack of coverage that many jurisdictions face, the issues of cultural competency and diversifying the workforce should be a focal point for the District to improve access to quality of care.[15]
Available data on the District’s health care workforce
To examine gaps in the health care workforce, data is necessary. While there are workforce estimates both from the American Community Survey (ACS) and the Bureau of Labor Statistics (BLS), descriptions of the local workforce from these two sources are incongruous and are therefore inadequate in answering our main questions: Does HCC supply meet demand? And does supply and demand correlate across geography?
For example, the two data sources vary to such a great extent on how many registered nurses (RNs) are in the workforce, that one ranks D.C. as first in per-capita count of RNs, while the other ranks it last. And while the BLS data (where the District averages seventh out of 51 states in health care clinicians per capita) paints a much rosier picture than that of the ACS (which places D.C. at an average rank of 33 out of 51), the wide range between the two estimates demonstrates that a more accurate count is needed.
For a more reliable, consistent set of data, we will compare three distinct sources of health workforce estimates: the American Community Survey (ACS)[16], the Bureau of Labor Statistics (BLS)[17], and our own original tabulation of data from the D.C. Department of Health.[18]
| Count of HCCs by occupation/license type and data source in Washington, D.C. per 100k population, 2015, 2018, and 2020 | ||||
| HCC Type | ACS Estimate (2018) | BLS Estimate (2018) | DC DOH Estimate (2020) | |
| Physician/Surgeon | 684 | 380 | 735 | |
| Nurse Practitioner / Nurse Midwife | 86 | 133 | 53 | |
| Physician Assistant (PA) | 56 | 86 | 60 | |
| Registered Nurse (RN) | 546 | 1,543 | 593 | |
| Respiratory Therapist / Respiratory Care Practitioner* | 8 | 45 | 41 | |
| Home Health Aide/Personal Care Aide | 215 | 1,610 | 574 | |
| Medical Assistant | 74 | 265 | Not available | |
| Nursing Assistant | 427 | 490 | Not available |
*This profession is licensed as Respiratory Care Practitioner (RCP) in Washington, D.C. and other jurisdictions, while ACS and BLS classify RCPs as respiratory therapists.
Note: Data reflect respondents who voluntarily provided a business address to the D.C. Department of Health.
Sources: 2018 American Community Survey (ACS) Public Use Microdata Sample (PUMS) 1-year Sample; Bureau of Labor Statistics (BLS) Occupational Employment Statistics (OES), 2018; Authors’ tabulation of D.C. Department of Health (DOH) active licensees, August 2020.
For every one of the above HCC types except Respiratory Therapist / Respiratory Care Practitioner, the actual counts of active licensees from DOH are closer to estimates based on ACS than they are to BLS data. Despite the self-reported nature of the ACS questionnaire, it appears that this data source does a better job of defining the possible HCC universe, so we will use ACS data set for comparing demographic descriptions.
Having three data sources (and three estimates) for each HCC occupation prevents us from relying on a single biased estimate. Such biases could be including physicians and other providers that spend <100% of their time on patient care (DC DOH data as well as other data sources), relying on necessarily limited samples that yield higher margins of error in smaller regions like the District of Columbia (ACS data), and omitting “the self-employed, owners and partners in unincorporated firms” in a way that excludes some physicians in private practice and likely other providers (BLS data). In addition, just like presidential approval and other large-scale polling, deriving an average across estimated sources is a straightforward and transparent way of minimizing the potential error or bias of any single source. Thus, because no single source of supply estimation is perfect, we instead present three options from reputable data sources to describe the universe of potential D.C. HCC supply counts; we will be forthright about what our data do and do not say throughout this series.
How much health care do District residents need, demand, and use? Where is the District falling short in meeting need and demand?
To determine if D.C. has a sufficient health care workforce, we will weigh supply against need, demand, and use. By supply, we mean the capacity of the health care workforce, as discussed above. The D.C. Primary Care Need Assessment (PCNA) was conducted in 2018 to assess the District’s primary care health care workforce capacity. Our study will use the same definitions of need and demand for health care as the 2018 PCNA:
Need: the number of annual primary care visits an individual would have based on their age, sex, and health status assuming there are no barriers.
Demand: the number of annual primary care visits an individual is expected to seek, accounting for barriers such as cost of care, uninsured status, or lack of culturally competent care.[19]
The PCNA, using data from 2015 with a District population of almost 650,000, found that D.C.’s primary care need was about 1.57 million primary care visits per year. Demand, in contrast, was 1.26 million primary care visits per year.[20]
Using a similar age-sex breakdown as the PCNA, we use more recent (2018) population data at the District and ward levels to generate updated estimates of health care need and demand as described in the table below. Our findings will be in the second article in this series.
The PCNA analysis found that, while D.C. has an adequate primary care workforce overall, it does not meet the need and demand of each part of the District equally. Comparing the estimated hours of population primary care need to the estimation of D.C. health care workforce full time equivalents (FTEs), the PCNA found that while several wards have many times the workforce they need and demand, three wards — Wards 4, 7, and 8 — have capacity that falls short of need. Wards 4 and 7, in fact, had less than half the provider capacity needed to serve their residents.
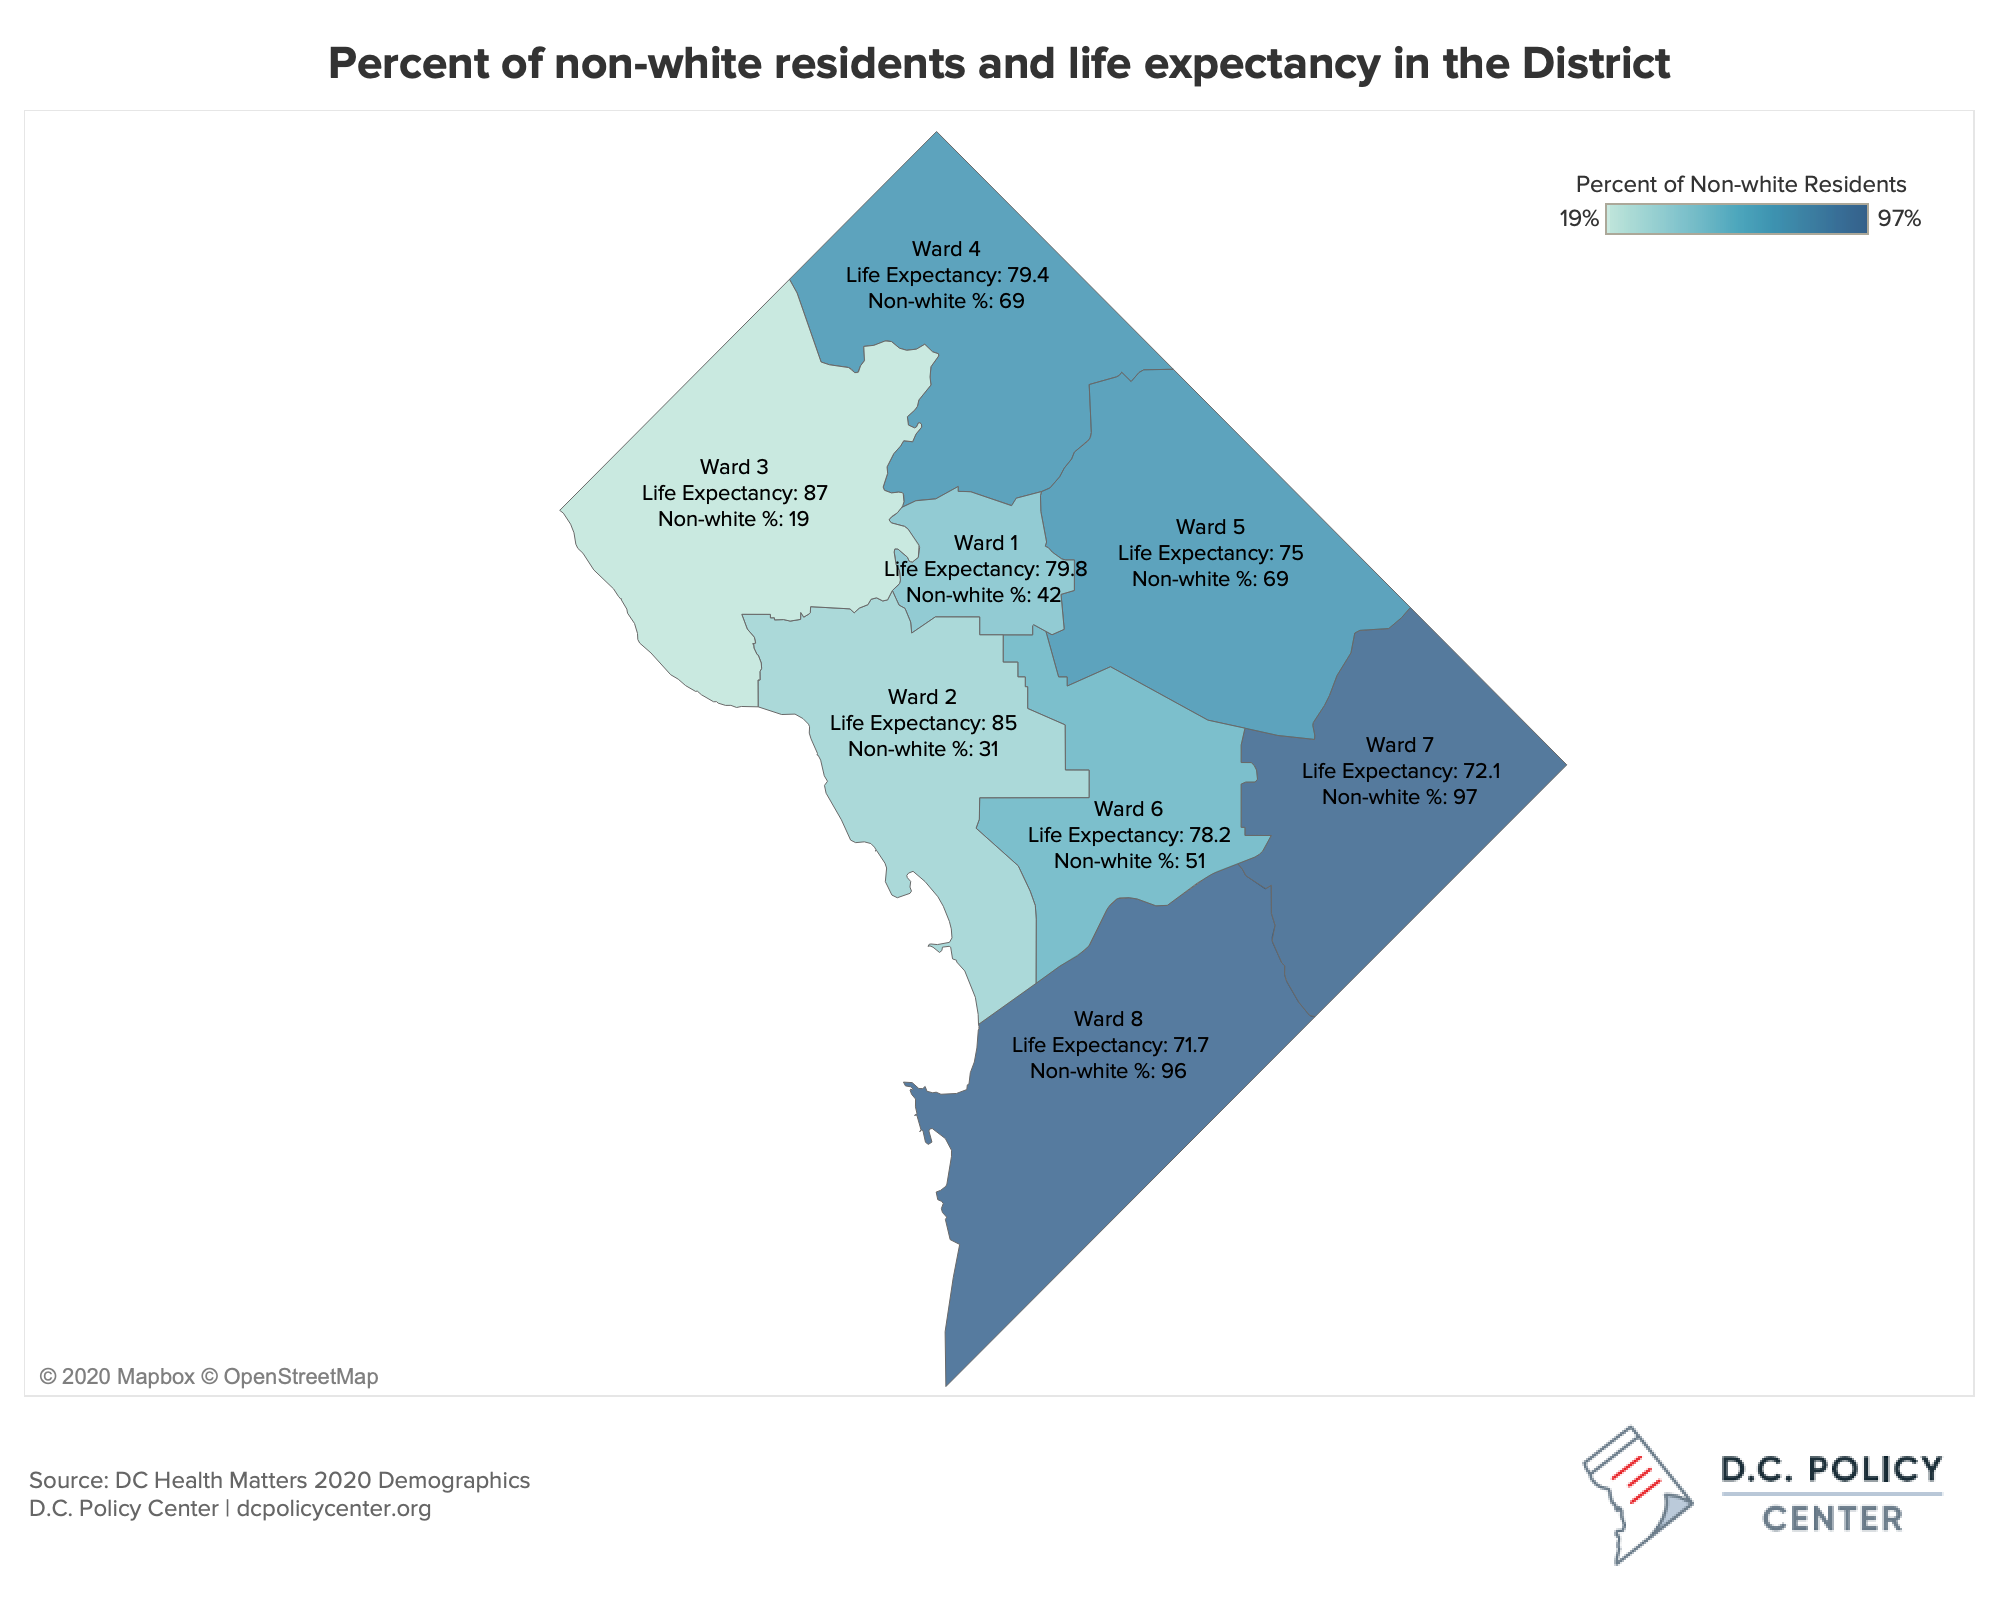
According to another study, the 2018 D.C. Health Equity Report (HER), Wards 4, 7, and 8 ranked respectively 4th, 7th, and 8th in terms of life expectancy across all eight wards.[21]
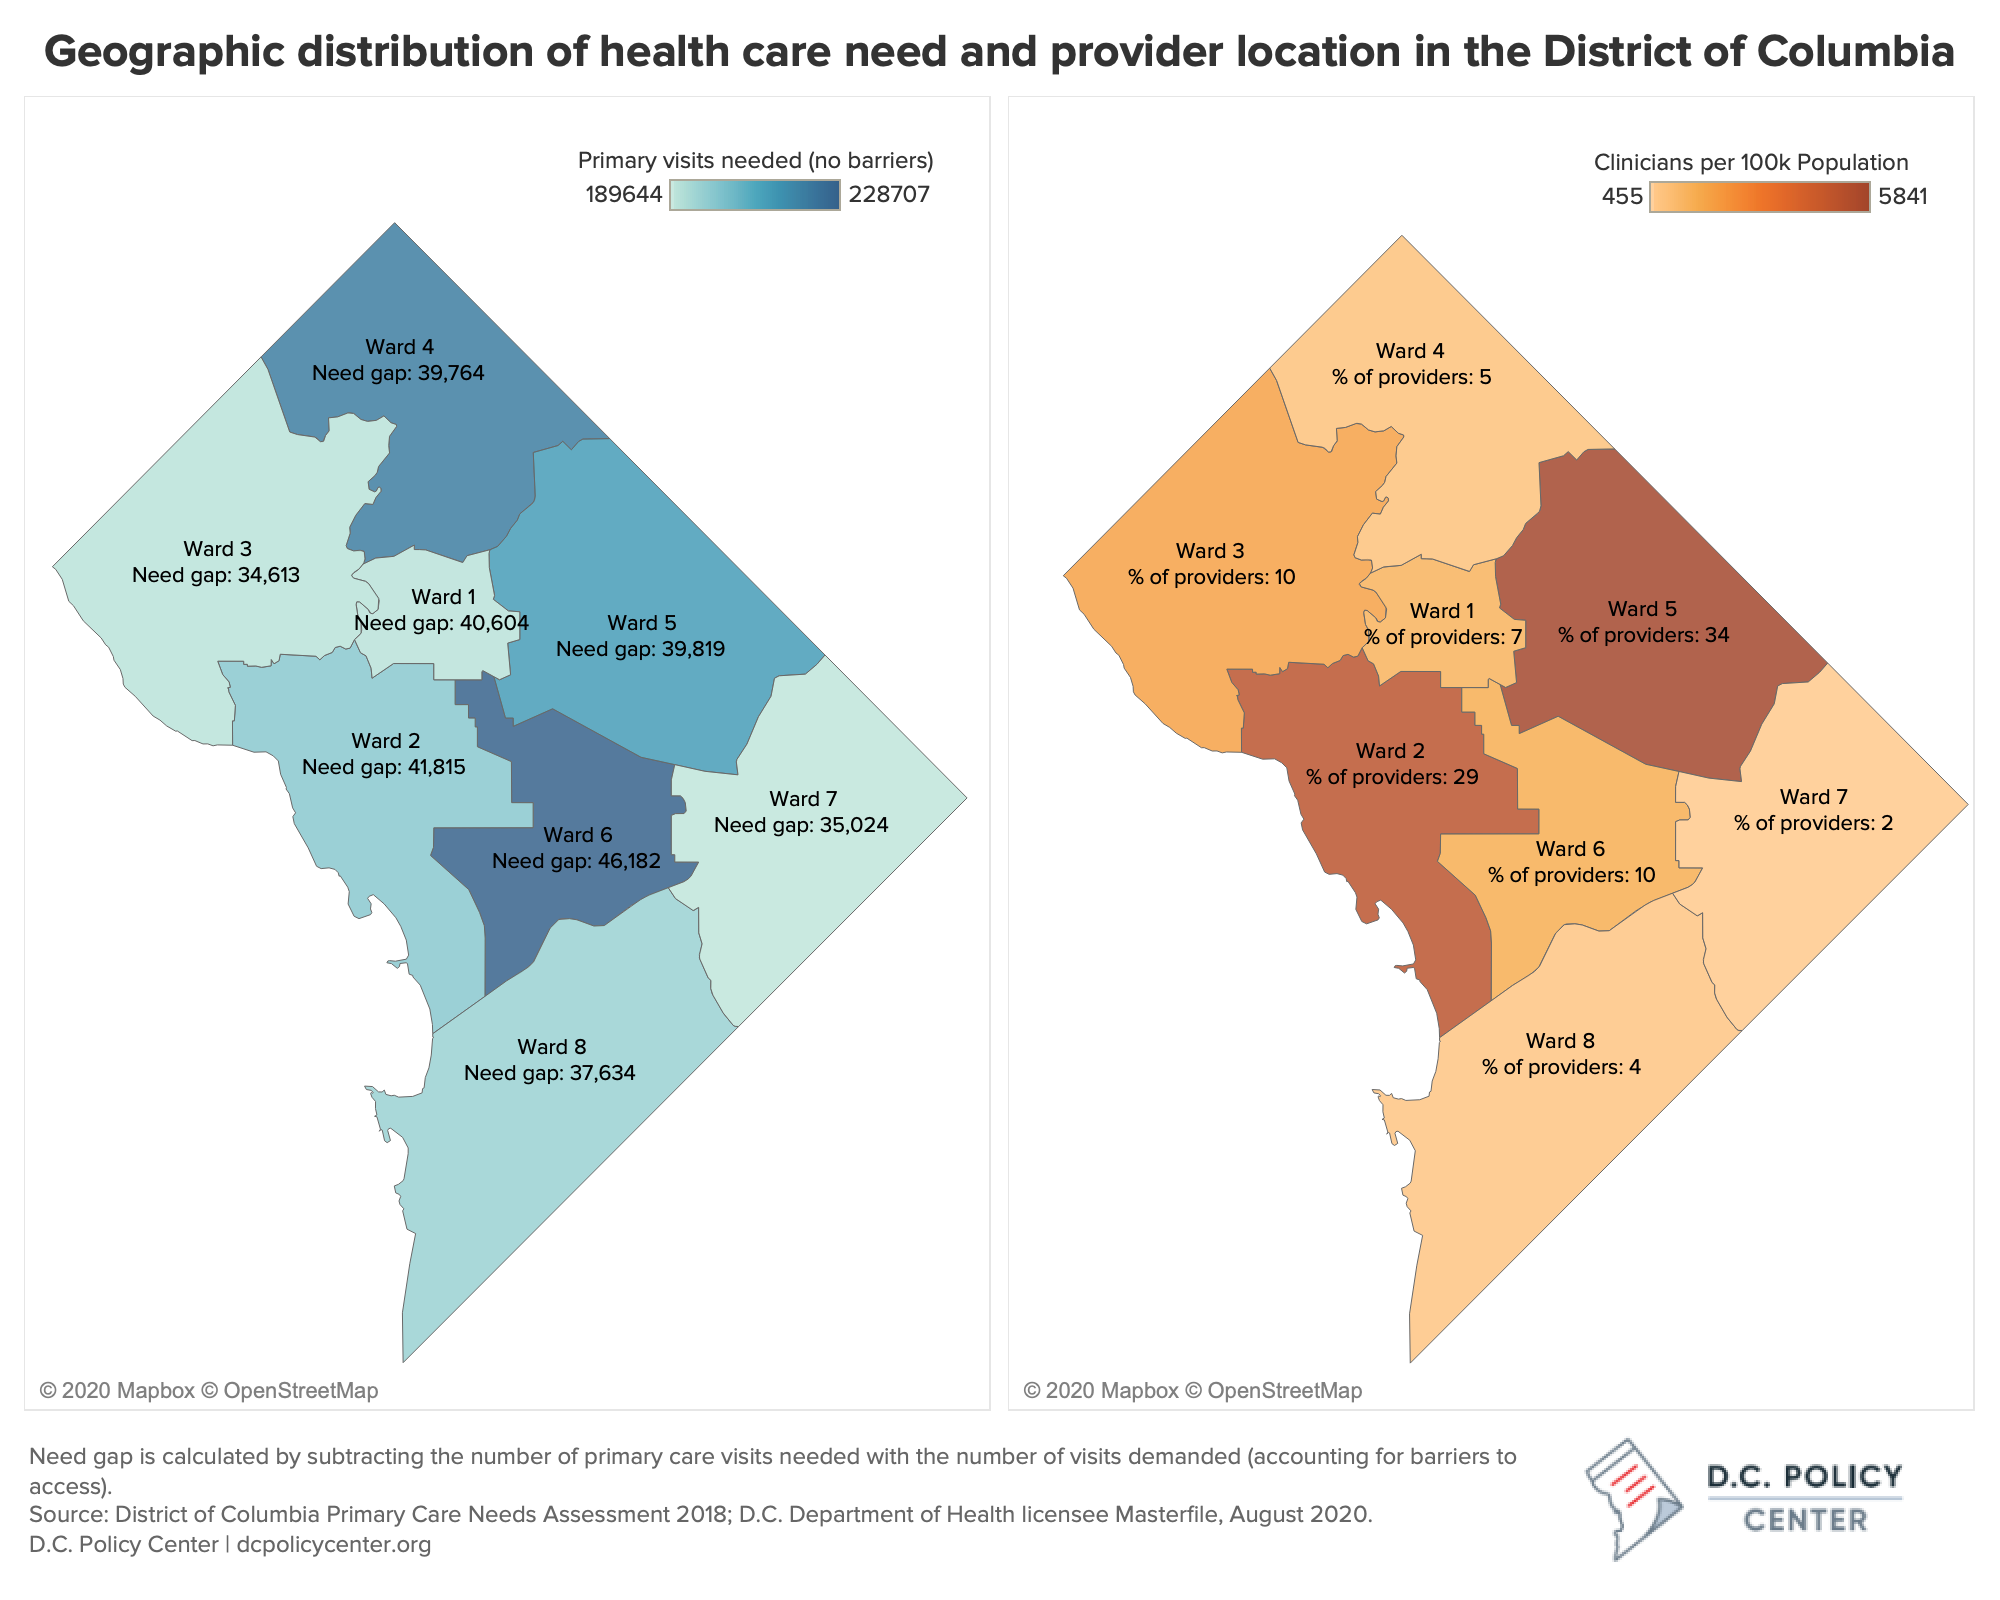
The wards with unmet health care need and demand are also the wards with the highest shares of residents that identify as people of color (POC). This relationship is especially pertinent given the degree of variation in race and ethnicity throughout the District: whereas the average share of non-white population in D.C.’s wards is 59% and the minimum share is 19% (that is in Ward 3, which contains the Georgetown, Glover Park, Palisades, and Chevy Chase neighborhoods among others), this share goes up as high as 97% in Wards 7 and 8.
We will assess the gap in supply and demand in the third article in this series, using adjusted numbers to reflect more recent demand and need, as well as an original dataset collected from the Department of Health and other health stakeholders.
COVID drives many factors that could impact or exacerbate the demand, need, and utilization of health care in the D.C. area:
- Fear: Unwillingness to risk exposure to obtain timely preventive or primary care
- Transportation: Unsafe or inconvenient public transportation options to get to a regular care center
- Insurance: Potential increased uninsurance or underinsurance with rising unemployment; potential confusion around obtaining insurance on ACA Marketplace or through Medicaid
- Health: COVID infection or changes in stress, nutrition, employment that affect mental and physical health
- Cost: Financial uncertainty, rising unemployment, and unforeseen circumstances creating economic challenges and inability to pay out of pocket health care expenses,
- Tele-medicine: Accessibility and willingness to use tele-medicine.
These factors are among many that may affect patient care-seeking behavior during this time. While we do not yet know how COVID impacts health care utilization, a Commonwealth Fund survey found patient visits decreased by 60 percent in April, then plateaued a third below pre-COVID level visits in May.[22] The Opportunity Insights Economic tracker, using aggregated data from credit card processors, payroll firms, and financial services firms, shows that in June through October 2020, American health care spending waxed and waned generally 12 – 25 percent below January 2020 spending levels with a slow upward trajectory.[23] While health care spending is slowly rising, the current decrease is likely attributable to patients delaying or not seeking preventive, primary, and non-emergency care.
In addition to barriers for patients, the health care workforce has adapted to the ‘new normal’ in ways that may affect health care supply:
- Reduced hours of non-emergency health care,
- reorganization of health center workforce to accommodate for COVID care when necessary,
- and financial hardship and potential business closure for small private practice care providers.[24]
What are the health care disparities in the District?
Even before the pandemic, accessing health care in the District was not always easy. Several barriers impede access to health care, including insurance status, geographic proximity to health care, high cost of care, and the cultural competency of practitioners.[25]
Easily accessible health care improves population health: a recent study found that 10 additional primary care physicians per 100,000 people in a county was associated with a 51.5-day increase in life expectancy.[26]
While the health care workforce is vital for disease treatment, its most important function may actually be in screening for disease, advising patients, and preventing disease. Chronic diseases such as hypertension, heart disease, and diabetes are caused by a combination of genetic, social, and behavioral risk factors. Primary care is vital to long term chronic disease outcomes as practitioners provide advice for how to lower risk factors, screen patients to discover disease early, and help patients manage chronic illnesses. The more trained and qualified people doing this work in D.C., the better.
Seeing a primary care physician (PCP) or other primary care provider as part of a regularly scheduled care plan plays a pivotal role in preventing the underlying factors that increase someone’s chances of getting severely ill or dying from COVID.[27] A recent study found that primary care investment was inversely associated with total hospitalizations, hospitalizations for ambulatory care sensitive conditions, and emergency department visits.[28] People who have access to and use primary care receive advice, baseline monitoring, and screening for disease. They also develop relationships with care providers, which improves patient adherence and the delivery of primary care services.[29]
Disparities in access to health care are often amplified by factors not immediately captured through stethoscopes and blood tests: education, food security, income, employment status, neighborhood safety, and others typically referred to as social determinants of health. These factors are the circumstances in which people are born, grow, work, and age, shaped by the distribution of money, power, and resources.[30]
The communities we live in often generate our social determinants of health, as community members often share similar socio-economic status, air quality, safety, school systems, and food security — it’s because of these dynamics that an individual’s ZIP code is a strong predictor of their long-term health outcomes.[31] High levels of segregation in D.C. also contribute to an imbalance of resource allocation that drives disparities in social determinants of health.
These same social determinants of health likewise amplify the impact that COVID-19 has had in some neighborhoods. Areas with lower incomes and less access to health care and grocery stores tend to have higher rates of hypertension, diabetes, and other diseases that increase risk of death or hospitalization from COVID. These same communities are also more likely to have essential workers, are less likely to have access to private transportation options, and are at greater risk for contracting the virus. Individuals with lower incomes are also more likely to lack access to paid sick leave at work and be uninsured. In D.C, many of the neighborhoods with highest rates of uninsurance, most essential workers, and lowest median incomes are in the same Wards (4, 7, and 8) that the PCNA found to have inadequate health care capacity.[32]
The lives lost in D.C. due to COVID flag health disparities and opportunities for public intervention. For example, Black D.C. residents make up 74% of COVID deaths, even though they make up less than half the population.[33],[34] And while racially-defined health disparities have been well documented for years, the glaring inequality happening in the nation’s capital should be a call for investigation and action. We hope that our data-based analysis will aid these efforts.
The District’s health care workforce is the backbone of its residents’ health care system. This article is the first in a series on COVID and the District’s health care workforce, which will discuss the ecosystem of care providers relevant to COVID and primary care outcomes, evaluate patient’s access to clinicians, and measure health care capacity. Additionally, we will assess the factors common to areas with a high burden of COVID and describe their social determinants of health to understand the disparities that influence COVID outcomes, and explore the following questions:
- What is the current need and demand for health care in D.C.? How might COVID impact existing levels of demand and need?
- Is the D.C. health workforce capacity adequate to handle the health care need and demand?
- Who makes up D.C.’s workforce and what are the identifiable trends in the District’s health workforce?
- How does D.C.’s workforce capacity compare to the capacities of states and to similar metropolitan areas?
- Which communities or groups of people have been most greatly affected by COVID-19 and what characteristics do these communities/groups have in common?
- Which areas of D.C. have been most affected by the pandemic overall, in terms of the impact both on health and factors outside of health?
- Which D.C. policies have been helpful in stopping viral spread and building a robust health care workforce, and what other policies should be considered?
Appendix
| Table A-1: Estimates of Health care Need and Demand in Washington, D.C. by Gender and Age, 2018 | |||||||||
| Demand | |||||||||
| Total | 0 TO <5 YRS | 5 TO <15 YRS | 15 TO <30 YRS | 30 TO <40 YRS | 40 TO <50 YRS | 50 TO <65 YRS | 65 TO 75 YRS | 75+ YRS | |
| Male | 489,646 | 64,626 | 40,340 | 73,010 | 65,410 | 45,518 | 97,760 | 59,556 | 43,426 |
| Female | 850,604 | 57,505 | 41,504 | 178,351 | 179,281 | 79,727 | 144,020 | 89,594 | 80,623 |
| Total | 1,340,250 | 122,131 | 81,844 | 251,361 | 244,691 | 125,245 | 241,780 | 149,150 | 124,048 |
| Need (Adjusted) | |||||||||
| Total | 0 TO <5 YRS | 5 TO <15 YRS | 15 TO <30 YRS | 30 TO <40 YRS | 40 TO <50 YRS | 50 TO <65 YRS | 65 TO 75 YRS | 75+ YRS | |
| Male | 598,109 | 83,418 | 45,883 | 79,429 | 104,267 | 63,151 | 107,640 | 66,515 | 47,807 |
| Female | 1,072,725 | 66,619 | 46,654 | 287,239 | 222,556 | 95,184 | 168,117 | 101,120 | 85,236 |
| Total | 1,670,834 | 150,037 | 92,537 | 366,668 | 326,822 | 1583,35 | 275,757 | 167,635 | 133,041 |
Sources: PCNA; 2018 American Community Survey (ACS) Public Use Microdata Sample (PUMS) 1-year Sample.
| Table A-2: Demand and Need of the District of Columbia Population vs. HCC Supply by Ward | |||||
| Demand and Need, 2018 | Supply, 2020 | ||||
| Ward | Demand | Need | HCCs (Count) | HCCs (% of DC Total) | HCCs per 100k Population* |
| 1 | 150,226 | 190,830 | 1,103 | 7% | 1,334.57 |
| 2 | 157,380 | 199,195 | 4,317 | 29% | 5,059.71 |
| 3 | 156,156 | 190,769 | 1,519 | 10% | 1,911.35 |
| 4 | 181,228 | 220,992 | 681 | 5% | 764.60 |
| 5 | 172,426 | 212,245 | 5,123 | 34% | 5,841.23 |
| 6 | 182,525 | 228,707 | 1,457 | 10% | 1,521.65 |
| 7 | 154,620 | 189,644 | 361 | 2% | 454.87 |
| 8 | 158,479 | 196,113 | 553 | 4% | 649.58 |
| District of Columbia (Total) | 1,313,042 | 1,628,496 | 15,114 | 100% | 2,208.04 |
Sources: District of Columbia Primary Care Needs Assessment 2018, Washington, D.C. Department of Health; U.S. Census Bureau; Author’s tabulation of data obtained from D.C. DOH licensee Masterfile, August 2020.
| Table A-3: Race, Ethnicity, and Life Expectancy Ethnicity of the Population by Ward in Washington, D.C., [35] | |||
| Ward | Non-white population | Hispanic/Latino | Life Expectancy (2011 – 2015) |
| 1 | 42% | 21% | 79.8 |
| 2 | 31% | 12% | 85.0 |
| 3 | 19% | 10% | 87.0 |
| 4 | 69% | 25% | 79.4 |
| 5 | 69% | 11% | 75 |
| 6 | 51% | 8% | 78.2 |
| 7 | 97% | 4% | 72.1 |
| 8 | 96% | 3% | 71.7 |