

This article is the fourth in a series on COVID-19 and the District of Columbia’s health care workforce, which discusses the ecosystem of health care clinicians, evaluates patients’ access to clinicians, and measures health care capacity.
Read the other articles in the series:
- COVID-era health care workforce capacity in Washington, D.C. | November 2, 2020
- Inequalities in health care need and demand across the District | February 17, 2021
- Who is providing COVID-19 care in the Washington Metropolitan Area? | July 21, 2021
Introduction
The COVID-19 pandemic brought attention to our health care system, highlighted inadequacies in care, and caused changes to the number of health care clinicians as well as their working conditions. Across the nation, many policies were put in place to increase the number of health care clinicians, increase the scope of practice for clinicians, and improve public access to clinicians. However, due to a lack of publicly available data and a fragmented health care system, little is known about how the health care workforce changed due after the onset of COVID-19.
As hospitals faced capacity limits and health care clinicians’ patient loads were much higher than average, states across the country began implementing changes to help increase the number of available health care clinicians (HCCs). Operating primarily through executive orders and declared states of emergency, states granted licensing bodies the ability to allow clinicians with out-of-state, inactive, and expired licenses to practice as if they had active in-state licenses. These changes likely added thousands of health care clinicians to the workforce across the country. More than half of states still have active licensure requirements that are more flexible than they were before COVID-19.1
Additionally, expanding the scope of practice for some clinicians increased health care capacity, even holding fixed the number of clinicians. For example, in almost half of states before the pandemic, nurse practitioners (NPs) were not allowed to provide direct patient care.2 During the height of the COVID-19 pandemic, many states allowed for direct patient care, and many more temporarily suspended or waived collaboration, supervision, and protocol requirements.3 Additionally, telehealth, which existed but was underutilized prior to the pandemic, was expanded due to demand increases for treating COVID-19-related symptoms and other illnesses, as well as relaxed restrictions on telehealth practice.
However, despite the implemented policies intended to boost workforce capacity, the pandemic placed unrelenting pressure on clinicians. Burnout, illness, and death of health care clinicians (HCCs), as well as retirement, transition into non-healthcare employment, and departure from the labor force altogether reduced the number of actively licensed clinicians. An article in The Atlantic suggests that one in five health care clinicians have quit their jobs since the beginning of the pandemic. Common reasons cited include experiencing illness, grief, frustration with patients who refuse to vaccinate, a desire to make higher salaries as traveling care providers, staffing shortages, and increased strain on the existing workforce brought on by resignations.
The net effect of these trends and pressures on health care employment is not immediately clear, prompting us to ask: What changes occurred to D.C.’s health care workforce in the early pandemic?
Using Department of Health licenses to estimate the number of health care clinicians
To date, little published research shows how the health care workforce has changed since the pandemic began. Most publicly-available sources one would typically look to, like the Bureau of Labor Statistics (BLS) Occupational Employment Statistics (OES, now OEWS)4 or American Community Survey (ACS) data, which this series looked at previously, are not able to precisely estimate the number of HCCs in 2020 and 2021.5
To show how the pandemic and ensuing policies have affected the HCC supply in D.C., we submitted multiple Freedom of Information Act (FOIA) requests to the D.C. Department of Health (DOH) to create a database of clinicians who are licensed to practice in D.C. This licensee database is a full census of licensed clinicians in D.C. at three points in time (April 2020, January 2021, and August 2021), presenting the clearest picture of who is available to provide care to the District’s residents.6 Importantly, it is not subject to the potential measurement error in BLS data and other resources, such as extrapolating to mid- and post-pandemic periods using pre-pandemic years of data. Counts provided below are restricted to clinicians with active licenses who are licensed by the D.C. Department of Health (i.e. licenses are not expired, suspended, or on probation for any reason).
Our database contains all clinicians who have active licenses with the D.C. Department of Health and their primary work address (which could be a medical office, hospital, or other facility). As such, our data show clinicians with practices located in D.C. as well as those who are licensed in D.C. but work anywhere in the broader DMV region (i.e. D.C., Maryland, or Virginia). Health care clinicians generally need active licenses for each state in which they provide care. When clinicians work in Maryland or Virginia, they need multiple licenses, one for each state in which they provide care. This does not represent the whole universe of clinicians who are potentially available to D.C. residents, as there are clinicians licensed in Maryland and Virginia who can provide care to District residents who travel to those locations. For more information about the data, see the ‘About the data’ section at the end of this brief.
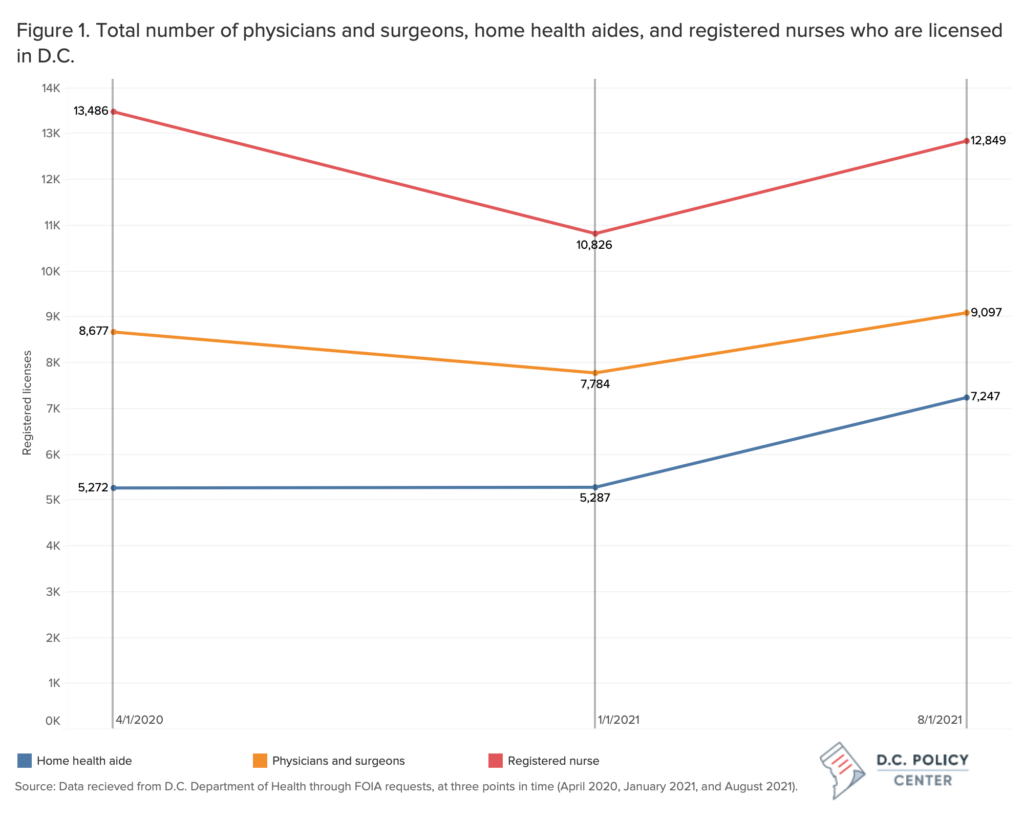
Between April 2020 and August 2021, the total number of almost all types of D.C. licensed health care clinicians bounced back following an initial decline.
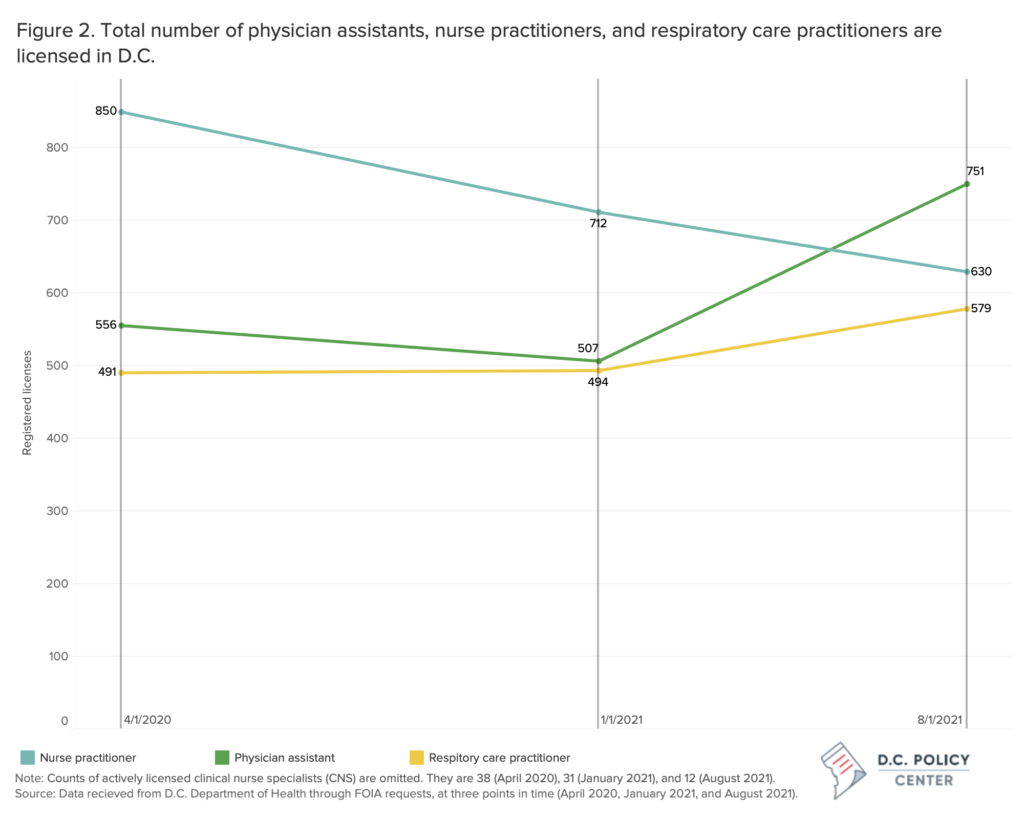
Between April 2020 and January 2021, the number of total D.C. licensed physicians and surgeons, nurse practitioners, and registered nurses decreased. The number of total D.C. licensed registered nurses decreased by nearly 20 percent, from 13,486 RNs in April 2020 to 10,826 in January 2021. Additionally, the number of total D.C. physicians and surgeons decreased by 10 percent, and the number of total D.C. nurse practitioners decreased by 17 percent (Figures 1 and 2). However, between January and August 2021, the number of clinicians recovered to April 2020 levels or increased.
By August 2021, many types of health care clinicians had reached similar or greater numbers than in April 2020. The number of total D.C. licensed home health aides, who likely became more important as COVID patients were released from inpatient settings, increased by 37 percent from April 2020 to August 2021. Similarly, between April 2020 and August 2021, the number of total D.C. licensed physician assistants increased by 35 percent, and total D.C. licensed respiratory care practitioners increased by 18 percent. Some types of licensed providers remained relatively stable in number between April 2020 and August 2021, including the number of total D.C. licensed physicians and surgeons (increased by 4 percent) and the number of total registered nurses (decreased by 5 percent). Nurse practitioners were the only D.C. licensed clinician type to decrease in number, dropping by 26 percent between April 2020 (850) and August 2021 (630).
The number of D.C. licensed health care clinicians with primary work addresses in the District increased in the early pandemic period. This can be shown by comparing the ratio of total D.C. licensed clinicians to the number of clinicians who are licensed in D.C. and have primary work addresses in the District in April 2020 (1.05) as well as in August 2021 (0.968). These numbers mean that in August 2021, a smaller proportion of clinicians licensed in D.C. had primary work addresses listed outside of D.C. as compared to April 2020.7 Looking at the number of D.C. licensed clinicians who have primary work addresses in the District, many types of health care clinicians working in D.C. saw increases of greater magnitude than of total health care clinicians.
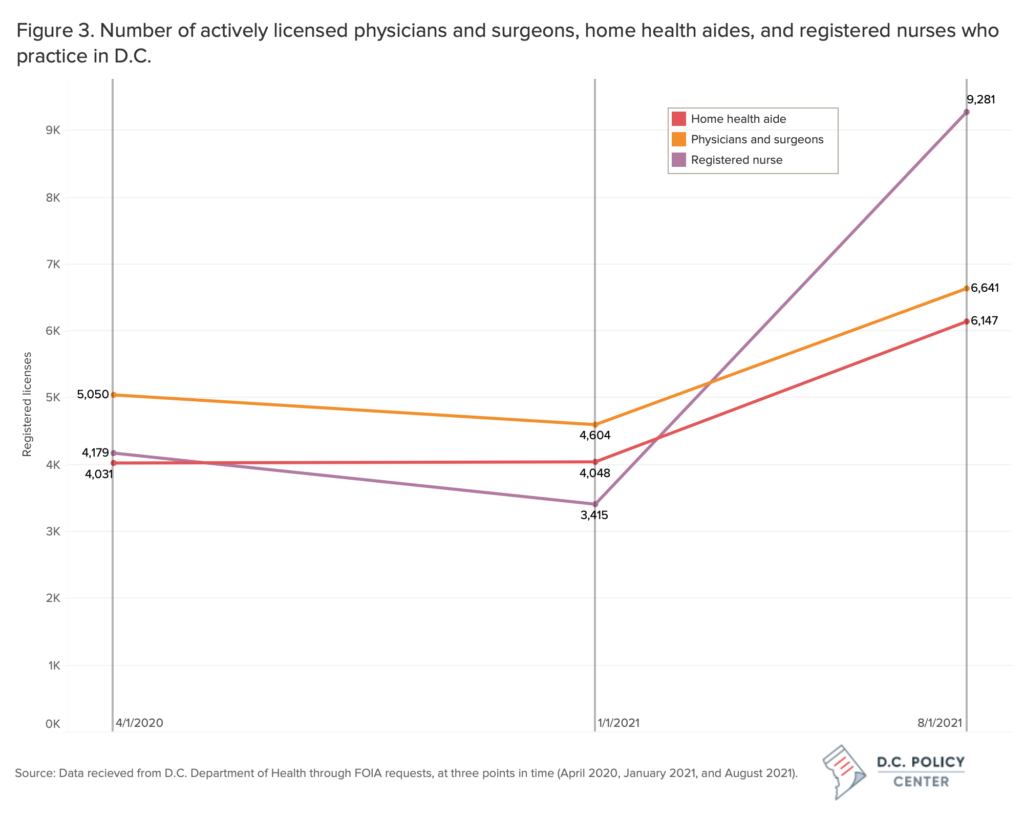
The number of D.C. licensed clinicians practicing in the city increased significantly for almost all license types between April 2020 and August 2021, with greater magnitude than total D.C. licensed clinicians.
Between April 2020 and August 2021, many news reports highlighted the challenges of health care worker retention and clinician shortages. However, D.C. saw significant increases in the number of almost all types of licensed clinicians with primary work addresses in the city, including physicians and surgeons, nurse practitioners, physician assistants, registered nurses, home health aides and respiratory care practitioners. Registered nurses working in D.C. saw the largest increase during the early pandemic period, in both absolute and relative terms, climbing from 4,179 to 9,281—an increase of more than 100 percent.
The number of D.C. licensed physicians and surgeons working in the city in August 2021 (6,641) represents a 32 percent increase relative to the number in April 2020 (5,050). Home health aides also saw growth, with their numbers climbing from 4,031 to 6,147 (an increase of 52 percent) between April 2020 and August 2021.
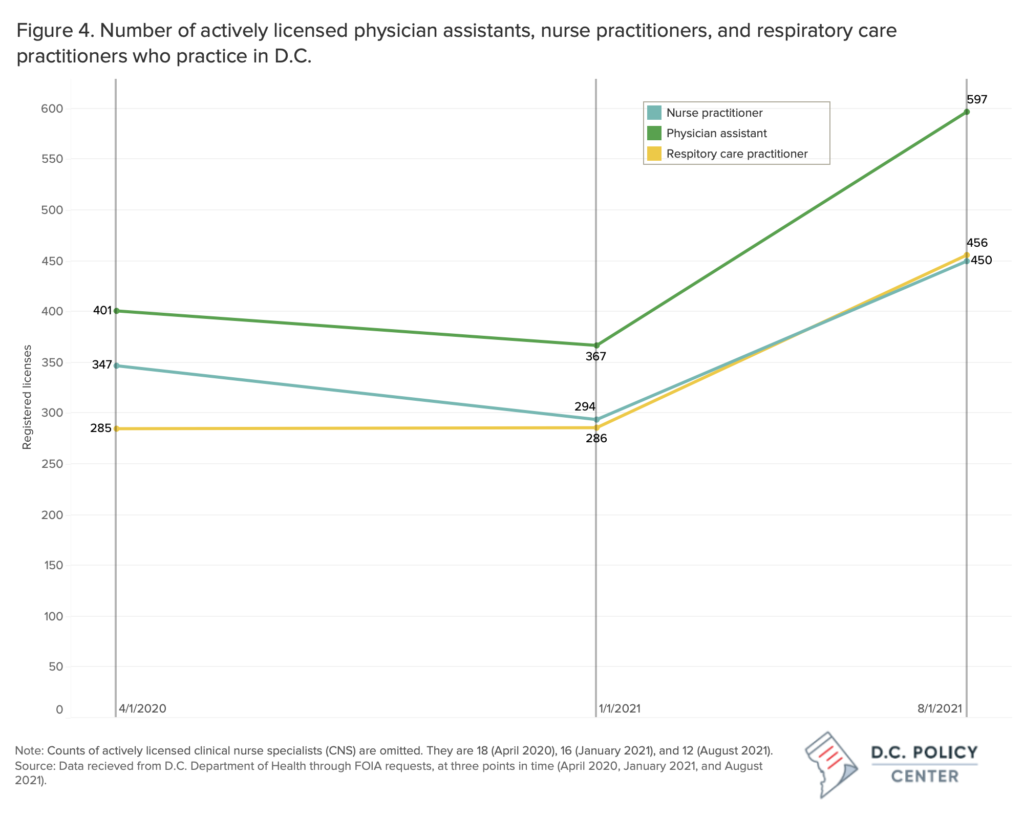
Additionally, the number of respiratory care practitioners, physician assistants, and nurse practitioners working in D.C. increased considerably between April 2020 and August 2021—by 60 percent, 49 percent, and 30 percent, respectively. The only type of clinician practicing in D.C. that declined in number was clinical nurse specialists, who were few to begin with in April of 2020 (18 licensees) and even fewer in August 2021 (12 licensees).
We reiterate that, without more data on clinicians who are licensed in Maryland and Virginia, we cannot determine the full scope of health care clinicians who are licensed in the region.8 Looking just at the number of clinicians that are licensed in D.C. between April 2020 and August 2021, it appears that the total number of clinicians who are licensed in D.C. increased or remained relatively stable for four of the six types of clinician included in this analysis, while the number of D.C. licensed clinicians who have primary work addresses in the District increased for almost all types of clinician, and by larger magnitudes.
Understanding the trends
Looking only at D.C. licensed health care clinicians who have primary work addresses in the city, the number of clinicians increased substantially between April 2020 and August 2021. This could be due to a variety of factors, including multiple policy tools utilized by the District of Columbia to help increase the supply of health care workers throughout the pandemic.
The waiving of licensure renewal requirements likely drives a substantial component of the spike in clinicians.9 Additionally, the D.C. Workforce Investment Council awarded a $250,000 grant for up to four years to the DC Hospital Association Program Services Company, Inc. to establish a healthcare workforce intermediary to champion a sustainable, market-driven workforce development program.10 The D.C. Council also established the Nurse Education Enhancement Program in summer 2021, which provides $5.8 million over three years to support education and training for certified nursing assistants, home health aides, and medication assistants. 11 12Finally, some of the licensing applications changed from a paper application to an electronic application in 2021, possibly affecting the dataset as a whole.13
It is possible that idiosyncrasies of the months of April, January, and August are playing a role in our analysis, but it is unlikely that seasonality in licenses is driving the sharp increases in licensed clinicians. For example, the dip in clinician supply between April 2020 and January 2021 could reflect the fact that licensees tend to renew in late winter or early spring, or another similar trend. Similarly, and more importantly for the positive trend in clinician supply between January and August of 2021, health care licensees could be renewing in summer such that August represents a relative high point in the renewal cycle rather than a boost in health care clinician supply per se. However, it is atypical for practicing clinicians to let their licenses expire, making the timing of licensing renewals unlikely to be driving the significant increases in health care clinicians licensed in D.C.14 For more information, see the Appendix.
In a previous article, we showed the wide range of estimates in the number of health care clinicians between publicly available data sources, illustrating the need for more conclusive information to understand the current health care workforce. Additional data is needed to determine total health care clinician supply in the DMV, but we hope that this data inspires more plentiful public data on the supply of health care clinicians in the region.
Appendix: Looking at seasonality of licenses
One concern with simply looking at cross-sections of actively-licensed health care clinicians is that there might be seasonality in license expiration and renewal. For example, either by law or by convention, clinicians could tend to renew their licenses around the same time, or around the same several points in a year. Given that some clinicians may inadvertently allow their licenses to expire around these times, one could get a slightly biased clinician count depending on which side of this renewal spike one looked.
While it is atypical for clinicians to haphazardly allow their licenses to expire, we took a look at the data for all D.C. licensed clinicians (i.e. not restricting just to those with primary business addresses in D.C.). The figure below shows the number of licenses expiring (gray columns) and being issued (purple columns) across the calendar years 2010-2014 and 2015-2019.
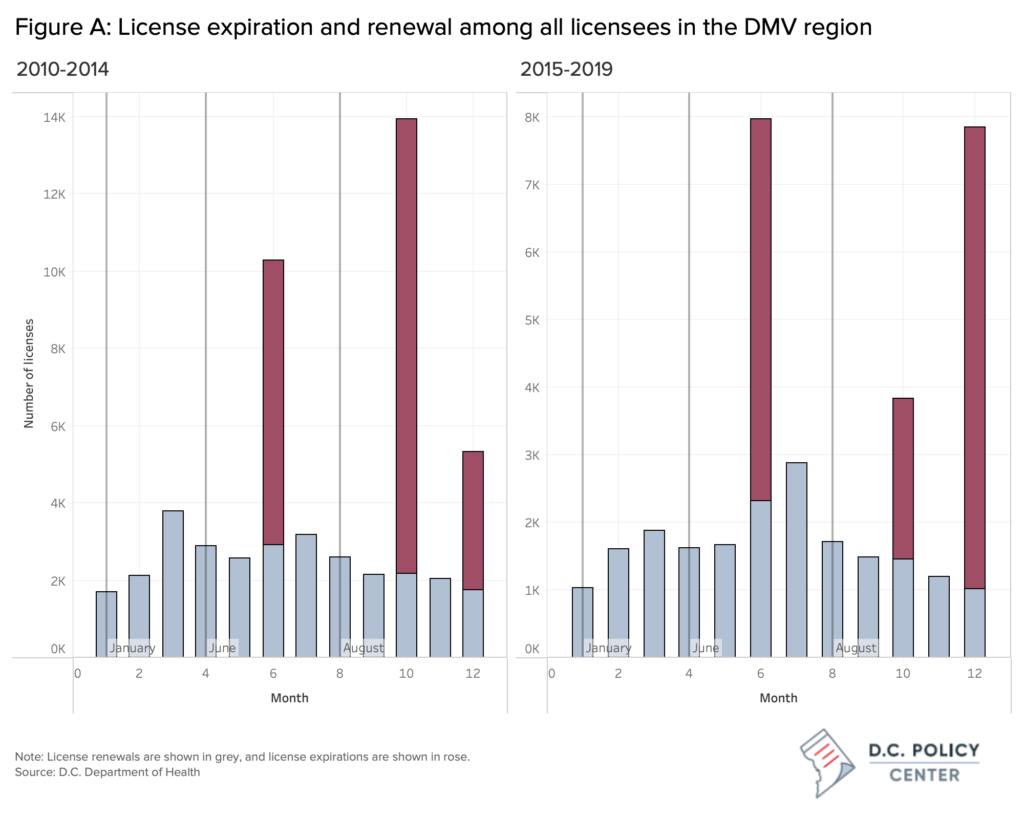
License renewals follow a relatively smooth trend over time (gray columns in Figure A). Conversely, expirations are clearly concentrated in the months of June, October, and December (rose columns in Figure A).
For our analysis, this suggests that the numbers of active licenses in January 2021 could be underestimated. Some licensees may have failed to renew—while still intending to actively provide care—rather than intentionally leaving the workforce. In other words, if we had instead compared August 2021 to February or March 2021—rather than January 2021—we might not have observed such a large initial decrease between the first two time periods. Subsequently, we may not have observed such a large increase between the latter two time periods. The count in August 2021 could similarly be affected by the June expirations, though August is several months removed from June and thus less likely to still be capturing a renewal lag.
We can conclude from this exercise that there is suggestive evidence of downward pressure on the net trend between the first two time periods (April 2020 and January 2021) and upward pressure on the net trend between the second two time periods (January 2021 and August 2021). Future work should leverage a larger number of cross-sections to address the question of seasonality more rigorously.
About the data
License data were obtained through FOIA requests to the D.C. Department of Health (DOH) at three points in time: April 2020, January 2021, and August 2021. Throughout, counts displayed reflect active licensees—that is, those that are not on probation or suspended. Where we make mention of clinicians practicing in D.C., we mean that the active licensee has a primary work address located somewhere in Washington, D.C. When we refer to total licensed clinicians, or clinicians in the DMV region (or similar phrase), we mean active clinicians licensed by the D.C. DOH but whose address is either in Washington, D.C., Maryland, or Virginia, including any part of the latter two states.
Endnotes
- NCBSN. (2022, April 21). State Response to COVID-19. https://www.ncsbn.org/State_COVID-19_Response.pdf
- Advocacy, AANP News, AANP. (2020, April 3). https://www.aanp.org/news-feed/five-states-take-action-to-expand-access-to-care-during-covid-19-pandemic
- AANP. (2022, March 31). https://www.aanp.org/advocacy/state/covid-19-state-emergency-response-temporarily-suspended-and-waived-practice-agreement-requirements
- Notably, OEWS methodology also relies on non-COVID years to produce COVID-era estimates, which suggests that 2020 numbers do not capture the impact of COVID on employment. Using the OEWS approach would produce 2021 numbers that rely on 2018 and 2019 survey responses, which limits the ability of OEWS data to speak to the pandemic’s impact on health employment. See here for more information: https://www.bls.gov/news.release/ocwage.nr0.htm.
- A longer discussion about these data sources can be found in past articles in the series. Two important points are that the American Community Survey relies heavily on weighting small samples and that the Bureau of Labor Statistics data pre-pandemic trends may not hold for predictions about the pandemic period.
- Licensing data does not necessarily reflect how many people are actively practicing or for how many hours a week. The Board of Medicine, Board of Chiropractic and Board of Nursing have done surveys at times to better understand how many individuals hold licenses and are actively practicing.
- Our analysis is not designed to quantify how many licensees may have shifted to primarily practicing in Virginia or Maryland during this time period, and we thus recommend caution in interpreting this finding.
- Consider a community in Northeast D.C. This community could see a decrease in raw supply of D.C.-licensed clinicians in Prince George’s County between April 2020 and August 2021 but could see parity or an increase in available patient care hours if the number of Maryland-licensed clinicians in Prince George’s County increases (or similar results if their number of hours worked increases).
- Board of Nursing, D.C. Department of Health. https://dchealth.dc.gov/bon Maryland has instituted similar policies. Corin, C. (2021, September 23). Governor Hogan announces steps to increase the nursing workforce statewide. WDVM. https://www.localdvm.com/news/maryland/governor-hogan-announces-steps-to-increase-nursing-workforce-statewide/
- DC Works, D.C. Department of Health. https://www.aanp.org/advocacy/state/covid-19-state-emergency-response-temporarily-suspended-and-waived-practice-agreement-requirements
- Code of the District of Columbia, Council of the District of Columbia. Section 32-1693.02. Establishment of the Nurse Education Enhancement Program. https://code.dccouncil.us/us/dc/council/code/sections/32-1693.02
- Actions of organizations such as Campaign for Action also may have contributed to workforce increases. Campaign for Action’s mission is to “serve the public by promoting a culture of health through transformative collaborations between nurses, communities, and other professional stakeholders.” Campaign for Action. https://campaignforaction.org/state/district-of-columbia/.
- Board of Nursing. (n.d.). Retrieved July 7, 2022, from https://dchealth.dc.gov/node/149382
- In particular, we note the relatively smooth trend in renewals, which are relatively uniform in their distribution across the calendar year.