What do we know about income distribution patterns in the District, and how they change by race? And how does the income distribution within racial groups in D.C. compare to the rest of the country? Looking at ACS income data for Black- and white-headed households, we uncovered three interesting observations.
Households in D.C. headed by Black residents earn more than their peer households nationwide—unless they are at the bottom 40 percent of the income distribution.
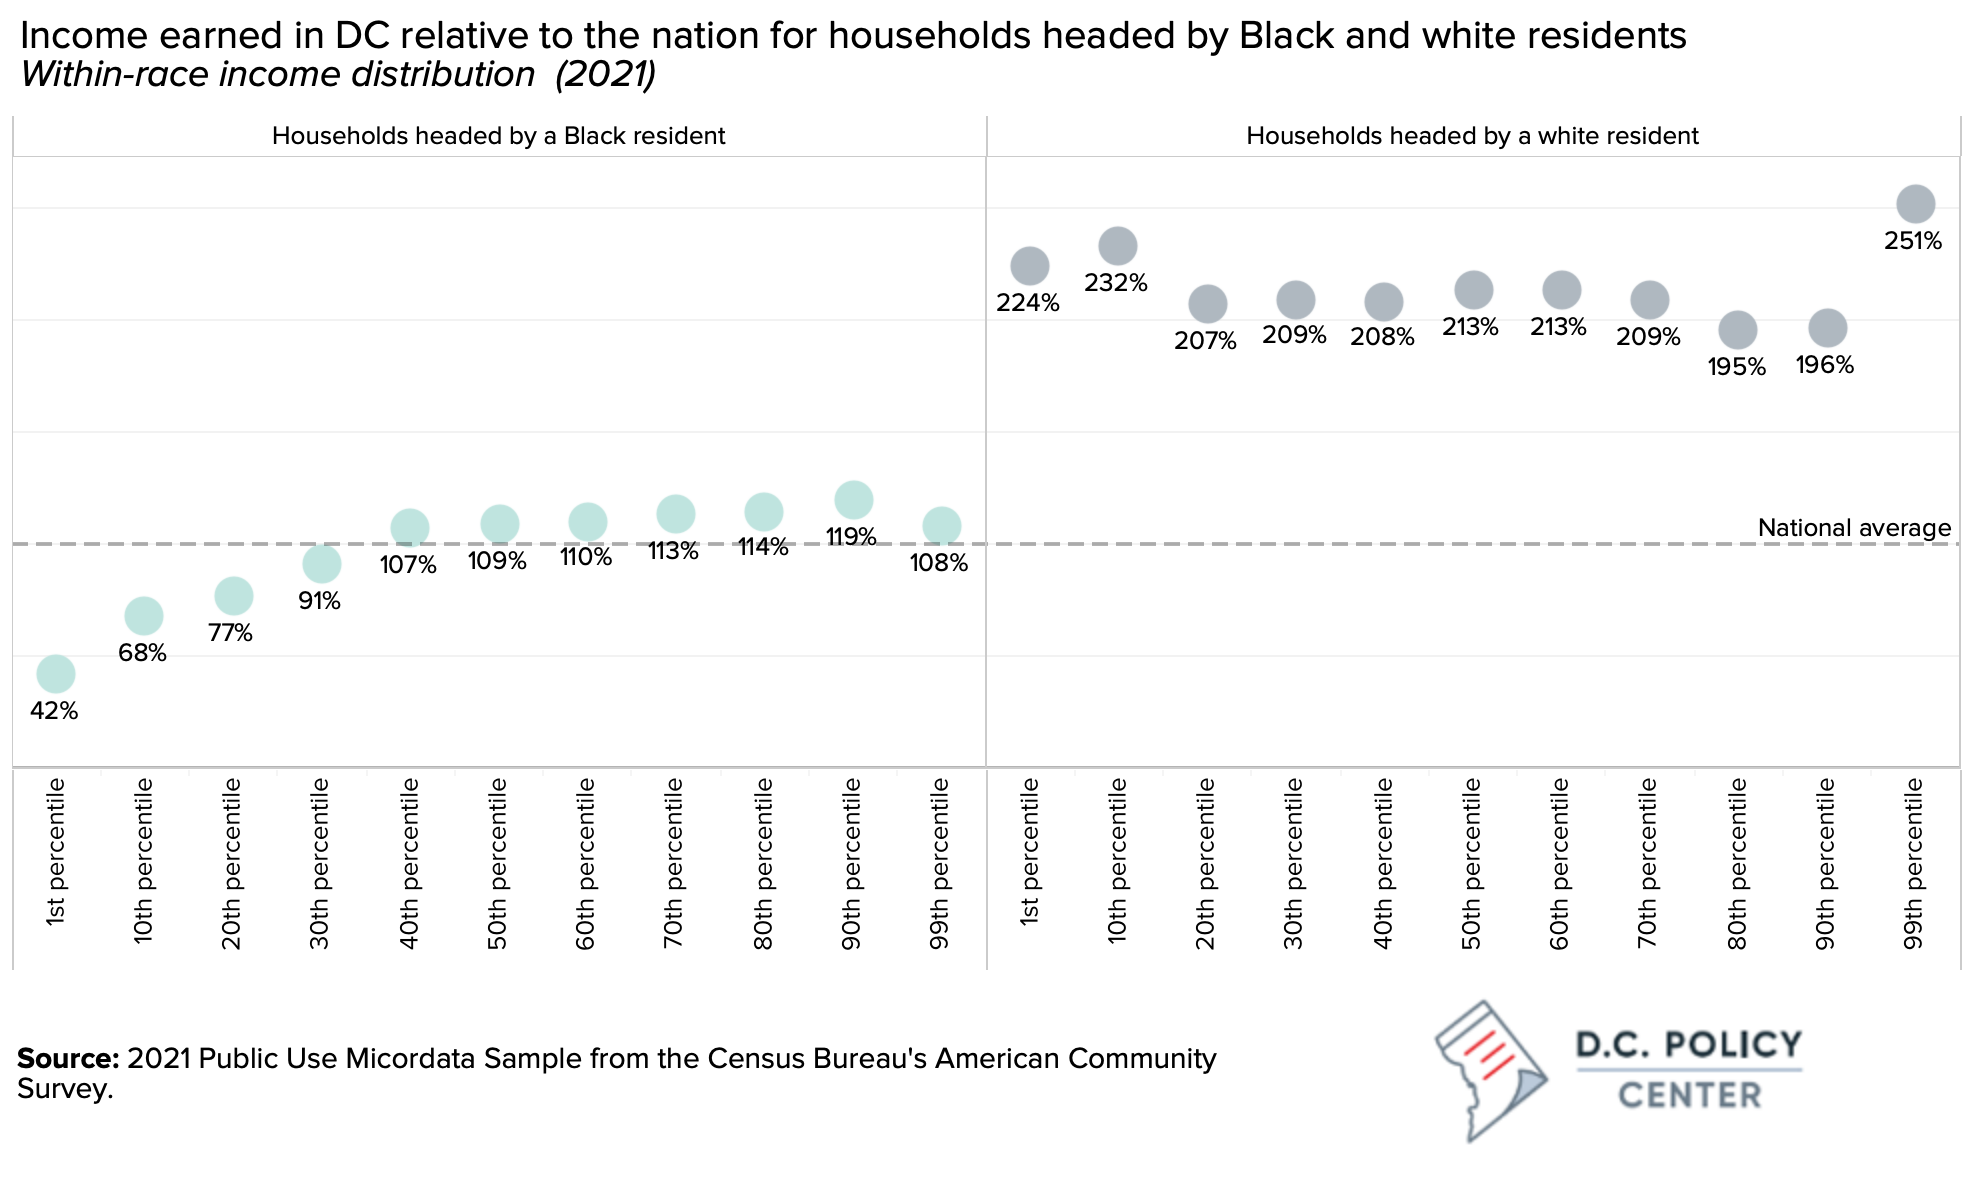
Figure 1 shows the incomes of D.C. households at various income percentiles, relative to the national average at the same percentile, for both Black and white populations. At every income level above the 40th percentile, households headed by a Black resident earn more than the national average for households headed by Black residents in the same income percentile.
The trend for households headed by a Black resident reverses at the bottom of the income distribution: at the 20thpercentile, Black resident-headed households in D.C. earn 77 cents on the dollar compared to their peer households nationwide. That gap is even greater at the very low end of the income distribution: Black resident-headed households in D.C. in the bottom one percent of the income distribution earn 42 cents for every dollar earned by their peer households across the country.
The data tell a strikingly different story for D.C.’s white-headed households. At every level—including the top and bottom one percent of the income distribution—households headed by a white resident in D.C. earn about twice the income earned by white-headed households across the country.
Households headed by a Black resident earn more in D.C. than in other cities—if they are in the top 60 percent of income distribution.
Figure 2: Income earned in D.C., relative to the national average and selected cities, for households headed by Black and white residents, 2021
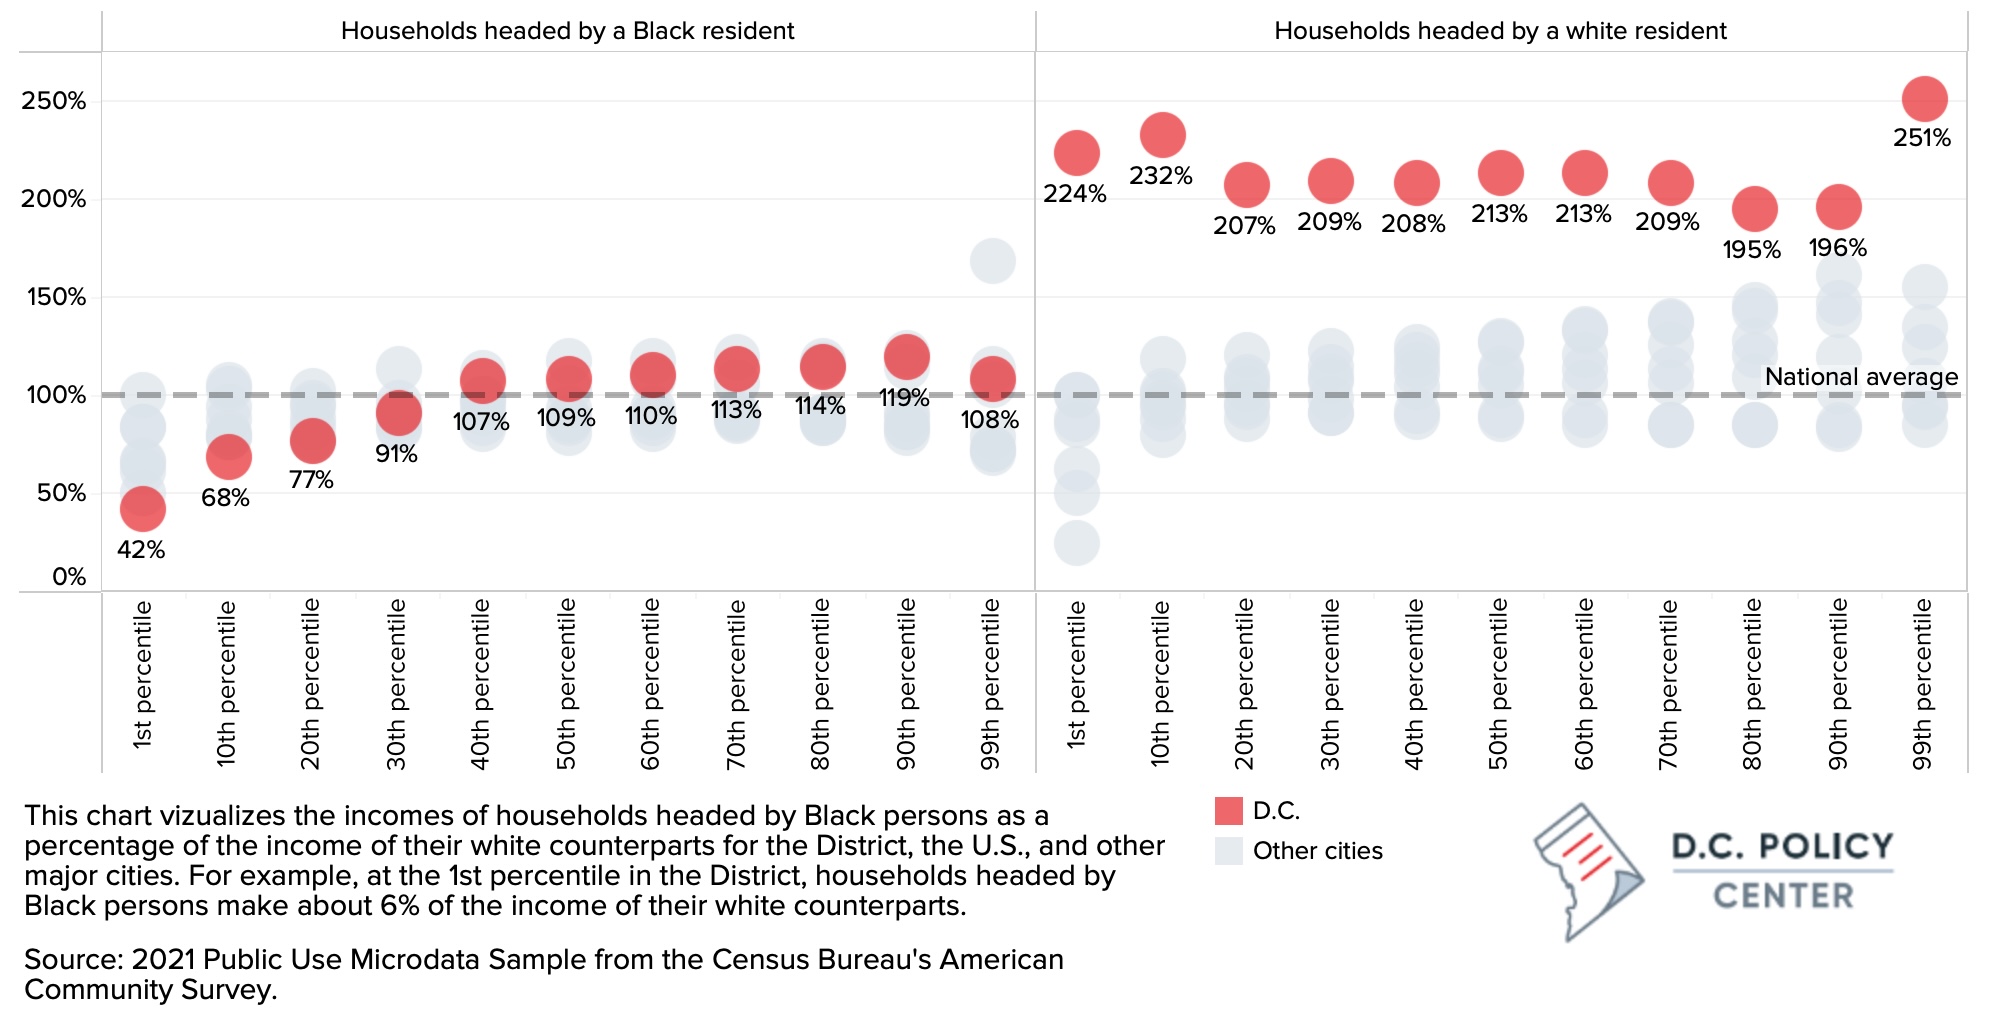
For households headed by a Black resident at the top 60 percent of the household income distribution, the District outperforms many other cities for which we can compile data.1 But for Black resident-headed households at the bottom 40 percent of the income distribution, household incomes in D.C. trail behind other cities.
Again, in contrast, at every point in the income distribution for households headed by a white resident, incomes in D.C. far exceed incomes of white-headed households in other cities.
Households headed by a Black resident earn much less in the District of Columbia than in the region as a whole.
Figure 3: Income earned in D.C. relative to the national average and selected metro areas, for households headed by Black and white residents, 2021
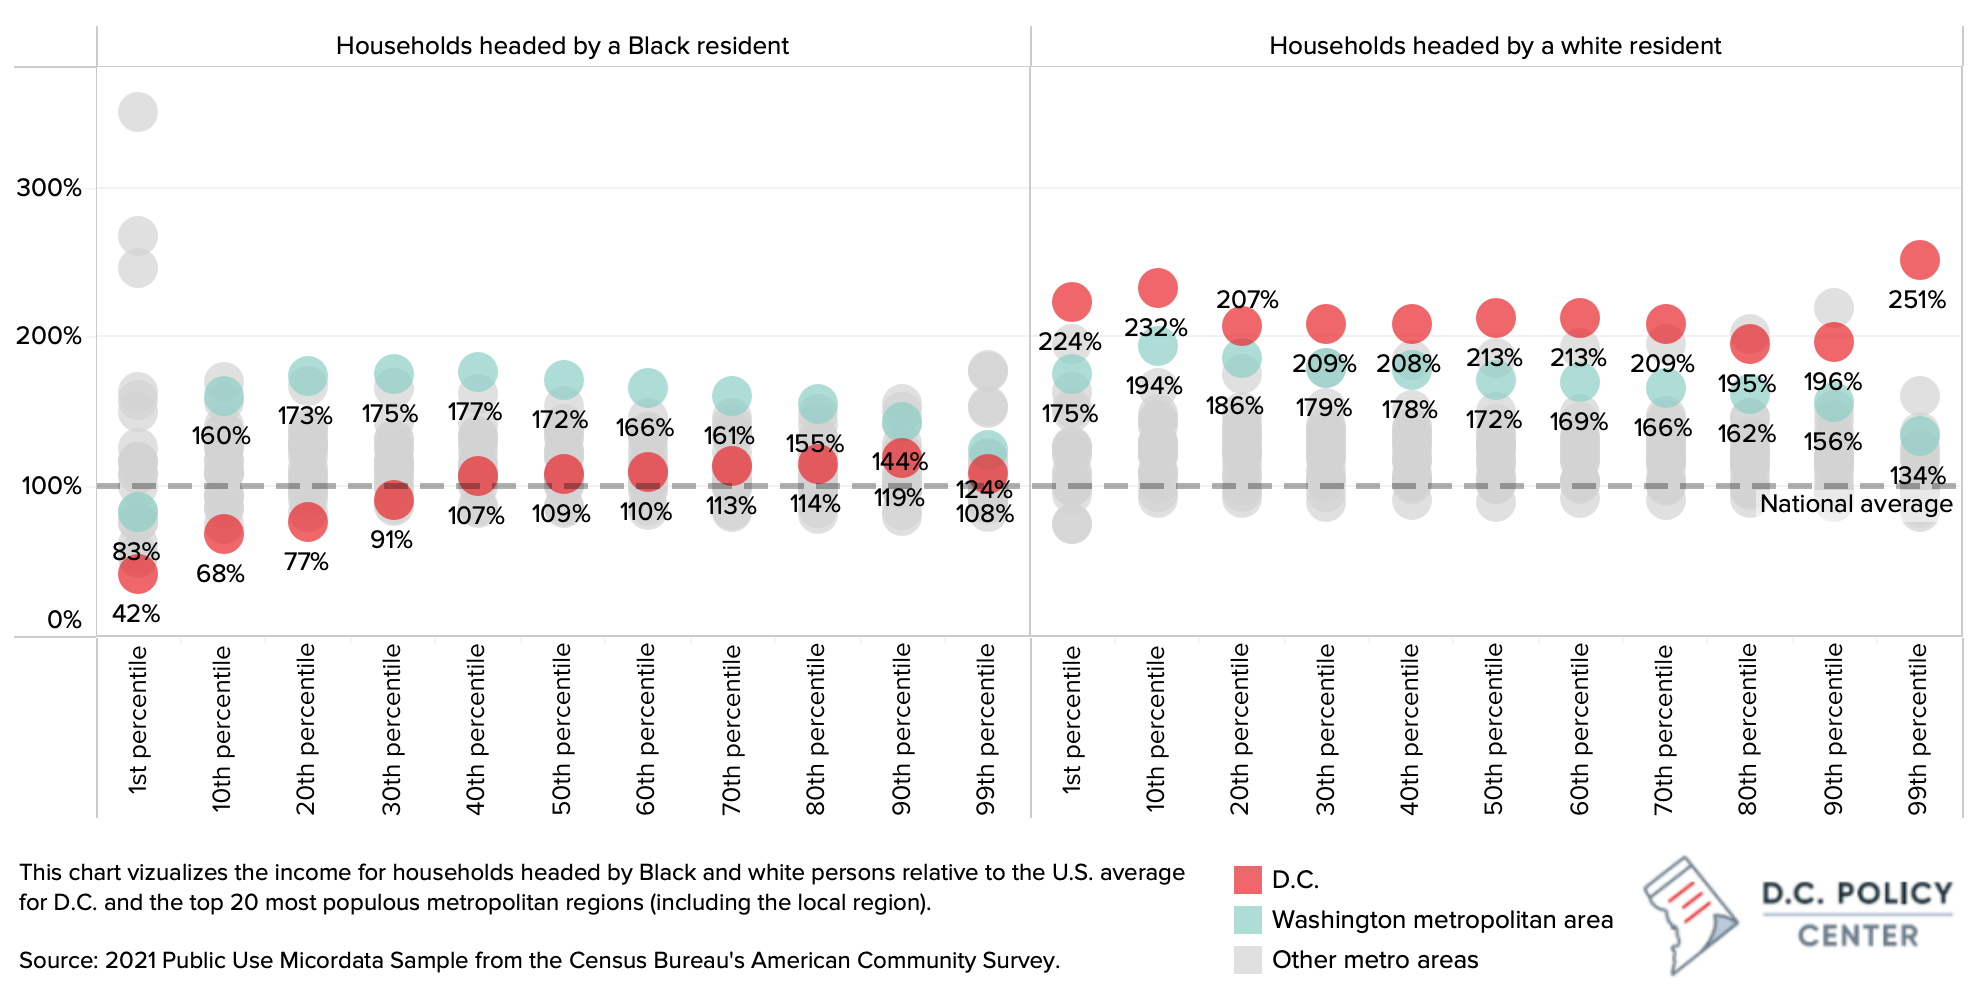
While we cannot be certain, it is plausible that the differences in household earnings between the District and the local metropolitan region are due to the distribution of wealth across the region. Data suggest that there are more households headed by a Black resident in the city with relatively low incomes, while the areas outside the city have a larger number of upper-middle class Black resident-headed households with higher incomes.
In contrast, white-headed households in D.C. out-earn their counterparts in the Washington metropolitan area. This suggests that the white-headed households in D.C. are among the wealthiest in the region, while the Black resident-headed households in D.C. are among the poorest in the region.
Methodology
To ensure that the estimates used in our analysis were robust and accurate, the metropolitan regions used in our analysis were chosen based on population size alone (the top 20 most populous). The cities used were chosen based on population size, population composition (at least 10 percent Black residents and 10 percent white residents), and the size of the standard errors of the estimates created from the American Community Survey data. This better ensured that the estimates used in our analysis were robust and accurate.