
An assessment of the District of Columbia’s office market shows that prior to the pandemic, mixed-use neighborhoods were becoming increasingly competitive with downtown D.C., and now, these markets have proven to be more resilient to the pandemic’s negative impacts. This suggests that diversifying the use of space downtown would help create a more livable, inclusive environment and protect District revenue from future economic downturns.
Introduction
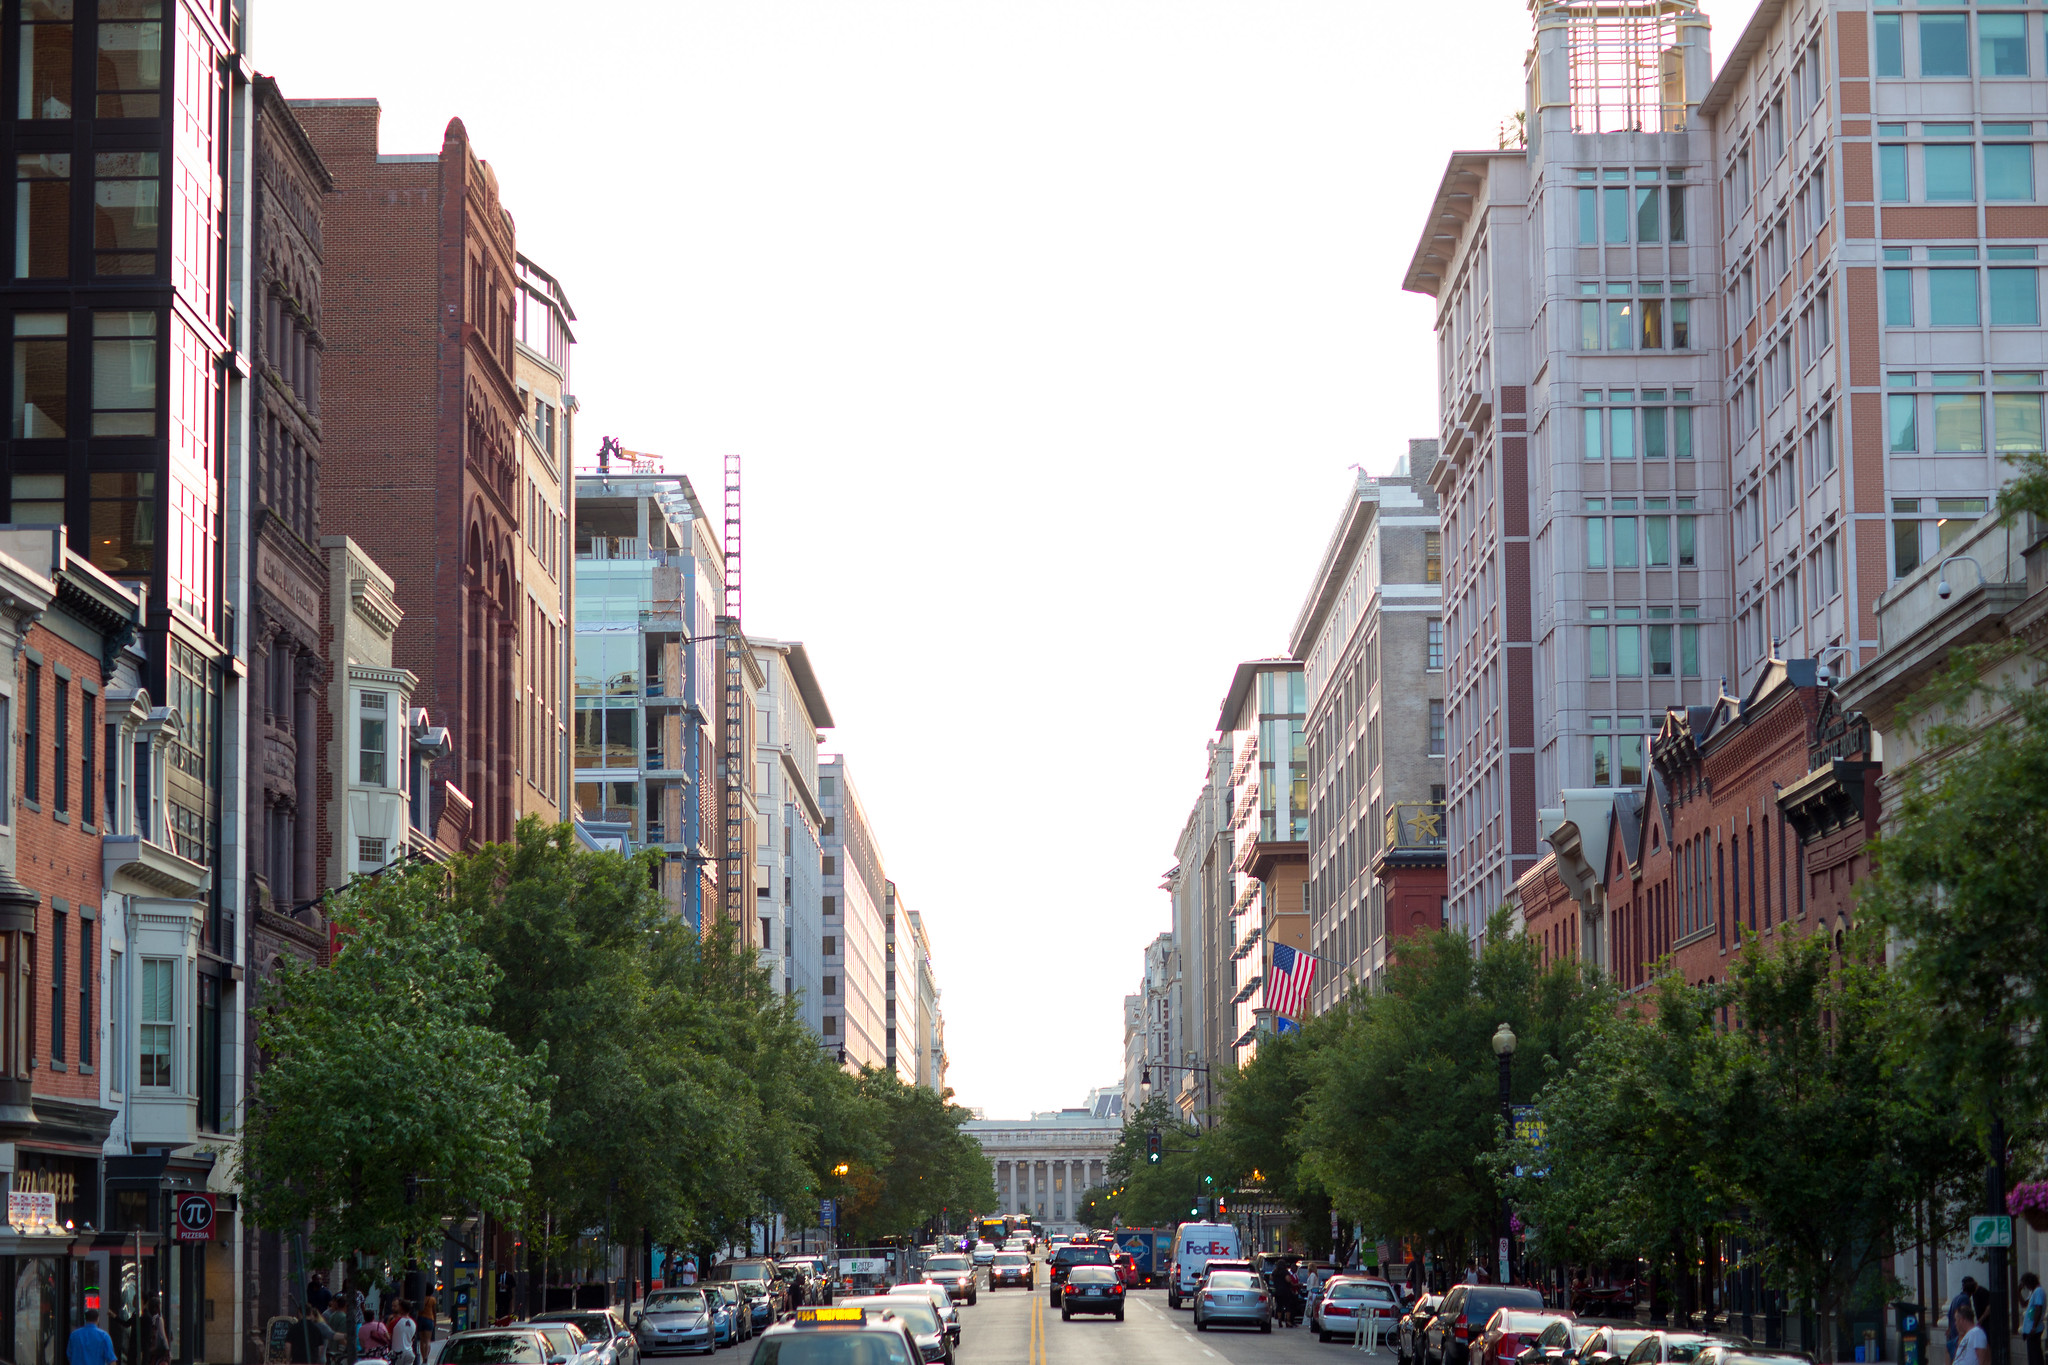
The impacts of the COVID-19 pandemic have led to a lot of speculation about the future of cities, but many agree that cities, and especially downtowns, will experience some changes in use as people alter how and where they live and work.[1] At the onset of the pandemic, economic activity in downtowns across the nation came to an abrupt halt as workers shifted to telework, businesses closed, and foot traffic declined.[2] At that time, we imagined that recovery meant going back to business as usual. However, nearly twenty months later, workers, residents, and employers have all become accustomed to a new way of life, changing the way that they interact with dense urban environments. Now, data are just beginning to reveal exactly how preferences are shifting, offering a glimpse into what downtown recovery might look like and how cities may begin to adapt.
An important feature of the post-COVID world is the increasingly blurry distinction between the home and the office. As a result, many city dwellers may have new or altered expectations for the neighborhoods in which they live or work. One expectation (or hope) is that central business districts will slowly change into mixed-use neighborhoods with a greater number of residents, increasing the amount of economic activity.
To begin to understand whether these shifting preferences have the potential to align with what the future of city downtowns will actually look like, we asked: Which types of neighborhoods with a heavy office presence in the District of Columbia have been most resilient to the pandemic? To uncover these trends, we first classified the city’s office submarkets, as defined by CoStar, as “office-heavy,” “mixed-use,” or “other” (typically residential-heavy), based on each submarket’s built environment and actual use of buildings.[3] We then examined office market trends to see if mixed-use submarkets outperformed other types of submarkets.

The District’s shift to remote work has been dramatic
With many jobs in the city easily workable from home,[4] workers in the District of Columbia quickly shifted to remote work, putting the city’s office-heavy neighborhoods in a vulnerable position. With the lingering impacts of the COVID-19 pandemic and the surge of the Delta variant, the District’s return to the office has been sluggish, even as public health restrictions were lifted and vaccines became available. As of mid-October 2021, the number of office workers that worked on site was 27 percent of pre-pandemic occupancy in the DowntownDC Business Improvement District (BID) and 31 percent of pre-pandemic occupancy in the rest of the District.[5] This reluctance to return to the office has contributed to the citywide office vacancy rate hitting 14.1 percent in the second half of 2021, the highest it has been since before the Revitalization Act in 1997.[6]
It is likely that a hybrid office-and-home work schedule is here to stay. In a September 2021 survey by the Greater Washington Partnership, employers reported that they expect, on average, 68 percent of employees to be onsite by summer 2022.[7] Many large employers, such as PwC, Deloitte, Google, and KPMG, have already announced a permanent shift to work-from-home.[8] Other major employers, including Amazon, have leaned into permanent hybrid models.[9]
A longer-term, substantial shift to telework would have lasting impacts on cities, particularly downtowns, as workers are given more flexibility to decide where they want to live and work. To date, this is evidenced by declining public transportation ridership[10] and the declining assessed values of the District’s office buildings. The District’s CFO estimates that for FY 2022, the city will see property tax revenues from large office buildings decline by $121 million due to the 9.7 percent reduction in total assessed values.[11] Further, even a small shift in workers and residents to the suburbs could have lasting impacts on the District’s revenue. These threats capture the importance of adapting to the post-pandemic trends.
In the next sections, the following CoStar office submarkets are classified as “office-heavy”: Central Business District (CBD) and East End. The following submarkets are classified as “mixed-use”: Southwest, Capitol Hill, Georgetown, West End, NoMa, and Capitol Riverfront.

Even before the pandemic, there were signs of declining demand in the District’s office market, and mixed-use neighborhoods were becoming increasingly competitive with downtown
As of 2019, the year before the pandemic, the vacancy rate across the entire office market reached 11.2 percent—the highest it has been since 1993. However, this rise in vacancy was not felt evenly across all submarkets. In the city’s most office-heavy areas, the vacancy rate reached 13 percent in 2019. Meanwhile, in the rest of the city, vacancy rates remained steady relative to previous years, hovering at 9 percent. While there was a spike in new buildings delivered in 2019, the submarkets outside the city center were able to absorb this space more readily than the office-heavy submarkets.

Mixed-use submarkets, such as Capitol Riverfront and NoMa, have become increasing competitive in recent years. Since 2017, mixed-use submarkets have contributed to the majority of positive office absorption in the District, despite holding less than one third of the city’s entire office inventory. For example, in 2019, mixed-use submarkets held 28 percent of the District’s office inventory, but accounted for 96 percent of the city’s net absorption. In contrast, the District’s office-heavy submarkets have had more office space vacated than leased since 2018. Thus, on net, these office-heavy submarkets did not account for any of the city’s positive absorption in 2018 and 2019, despite holding 62 percent of the city’s office inventory.

These trends are in part fueled by the uptick in development that has occurred in many of these mixed-use neighborhoods in recent years. For example, office space at The Wharf, a 3.2 million square foot mixed-use project in Southwest[12], has been well sought after, attracting anchor tenants such as the new Washington Gas headquarters and Williams & Connolly, a large law-firm.[13] Many of the companies moving to The Wharf have cited amenities as an important recruiting tool. Both employers and workers enjoy the convenience of working in office space close to other community amenities, such as parks, retail, grocery stores, and residential space. Mixed-use communities offer this, and often at a lower cost than office-dense downtowns.
In 2019, office rents were 6 percent higher in downtown D.C. than in mixed-use areas. While this is down from the 16 percent lead that downtown had two decades ago, rents in downtown remain relatively high, pushing some employers out. This is indicative of both the increasing demand in mixed-use submarkets as rents become more competitive with office-heavy areas, and of the high cost of locating downtown relative to other areas in the city or region.

So far, mixed-use office submarkets have been more resilient throughout the pandemic
Since the onset of the COVID-19 pandemic, the District has seen more office space vacated than leased, with a net absorption loss of 3.3 million square feet between April 2020 and October 2021.[14] The majority of these losses have been concentrated in the city’s office-heavy submarkets. This is not surprising considering the abrupt and continued halt of economic activity in those areas. As of September 2021, the DowntownDC BID estimated that the downtown economy was operating at 33 percent of pre-pandemic levels.[15]
While downtown D.C. continues to struggle with decreased foot traffic, the economies in mixed-use areas recovered faster due to their higher concentration of residents. In Q1 2021, while office-heavy submarkets, on net, accounted for all the city’s negative absorption, mixed-use submarkets began to show signs of recovery, with a positive net absorption rate for the first time since the onset of the pandemic. Recovery did not begin for the office-heavy submarkets until Q2 2021; however, in the following quarter, these submarkets once again accounted for, on net, all the city’s negative absorption.

At least some of the vacated space is a result of companies reducing their real estate portfolios, by either eliminating their use of office space all together or renting smaller spaces. According to the Greater Washington Partnership survey, ten percent of employers with 50 to 200 employees, representing most District businesses,[16] indicated plans to reduce their real estate portfolios in the next year–an increase of 2 percentage points from the December 2020 survey.[17] Whether employers are reducing their real estate footprints or moving to new spaces, the remaining demand is concentrated in the District’s mixed-use submarkets. This is shown not only by absorption rates, but also vacancy and rent levels relative to pre-pandemic.
To date, In Q3 2021, the vacancy rate in mixed-use submarkets remains 2.1 percent higher than Q3 2019 vacancy rates, while vacancy in office-heavy areas remains 3.7 percent higher. Further, the recent increase in vacancy in mixed-use areas is accompanied by 462,478 square feet of new construction, whereas office-heavy submarkets have not had any new deliveries since Q3 2020.[18] Perhaps most indicative of demand, rents in mixed-use submarkets have increased by nearly 3 percent in Q3 2021 relative to Q3 2019, while rents in office-heavy submarkets remain below 2019 levels.


Mixed-use submarkets have consistently been more resilient than other submarkets in crises. After the attacks on September 11, which also resulted in a temporary halt of the District’s economy, mixed-use submarkets accounted for the majority of the city’s positive net absorption. In Q4 2001, the District’s mixed-use submarkets accounted for only 22 percent of the city’s office space, but 76 percent of the city’s net absorption. Meanwhile, office-heavy submarkets accounted for 66 percent of the city’s office space, but only 12 percent of the city’s net absorption. This was a flip from prior quarters when the office-heavy submarkets accounted for the majority of the city’s absorption–such as in Q4 2000, when office-heavy submarkets accounted for 99 percent of the District’s absorption. While the economy was able to recover much more quickly after September 11 than it has following the COVID-19 pandemic, the initial effects were similar, and when visitation and spending drop, downtowns are most vulnerable.
The high concentration of Class A space in mixed-use submarkets may contribute to the relative resilience of these areas in the long-term. In the District’s mixed-use submarkets, 75 percent of office space is Class A, compared to 60 percent in the office-heavy submarkets. The Class A market has actually been hit slightly harder than other office classes during the pandemic. For instance, the vacancy rate for Class A office in the Central Business District is currently at 18 percent, while the vacancy rate for all other classes in the CBD is 16.5 percent.[19] However, in the long-term, the amenities these spaces offer, such as high-quality air filters and touchless technology, will be desirable. The ability to tailor space to specific needs, such as offering flexible space for workers or addressing public health concerns will be increasingly important as leasing activity picks up again.[20] As preferences shift from quantity of space to quality of space, the District’s mixed-use submarkets are in the best position to accommodate this demand.
What do these trends imply about the future of cities and how D.C. can lean into new demands?
Over 75 percent of the built environment in downtown D.C. is dedicated to office space.[21] This made downtown D.C. vulnerable even before the pandemic. Any recession causing an increase in unemployment, or in this case, a complete shutdown of economic activity, will deeply impact the businesses and real estate market in office-heavy areas. Further, following the hit to the real estate market, the city’s property tax revenue coming from these areas, which is largely dependent on the assessed value of commercial office space, will also suffer.
A greater mix of uses and amenities would boost both the resilience of downtown and its attractiveness to residents and businesses. As evidenced by a rebounding multifamily housing market,[22] there is still a drive to live in the city, even if the future of work is changing or remains uncertain. The rise of telework does not have to mean the ‘death’ of downtowns or cities. Rather, residents working remotely may not work from home, but out of coffee shops or coworking spaces near their homes. They may still choose to meet coworkers over lunch or dinner, spending money at local businesses. This shift in behavior, which has been developing for years and was only amplified by the pandemic, signals how to best use the remaining developable land in the District, as well as how to best redevelop space.
Where feasible, converting office space to residential multifamily buildings would help boost the number of people in downtown areas outside of working hours, thus supporting local businesses. Residents would offer support to the neighborhood even when workers don’t, and these new units would offer increased access to jobs downtown. [23]
In other situations, it may make more sense to convert large, older office buildings into smaller, more flexible spaces that offer high-quality amenities. Many companies are choosing to downsize their real estate portfolio and are looking for smaller spaces.[24] Others are more likely to prioritize high-quality spaces over the size of the space. Being able to accommodate these demands would help reduce vacancy in the long term.
These trends are not only suggestive of how the District can adapt to shifting preferences, but also reveal new opportunities for the District. While occupancy is low, there is an opportunity for the city to diversify the type of businesses that are concentrated downtown. Many minority-owned small businesses and start-ups face barriers to accessing capital, making it tough to pay the high office rents in central D.C.[25] Encouraging and incentivizing these businesses to locate downtown, especially while rents are lower, would help diversify the District’s economy. As the market begins to recover and rents start to rise again, it will also be important to help these businesses retain their space, such as through programs that help small businesses own their own space. While the District offers incubator, accelerator, and co-working spaces[26], there is an opportunity to offer more businesses that start in these spaces the ability to remain in the District as they expand.
Finally, there is also a need to further explore some of the nuances that this analysis does not cover. This could include a deeper dive into the District’s zoning, and what use types on developable land and in re-developable buildings would be of the most value to the city. There are also other factors that influence a neighborhood’s resiliency during a crisis, such as access to parks, access to Metro, crime rates, and walkability, among others. Understanding:
- the full scope of what contributes to a neighborhood’s ability to bounce back after an economic recession, and
- how to best use the District’s zoning and remaining developable space,
will help advance efforts to make downtown D.C. more livable and resilient to economic downturns.
Methodology
In this analysis, we use a simplified definition of mixed-use, focusing on the mix of buildings in a neighborhood based on their primary use, rather than based on zoning or vertically mixed-use buildings. Office submarket boundaries are defined by CoStar, and each of these submarkets was categorized as either “mixed-use”, “office-heavy”, or “other” (such as residential-heavy or a mix of uses without a lot of office space). These categories were determined by using the Integrated Tax System Public Extract database and the Common Ownership Lots database via DC Open Data to calculate the number of office buildings relative to the number of vertical multifamily buildings. This metric was then compared to the ratio of office to multifamily based on (1) gross building area (GBA) and (2) land area. All three of these metrics yield similar results.
A simple ratio of multifamily to office was used, rather than assessing the mix of all use types, because we assume that a neighborhood with significant office space paired with multifamily is mixed-use, as other amenities, such as retail, are likely to follow.

The following filters were applied before calculating these metrics:
- Only properties with a land area greater than 0 were included, in order to filter out any poor data entry.
- Only vertical multifamily properties were considered, as this typology is most indicative of mixed-use areas. Single-family properties were not considered, as they take up a significant amount of space and create noise in focusing in on true mixed-use areas.
- Condo offices were not considered, as these buildings are primarily residential.
- Properties with an actual year built (AYB) of 2022 or later were not included.
- Multifamily properties with an AYB of 2020 or later were not included if the GBA was particularly small (<500), assuming the completion status of the building is not completed. This was then confirmed by looking at the year-to-year change in assessment values.
- For the metric focused on the ratio of buildings, each condo building was included only once even though the ITS database lists each unit.
- All duplicate SSLs were removed (PI lots).
Other notes:
- These trends were not tested for any level of statistical significance, and there were no controls for factors such as the office building size, Metro access, walkability, demographics, number of workers to residents, or similar.