

Out-of-school time (OST) programs, such as afterschool and summer programs, are important to many families the District of Columbia. Policy decisions around OST programming, like where OST seat are located, and how the city invests funding, are highly dependent on where children live and where they go to school. To set the stage for a deeper analysis of out-of-school time programs, this article examines where students live, where they attend school, and how these vary both geographically across the city, and by various student characteristics.
About this series
This publication is part of a series adapted from our full report commissioned by the District of Columbia Deputy Mayor for Education (DME), Needs assessment of out-of-school time programs in the District of Columbia.
Other publications in this series include:
- Chart of the week: D.C. children face unequal access to out-of-school time programs
- Demand for out-of-school time programming shifts, depending on where students live versus where they go to school
- How many out-of-school time seats D.C. has, and where they’re located
- How many more out-of-school time seats does the District of Columbia need?
- How close are out-of-school time programs to where students live?
- Who provides of out-of-school time programs in the District of Columbia?
- Out-of-school time programs in the District of Columbia: Parent and guardian experiences
- Recommendations for out-of-school time programs in the District of Columbia
Access the underlying original report in printable PDF format here.
Where OST programs are located, and where funding is invested, is highly dependent on where children live and where they go to school. For example, having OST programs at or around schools could create the best access for afterschool and before school programming, especially for younger students. In contrast, families might prefer having programming close to where students live during the summer.
By these different metrics and associated goals, the placement of OST seats could vary dramatically. That is because of two things. First, public school students are unevenly distributed across the city. Second, many students attend a school outside of their neighborhood.
Using public school enrollment information, this article examines where students live, where they attend school, and how student residence and school location vary across the city and with various student characteristics. The analyses are based on student-level data for public school enrollments for school year 2021-22, aggregated at the ward and neighborhood cluster level for students enrolled in PK3 through Grade 121 and broken down by students’ race and ethnicity, at-risk status, special education needs, and English learner status. This information is presented separately for PK3 through grade 8 (elementary and middle school) and grades 9 through 12 (high school).2
For school year 2021-22,3 audited student level data capture 89,905 students who were enrolled in the District’s public schools (DCPS and public charter schools) across grades PK3 through 12.4 Of these, 68,888 students were enrolled at the elementary or middle school level, and 19,017 were enrolled in high schools.5
Public school students by their residence
Public school students are unevenly distributed across the District’s eight wards and 46 neighborhood clusters (39 clusters are residential and seven are typically nonresidential clusters).6 Distribution of students across wards and neighborhoods follows zoning patterns, housing characteristics, and housing values, which, in turn, shape the demographic and socioeconomic characteristics of neighborhoods. While each ward is administratively drawn to hold about the same size population, the population of school age children across wards (and neighborhoods), and public school participation, can vary greatly.
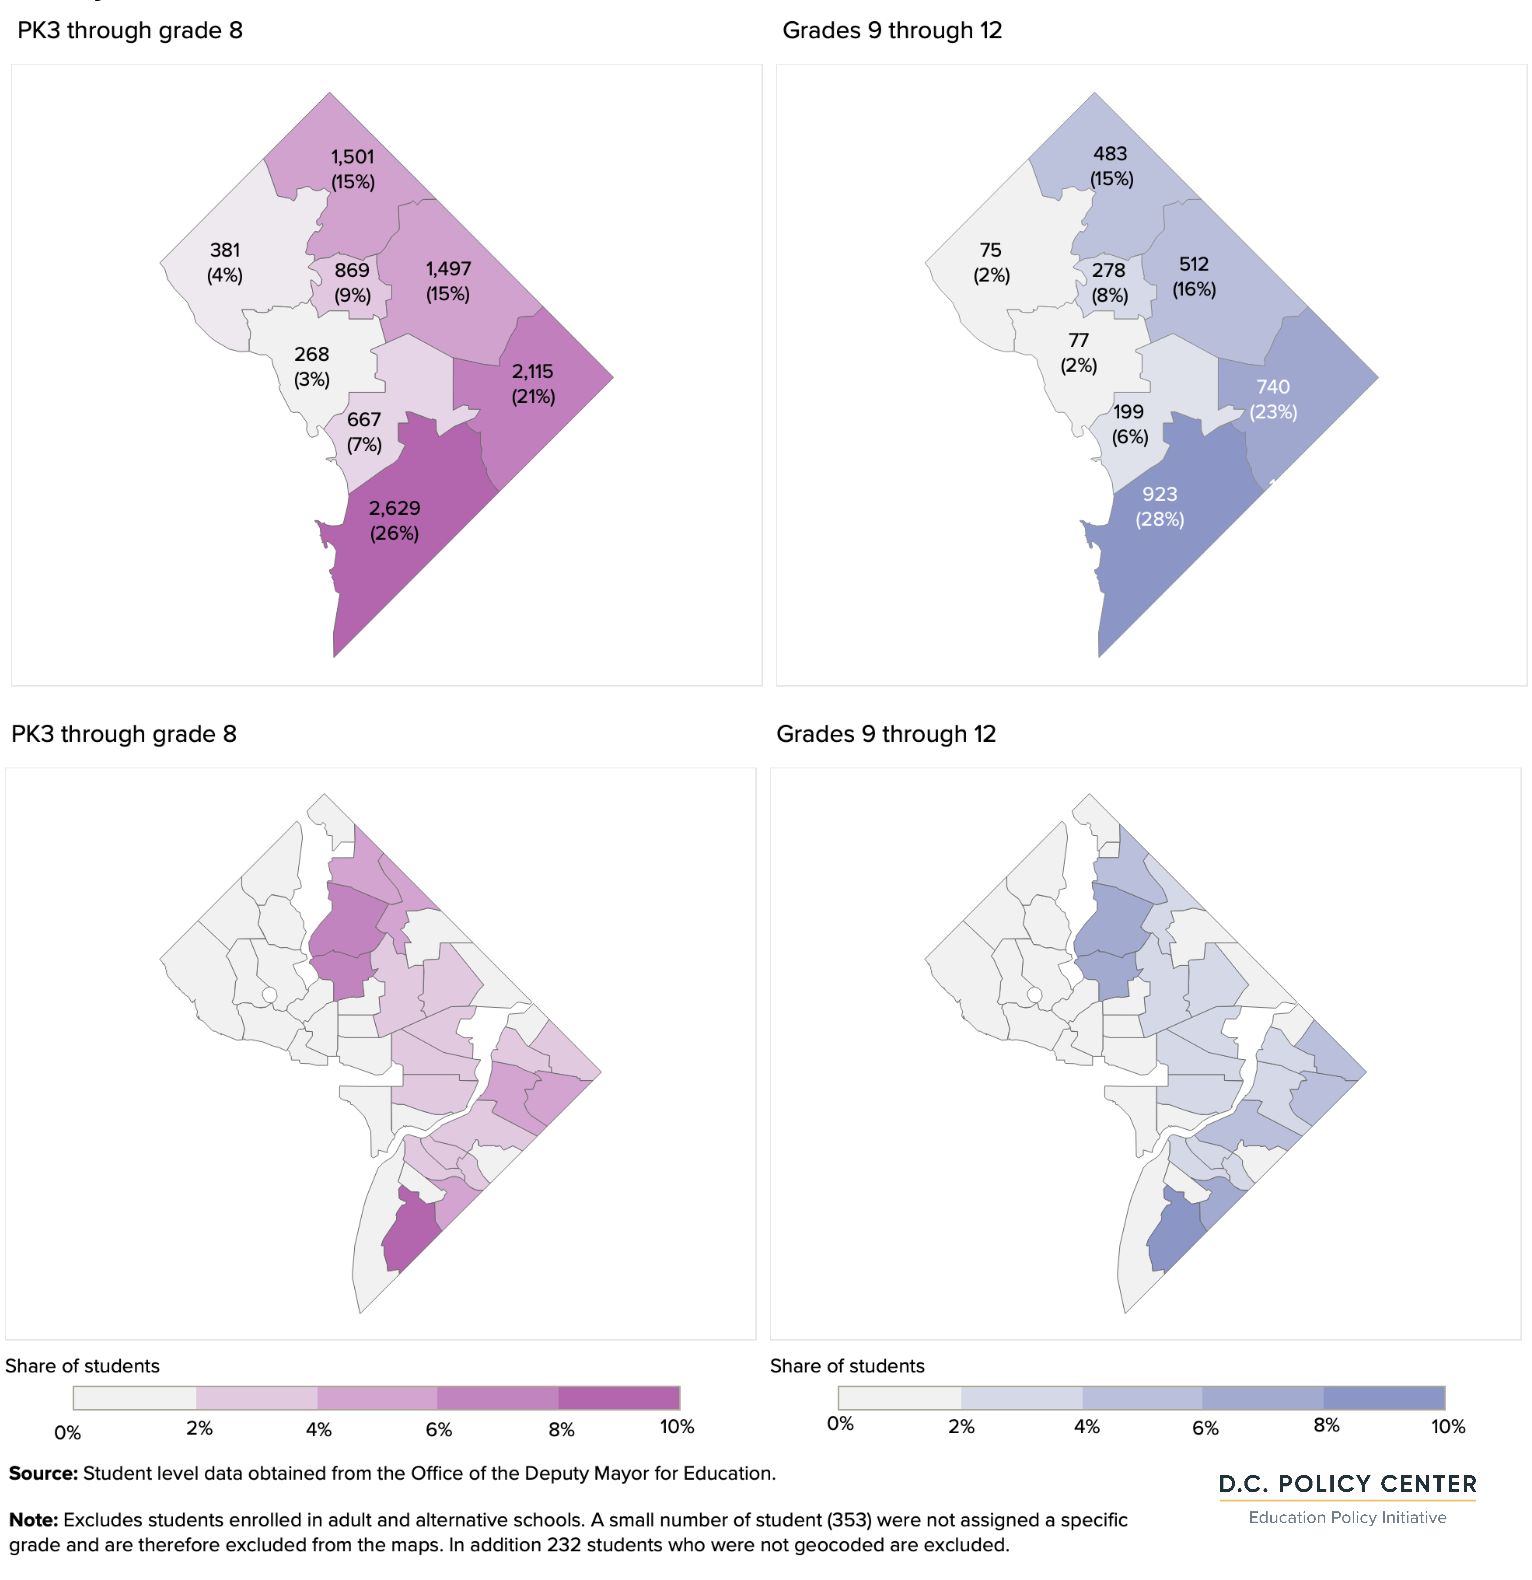
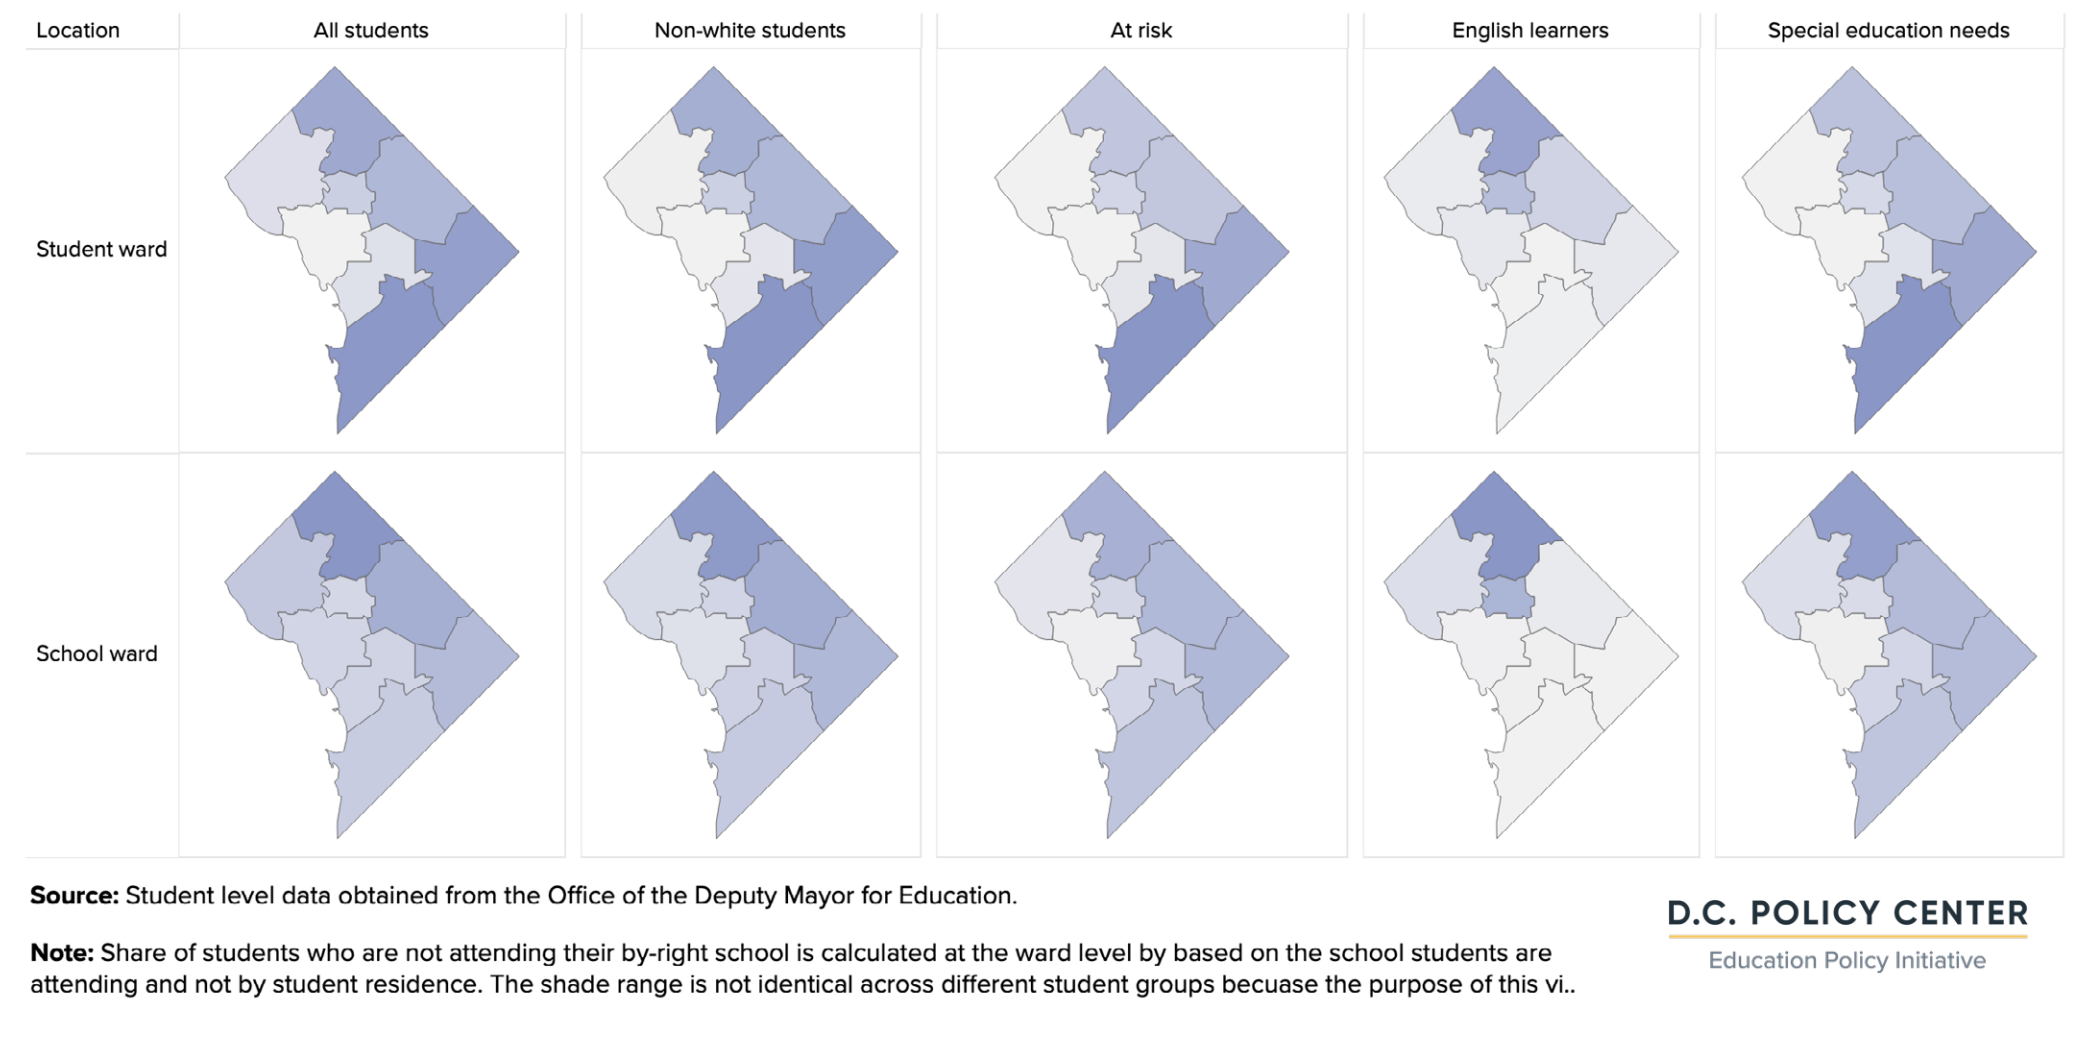
Public school students by ward and neighborhood of residence, school year 2021-22
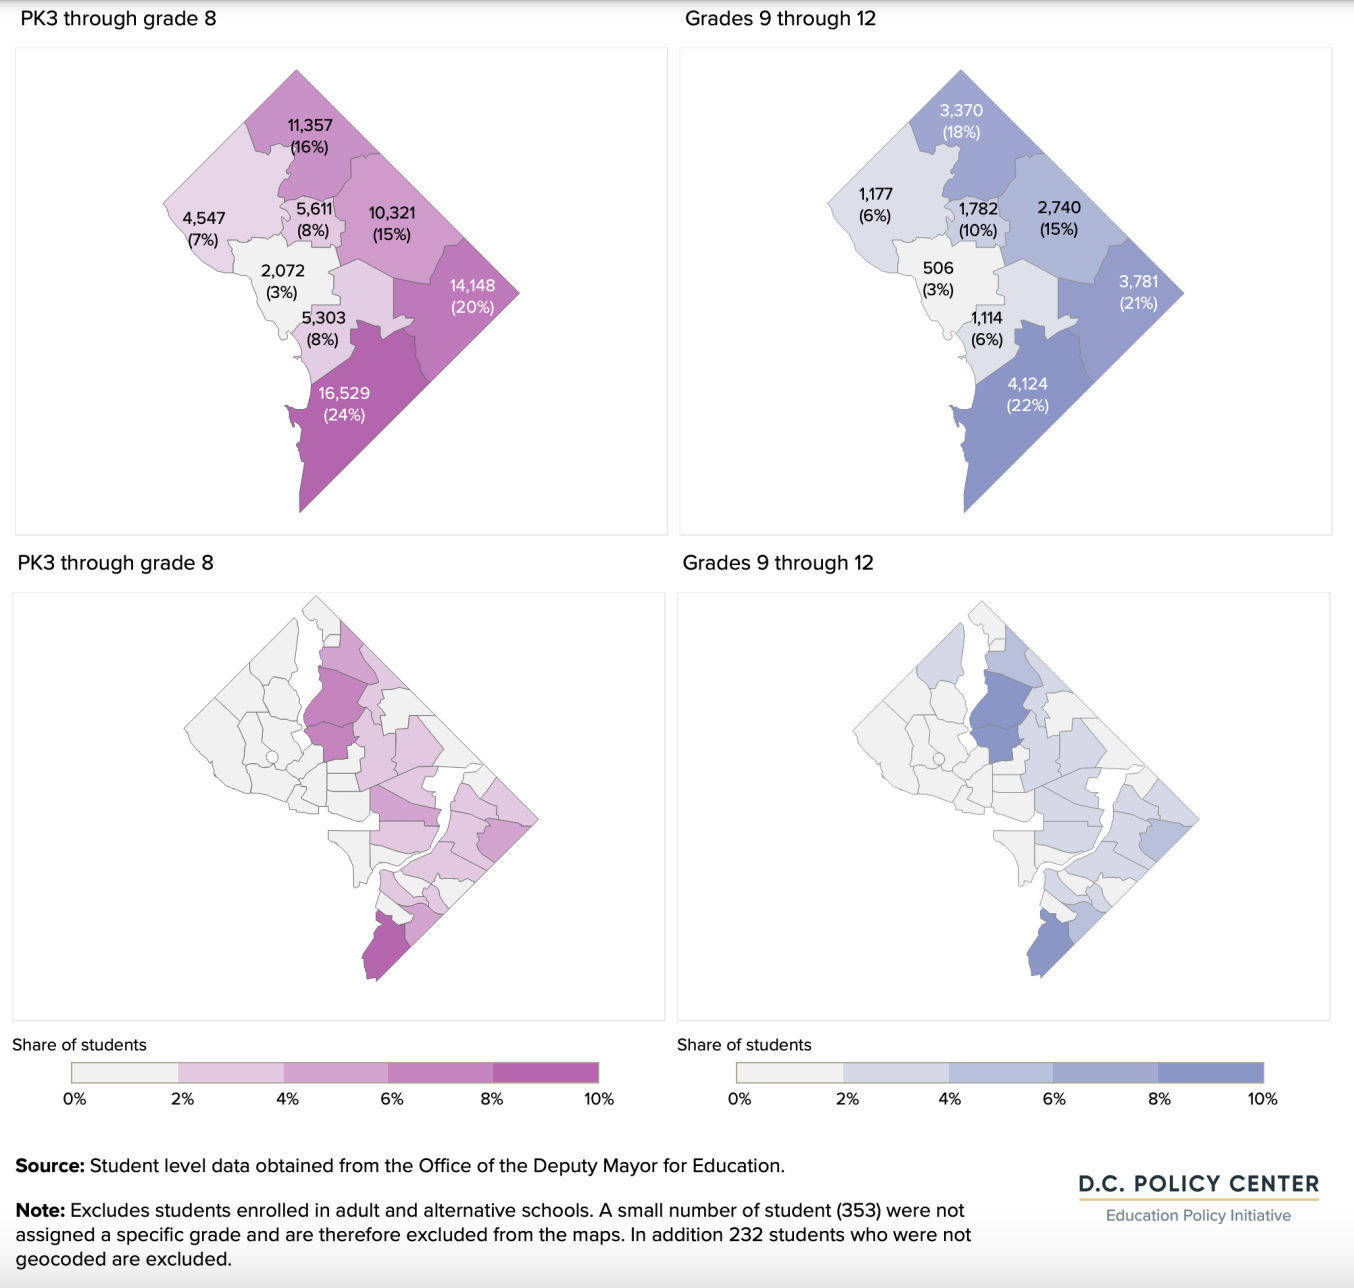
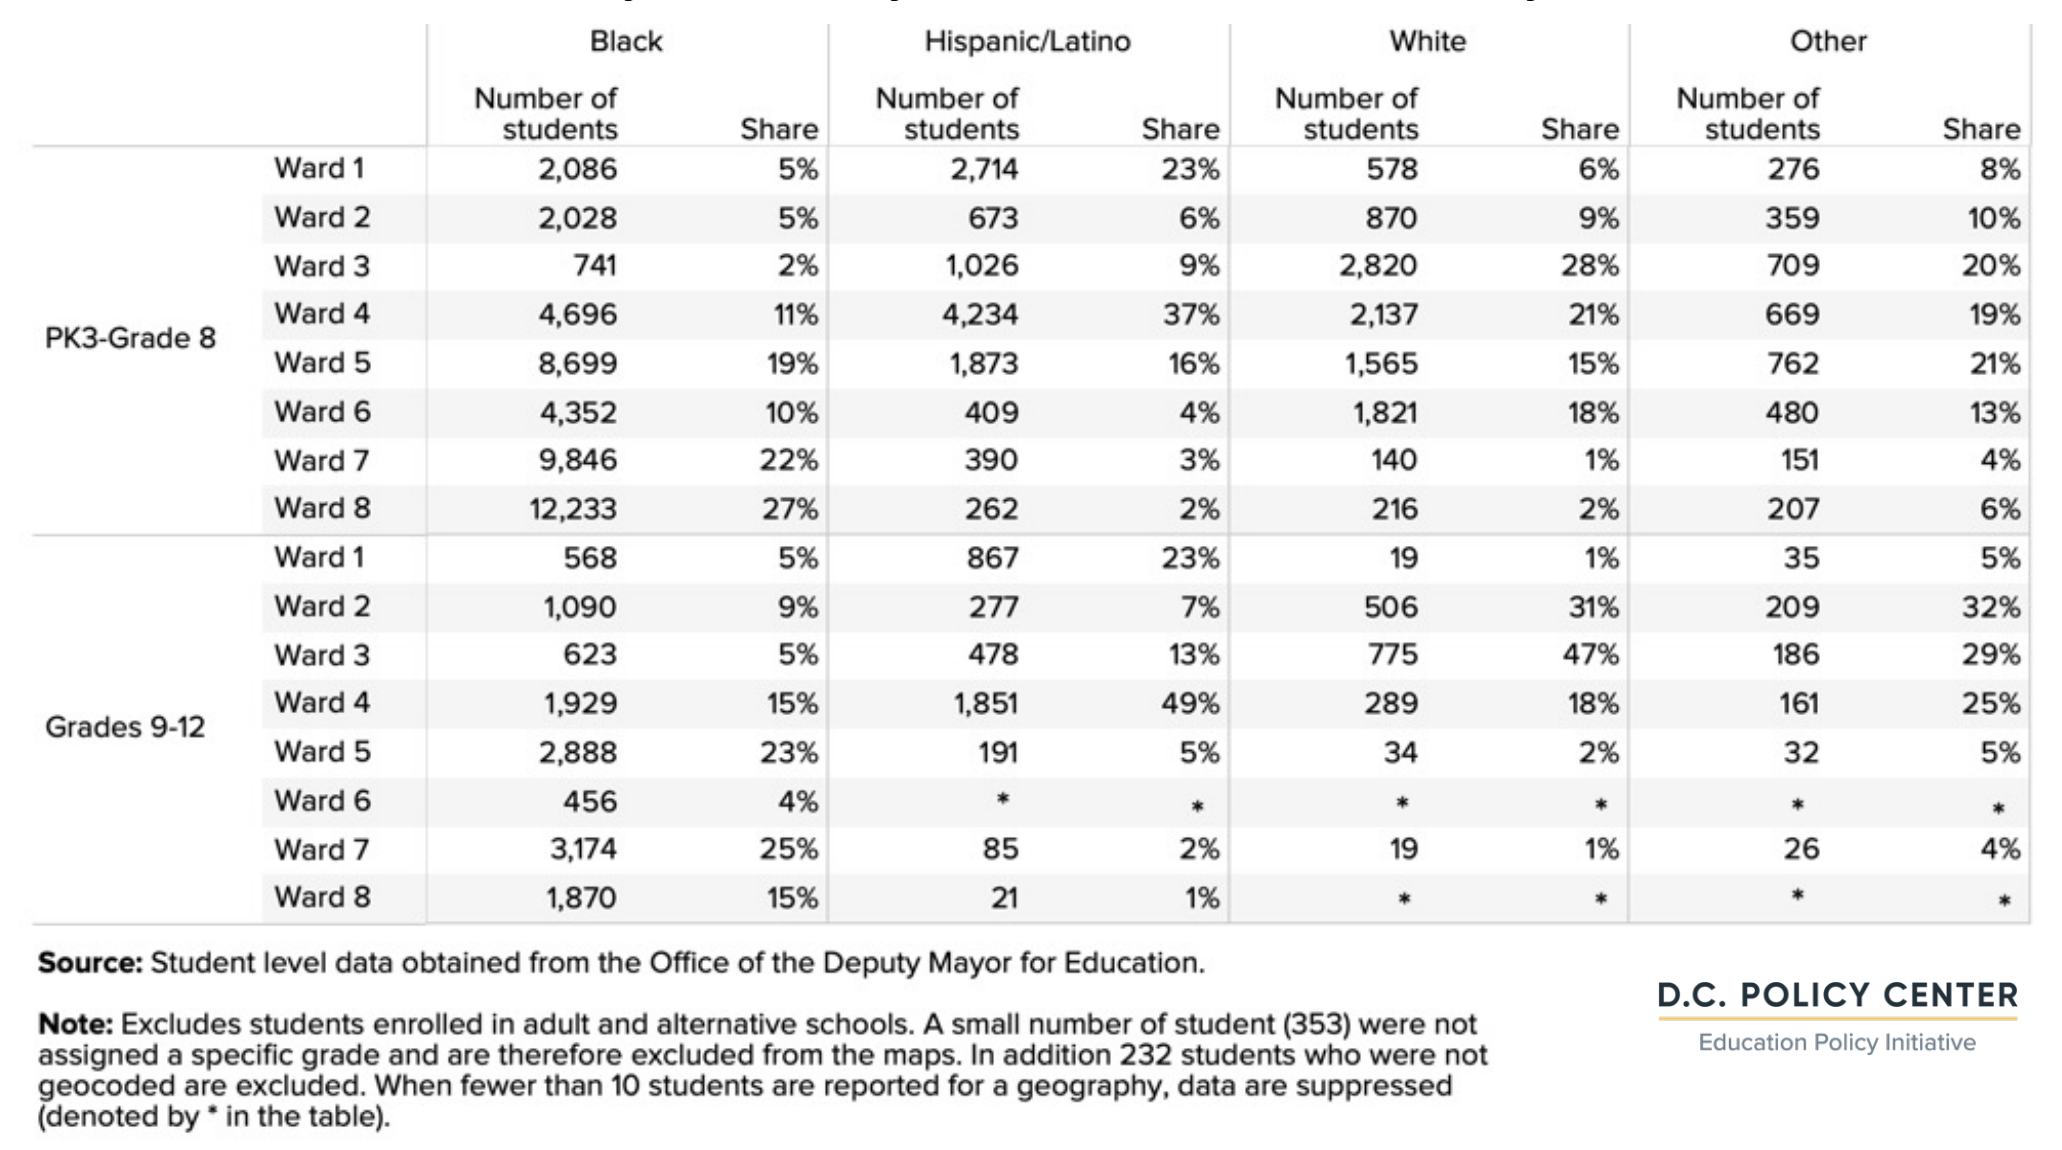
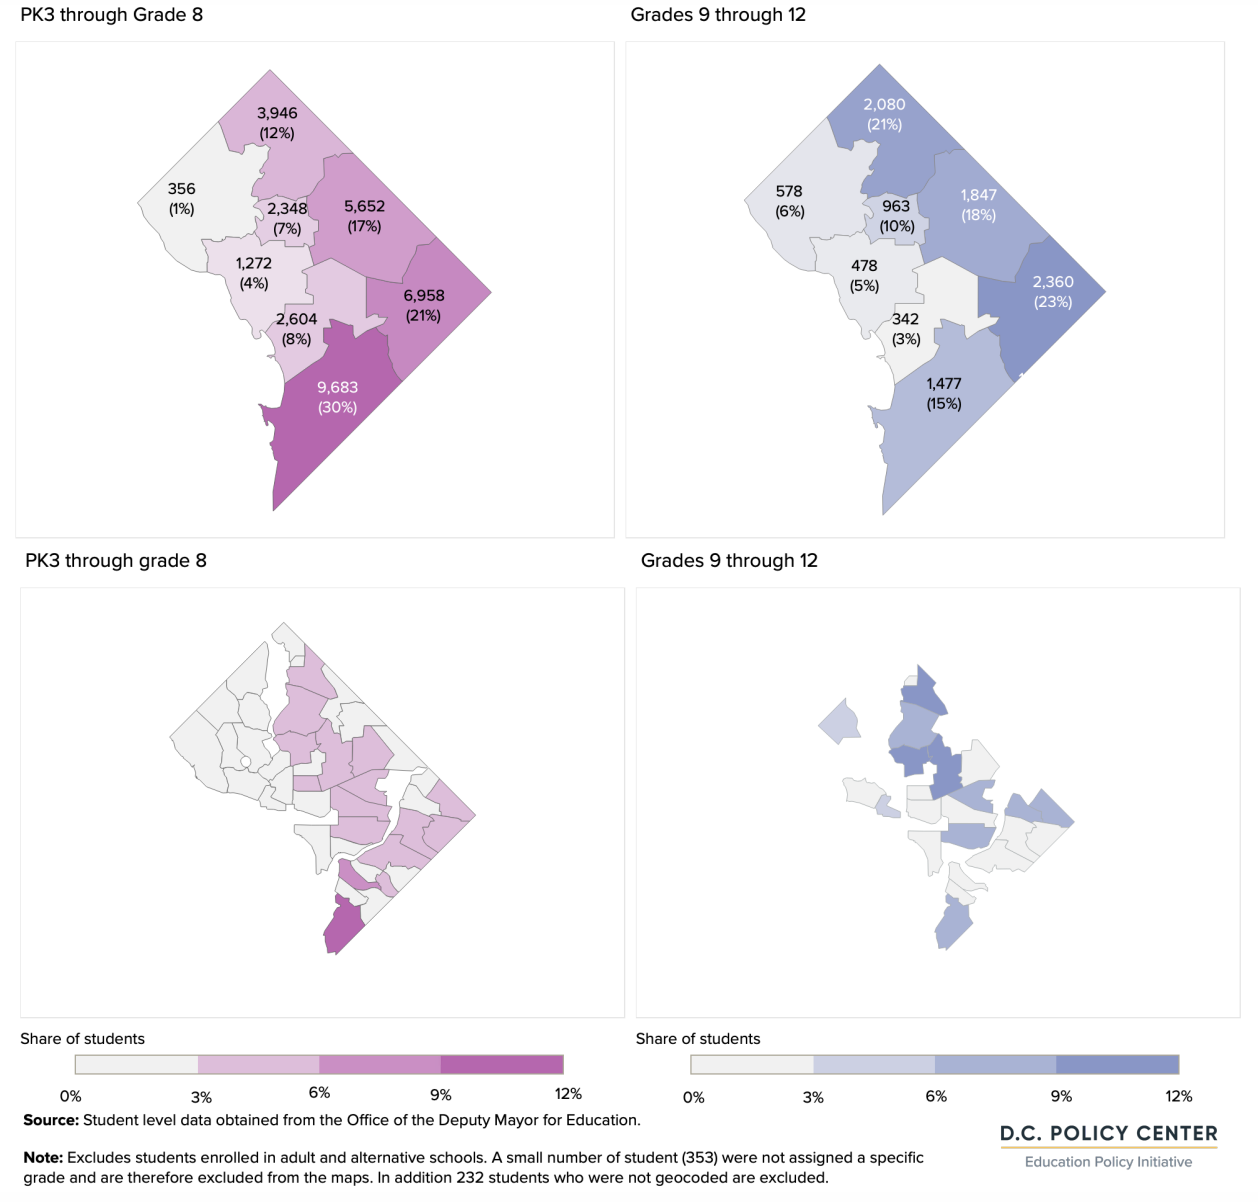
In school year 2021-22, Wards 7 and 8 were home to 44 percent of elementary and middle school students and 43 percent of high school students. Wards 4 and 5 followed, with 31 percent of elementary and middle school students, and 33 percent of high schoolers. Only about 3 percent of students live in Ward 2 (which is about the same as the share of school aged children who live in this Ward).7 Ward 3 is home to 6 percent of students while Ward 6 holds 7 percent. In both of these wards, private school participation is relatively high (an estimated 49 percent in Ward 3, and 38 percent in Ward 6).
Maps drawn with the same information at the neighborhood cluster level show that public school students live is even more concentrated that ward level maps reveal. For example, nearly a quarter of public school students live in three neighborhood clusters and are home to about more than seven percent of public school students.8 Three others each hold five to seven percent of students.9 In contrast, in 25 out of the 39 residential neighborhood clusters, mostly concentrated in the western half of the city, only about 2 percent of public school students live. These clusters are generally parts of the city that look suburban, dominated by single family homes located in large lots.
Race and ethnicity
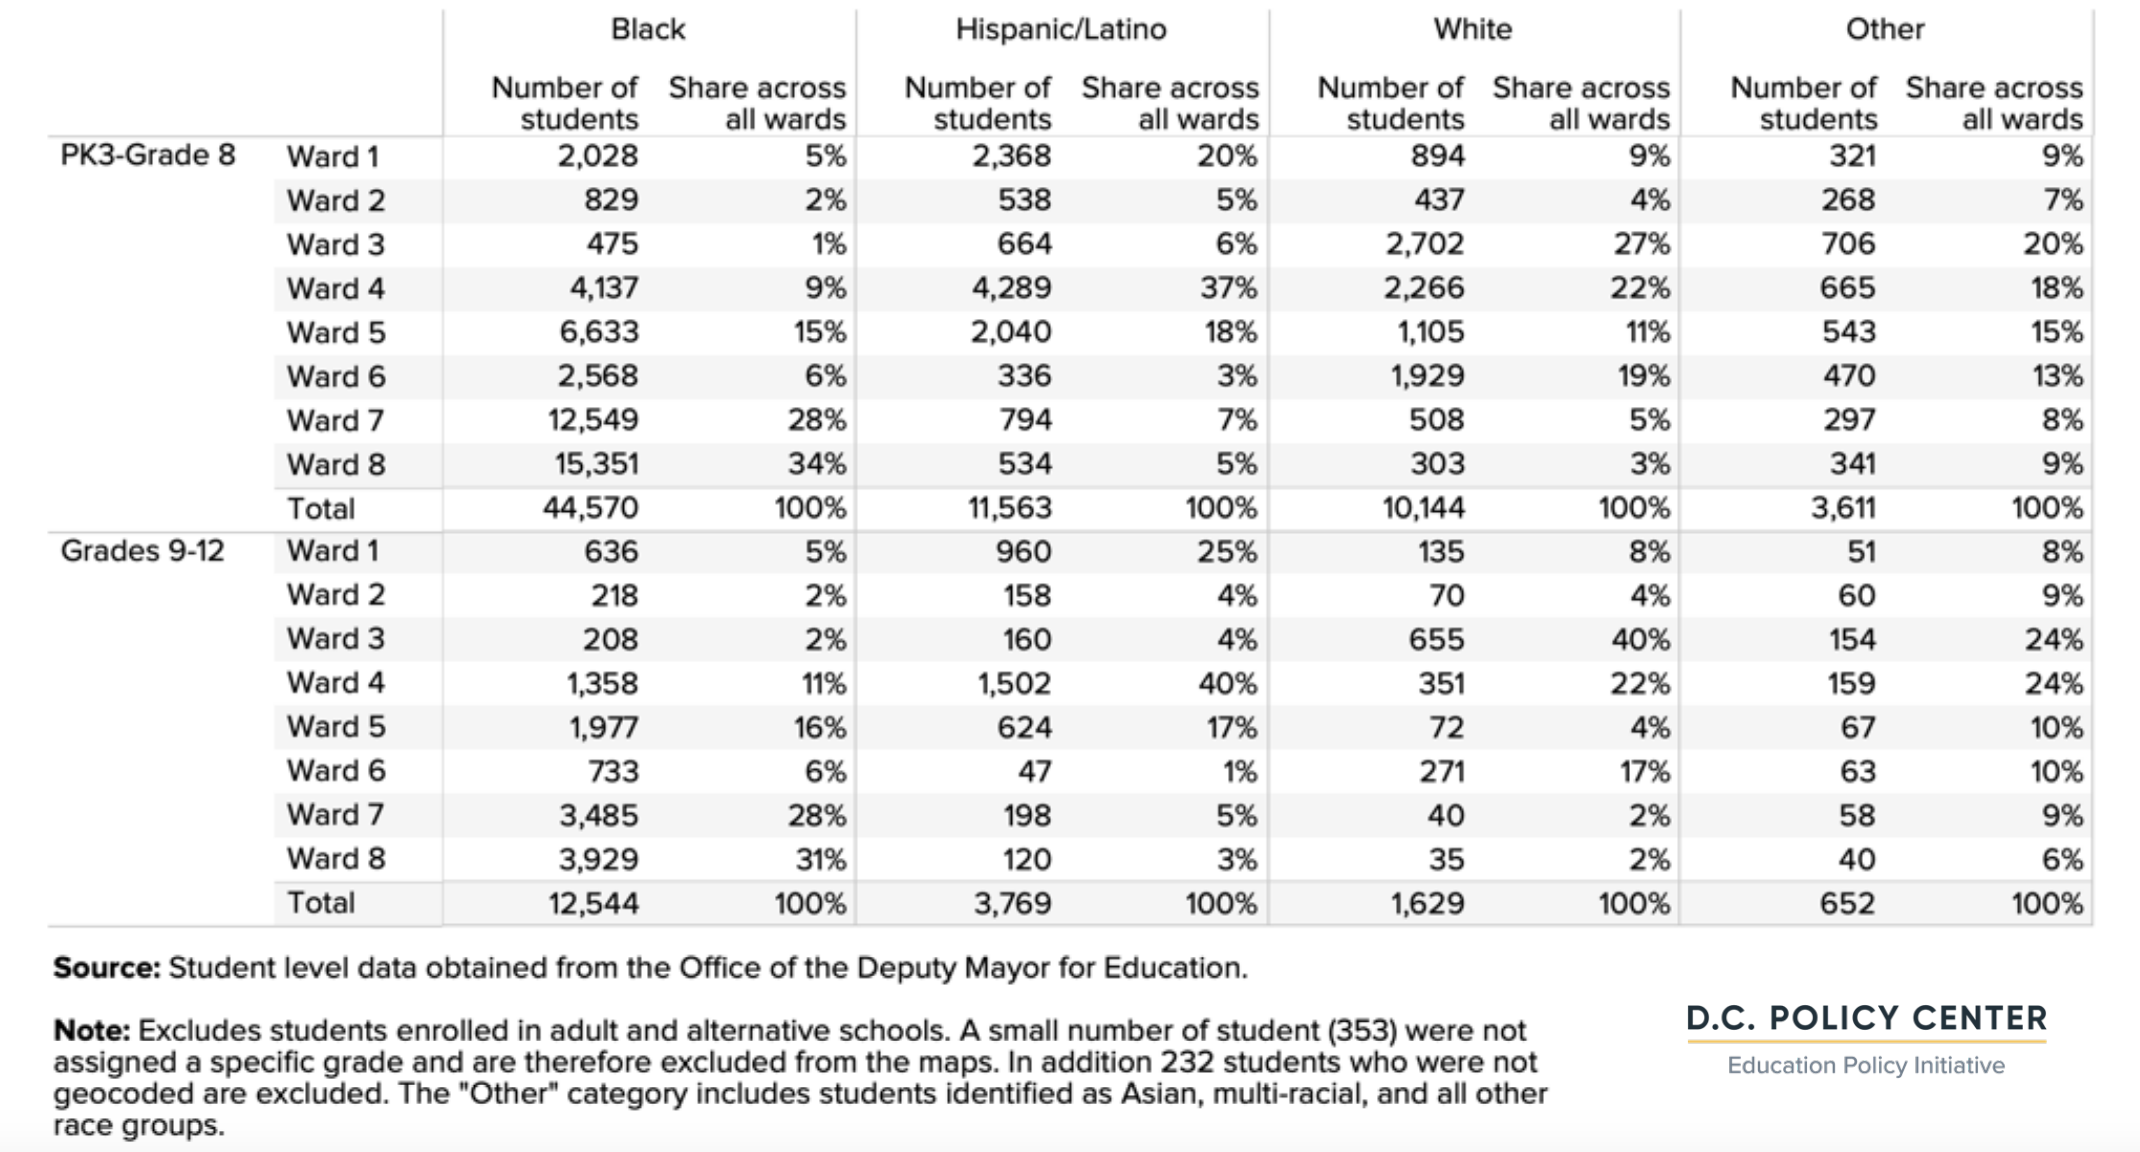
Broken down by race and ethnicity, 64 percent of public elementary and middle school students and
67 percent of high school students are Black, and the majority of these students live in Wards 7 or 8. (60
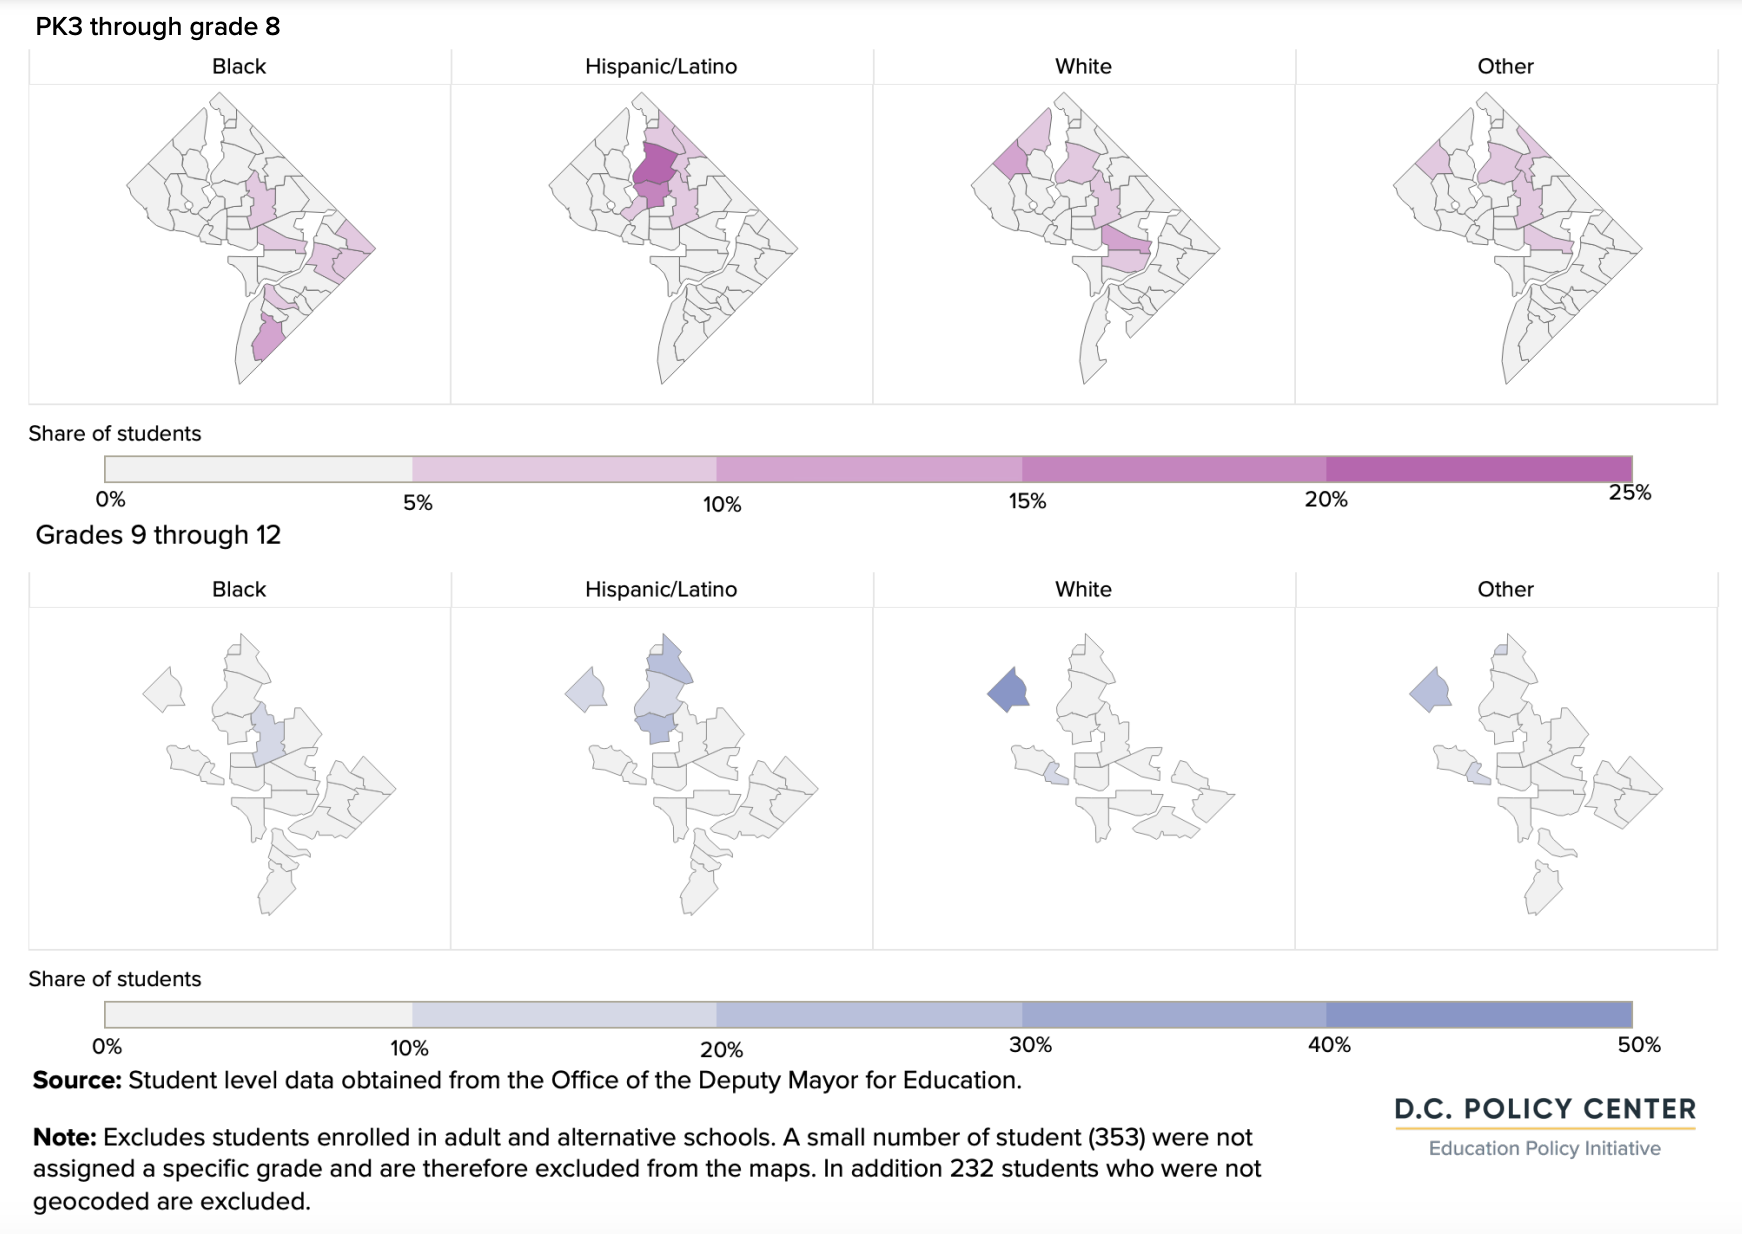
percent of public school students who are Black live in one of these wards.) In contrast, Wards 2, 3, and 6 collectively account for only 13 percent of Black public school students. Hispanic or Latino students make up the second largest group, and account for about 17 percent of public school students. They are most concentrated in Wards 1, 3, and 5. White students make up about 13 percent of the public student body, and are concentrated in Wards 3, 4, and 6.
Public school students by race/ethnicity and residence of ward, school year 2021-22
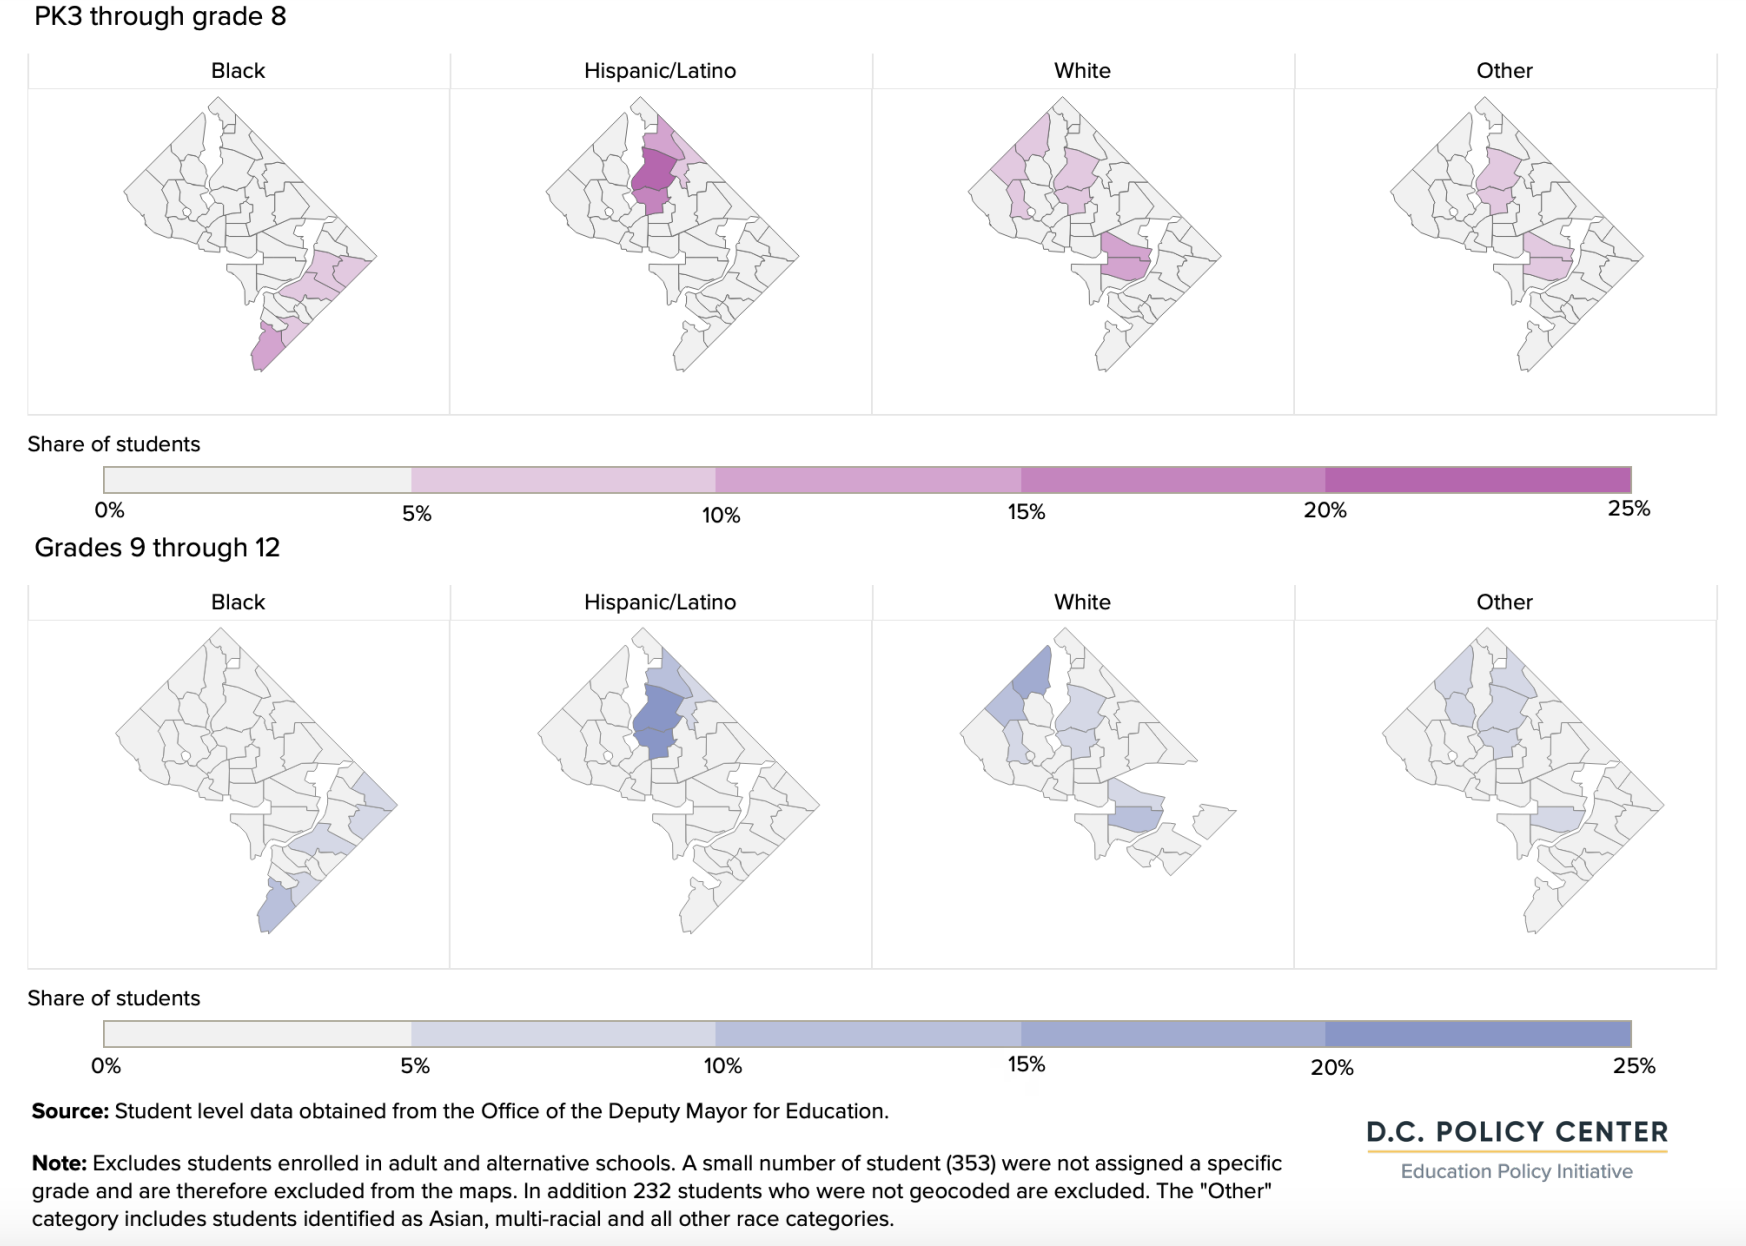
Mapping where students live at the neighborhood cluster level more clearly captures the degree of
housing segregation across the city. There are only two neighborhoods that hold a significant share of students from different races and ethnicities (but not Black students): the Columbia Heights, Mt. Pleasant, Pleasant Plains, Park View cluster in Ward 1, and the Brightwood Park, Crestwood, Petworth cluster in Ward 4. Black students are concentrated in five neighborhoods in Wards 7 and 8, and white students are concentrated in three neighborhoods in Ward 3, in addition to Columbia Heights, Brightwood, Petworth, and neighborhoods around Capitol Hill.
D.C. public school students by race and ethnicity, and neighborhood of their residence, school year 2021-22
At-risk status
Students who receive the statutory “at-risk” designation for funding purposes include those who are
experiencing homelessness, in the foster care system, qualify for TANF or SNAP programs, and over-age high school students.
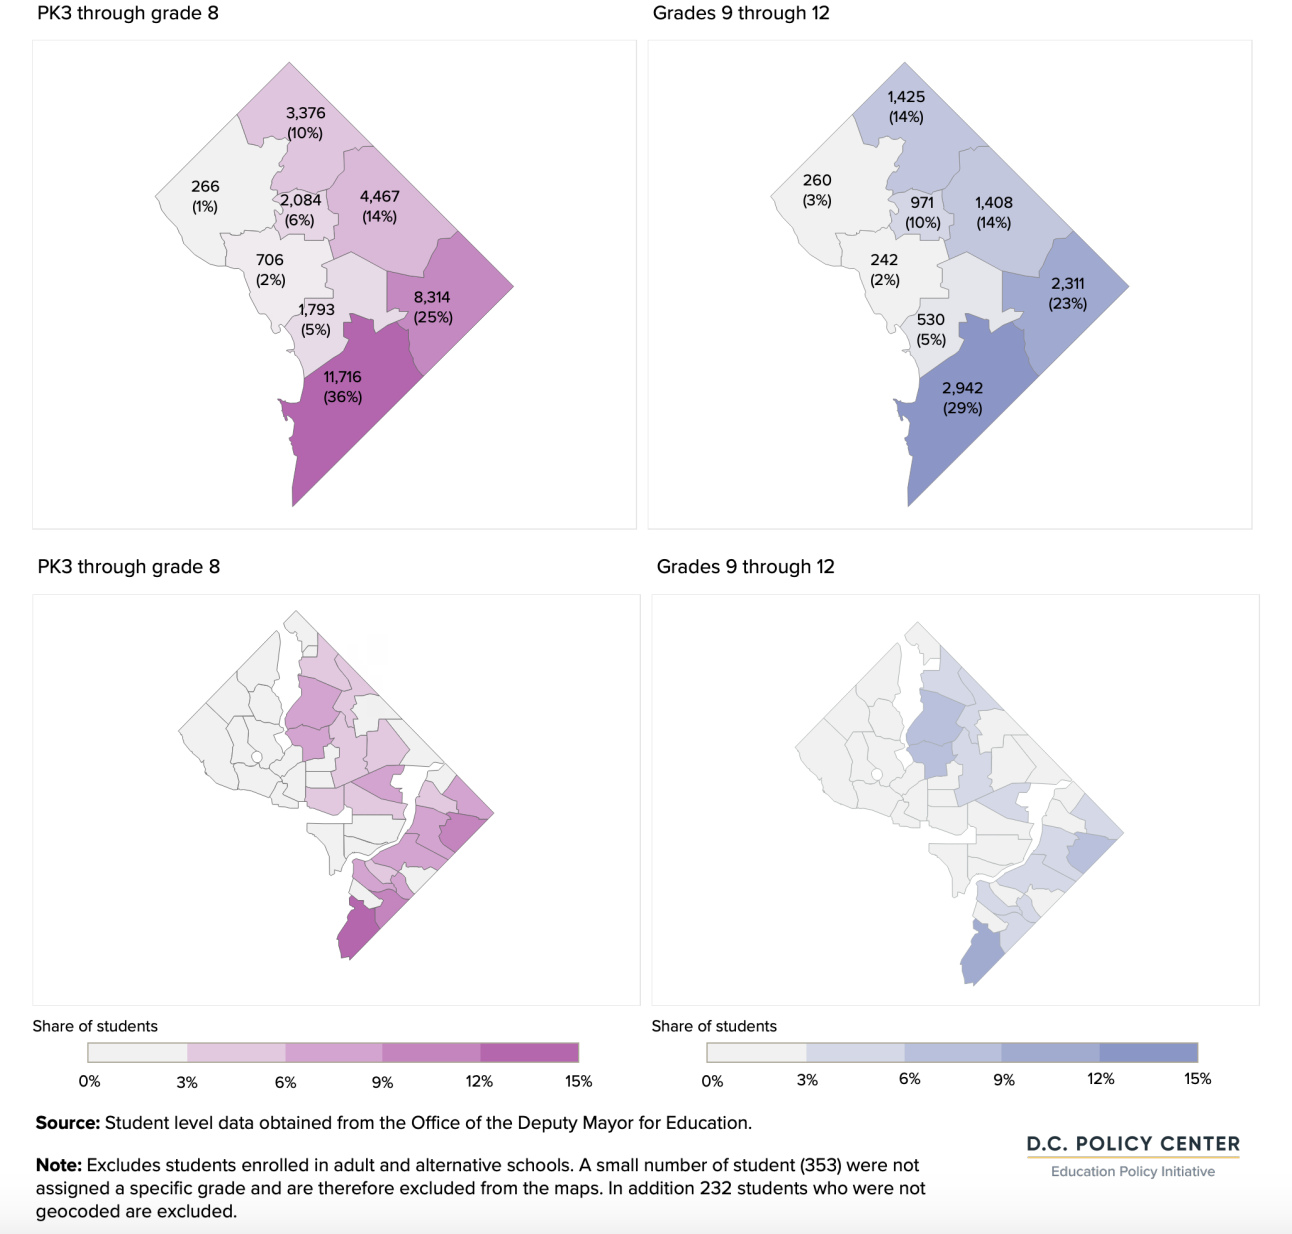
In the District, 47 percent of students who attend elementary or middle schools (32,722 students) are designated as at-risk. Given this significant share, the residential distribution of at-risk students mostly
resembles the distribution of the entire public student body. However, because of how at-risk is defined,
students in this category are even more concentrated in lower-income parts of the District of Columbia, in Wards 7 and 8.
Ward 8, for example, is home to 24 percent of the students enrolled at an elementary or secondary
school, but 36 percent of the at-risk students enrolled at the same level. In contrast, Ward 3 holds 7 percent of students enrolled at an elementary or secondary school, but only one percent of at-risk students at this level. At the neighborhood level, Congress Heights, Bellevue, Washington Highlands cluster is home to 14 percent of at-risk students attending elementary or middle school. This is twice the share in the next highest-concentration neighborhood (the neighboring Douglas, Shipley Terrace cluster, which holds 7.3 percent of at-risk students at this band).
D.C. public school students designated as at-risk by ward and neighborhood of residence, school year 2021-22
Students with special education needs
During school year 2021-22, 13,214 students across all grade bands (or 15 percent of public school students) were identified as students with special education needs. Of these students, 9,927 (three quarters of all students with special education needs) were enrolled at an elementary or middle school, and 3,287 were enrolled at a high school. The distribution of students with special education needs across wards and neighborhoods resembles the overall student distribution, with Wards 7 and 8 holding a significantly higher concentration of students with special education needs compared to the entire public school student body.
D.C. public school students with special education needs, by ward and neighborhood of residence, school year 2021-22
English learners
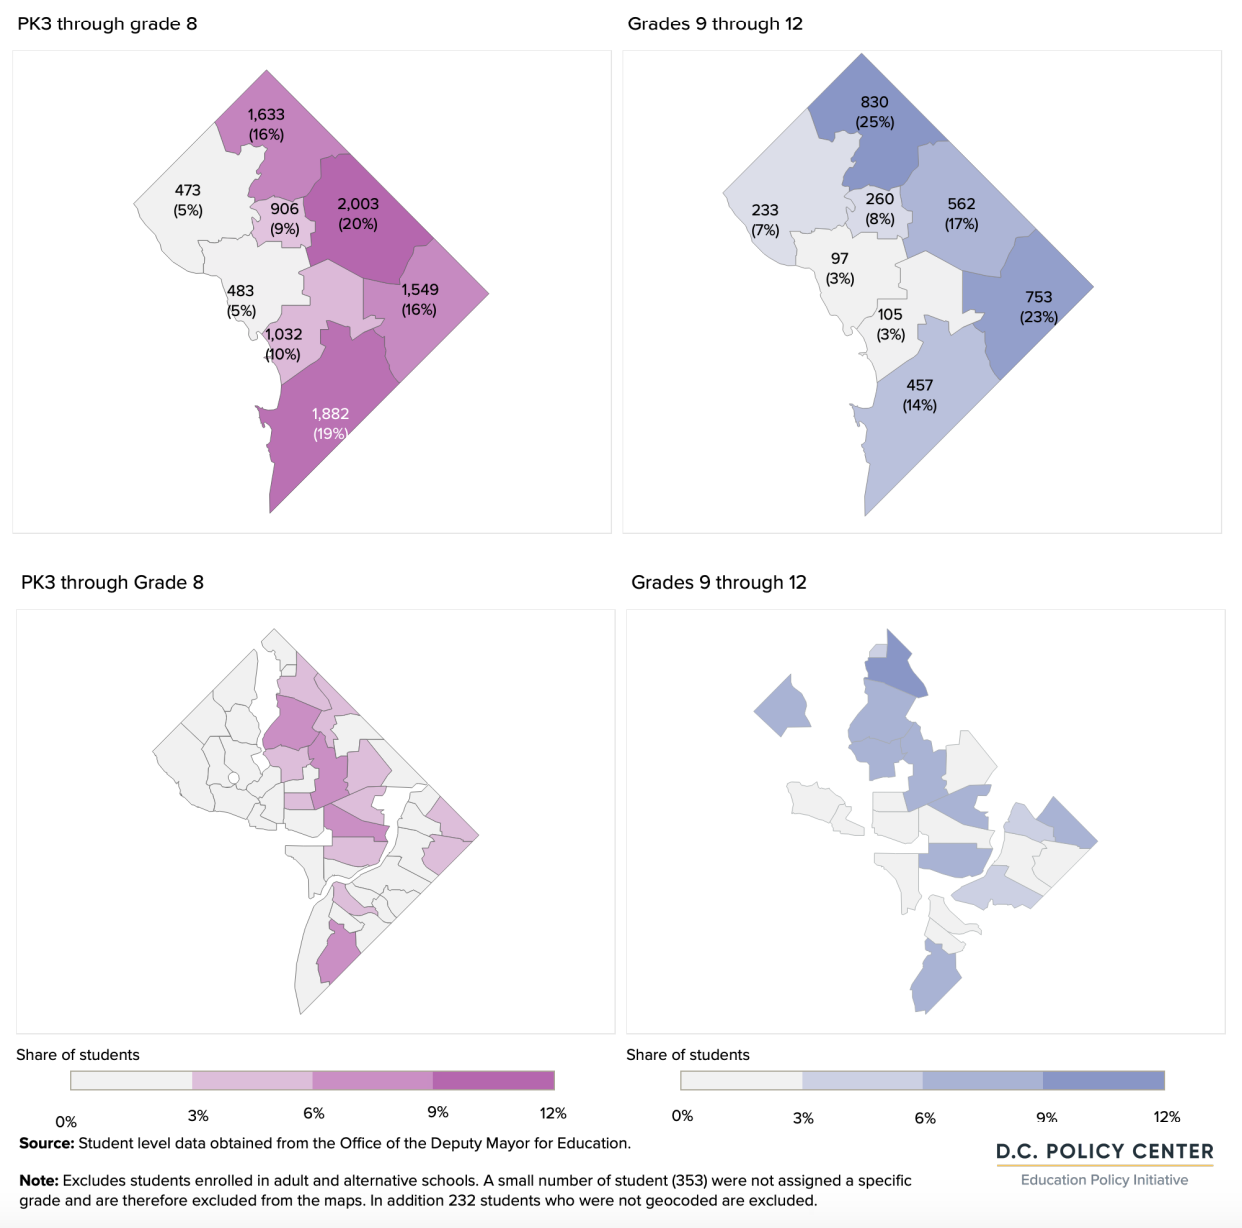
The 11,240 students who were identified as English learners made up about 13 percent of all public school students during school year 2021-22. These students were heavily concentrated at the elementary and middle school levels (85 percent of English learners are enrolled at the PK3 to grade 8 band). This is likely because students who enroll in D.C. public schools and public charter schools at early grades eventually exit out of the English learner status as they move to upper grades.
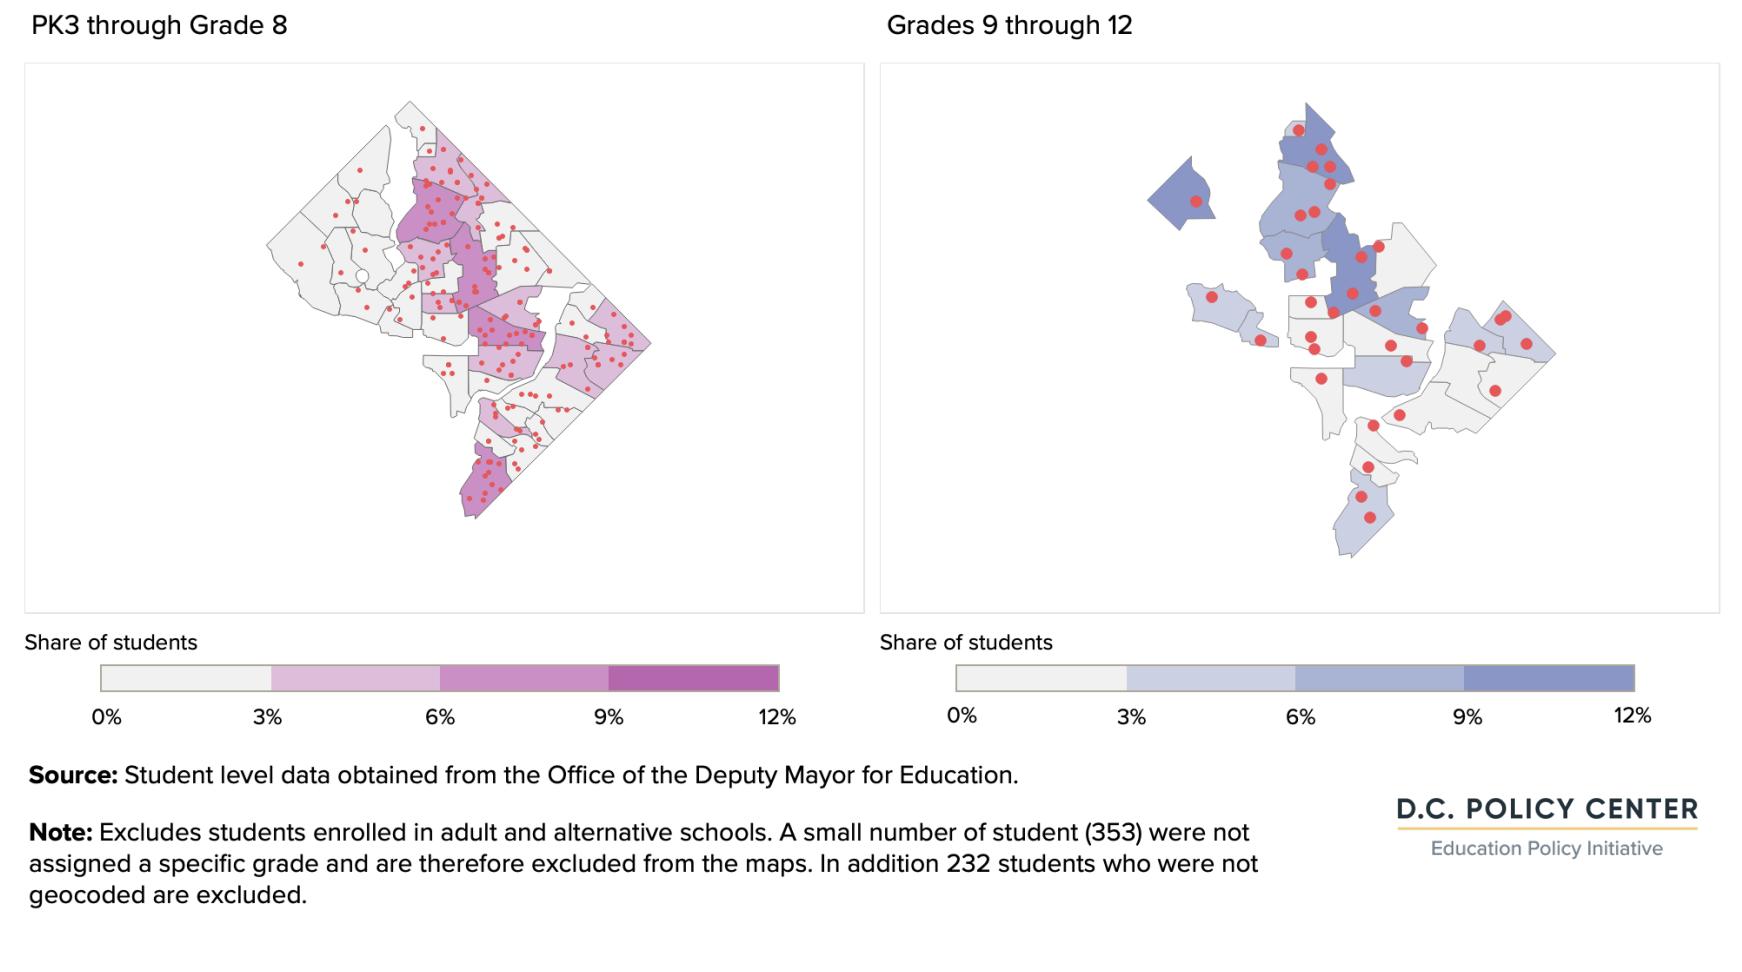
English learners, by ward and neighborhood of residence, school year 2021-22
The geographic distribution of English learners is unique, with these students heavily concentrated in three wards (Wards 1, 4, and 5) and especially in three adjoining neighborhoods. Ward 4 alone is home to over 40 percent of English learners, and the three neighborhoods that begin at Takoma in the northeastern border of the city and span through Columbia Heights in the south collectively account for over 60 percent of English learners who attend public schools in the District.
Public school students by the location of their school
For OST programs, where students attend school matters as much as where students live. This is
especially true for afterschool programs at earlier grades since programs located at the students’ school
(or within an easy and safe walking distance of a school) might be the most convenient options.
School and attendance characteristics by ward, school year 2021-22
In the District of Columbia, where students attend school looks very different from where they live. This is the case for a number of related reasons:
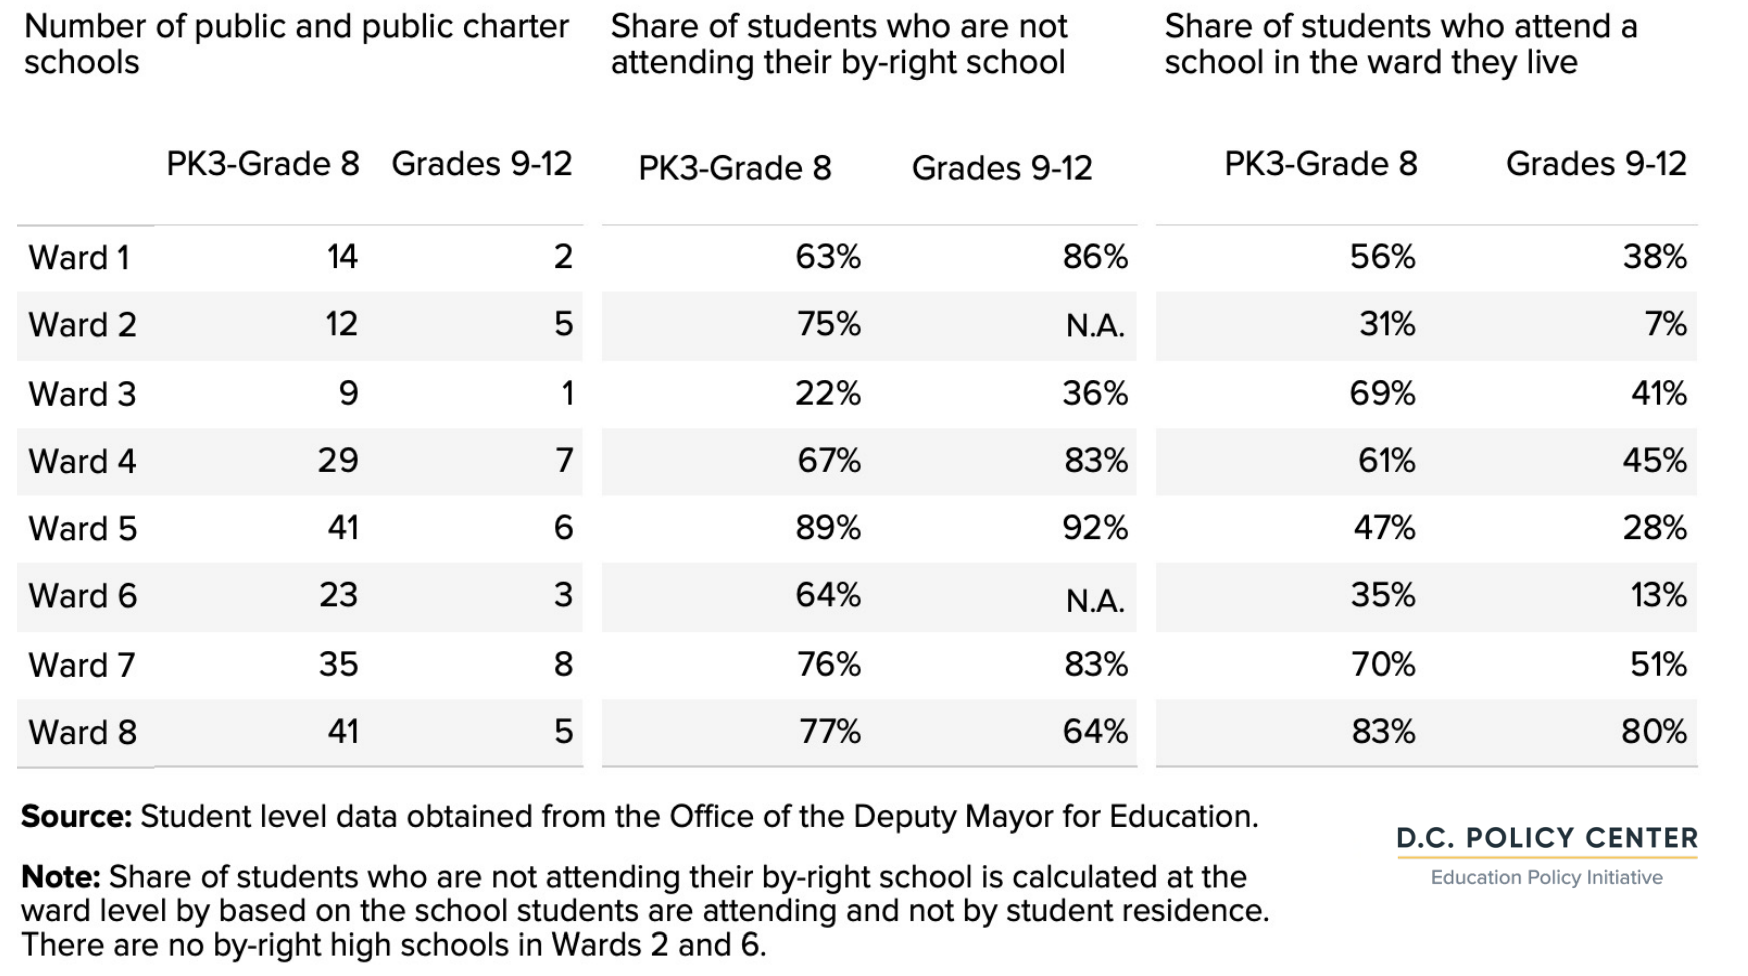
- First, many public schools accept students from all wards and neighborhoods: fewer than half of D.C. public schools and public charter schools—98 out of 249 — are by-right schools, with seats guaranteed for students who live in a boundary area.10
- Second, only 28 percent of public school students attend their in-boundary by-right school; 46 percent attend charter schools, and 27 percent attend city-wide DCPS schools or a DCPS school other than their by-right school. There are no byright high schools in Wards 2 and 6.
- Third, schools that accept out-of-boundary students (charters and citywide schools) are not distributed evenly across the city. Wards 1, 2, and 3 have relatively fewer schools, whereas Ward 5 has 42 elementary and middle schools, and Ward 7 has 8 middle schools. This distribution reflects the availability of school facilities, which is an important factor for charter schools.
- Finally, the presence of charter and city-wide DCPS schools bring to a ward or neighborhood a lot of students from other parts of the city. Across Ward 5 high schools, for example, 92 percent of students are attending a school other than their by-right school, although only 28 percent live in Ward 5. In contrast, across all schools located in Ward 8, 64 percent of all high school students are are enrolled in a school other than their by-right school, but 80 percent of students also live in Ward 8.
These varying distances between where students live and where students attend school is an important
consideration for OST programs.
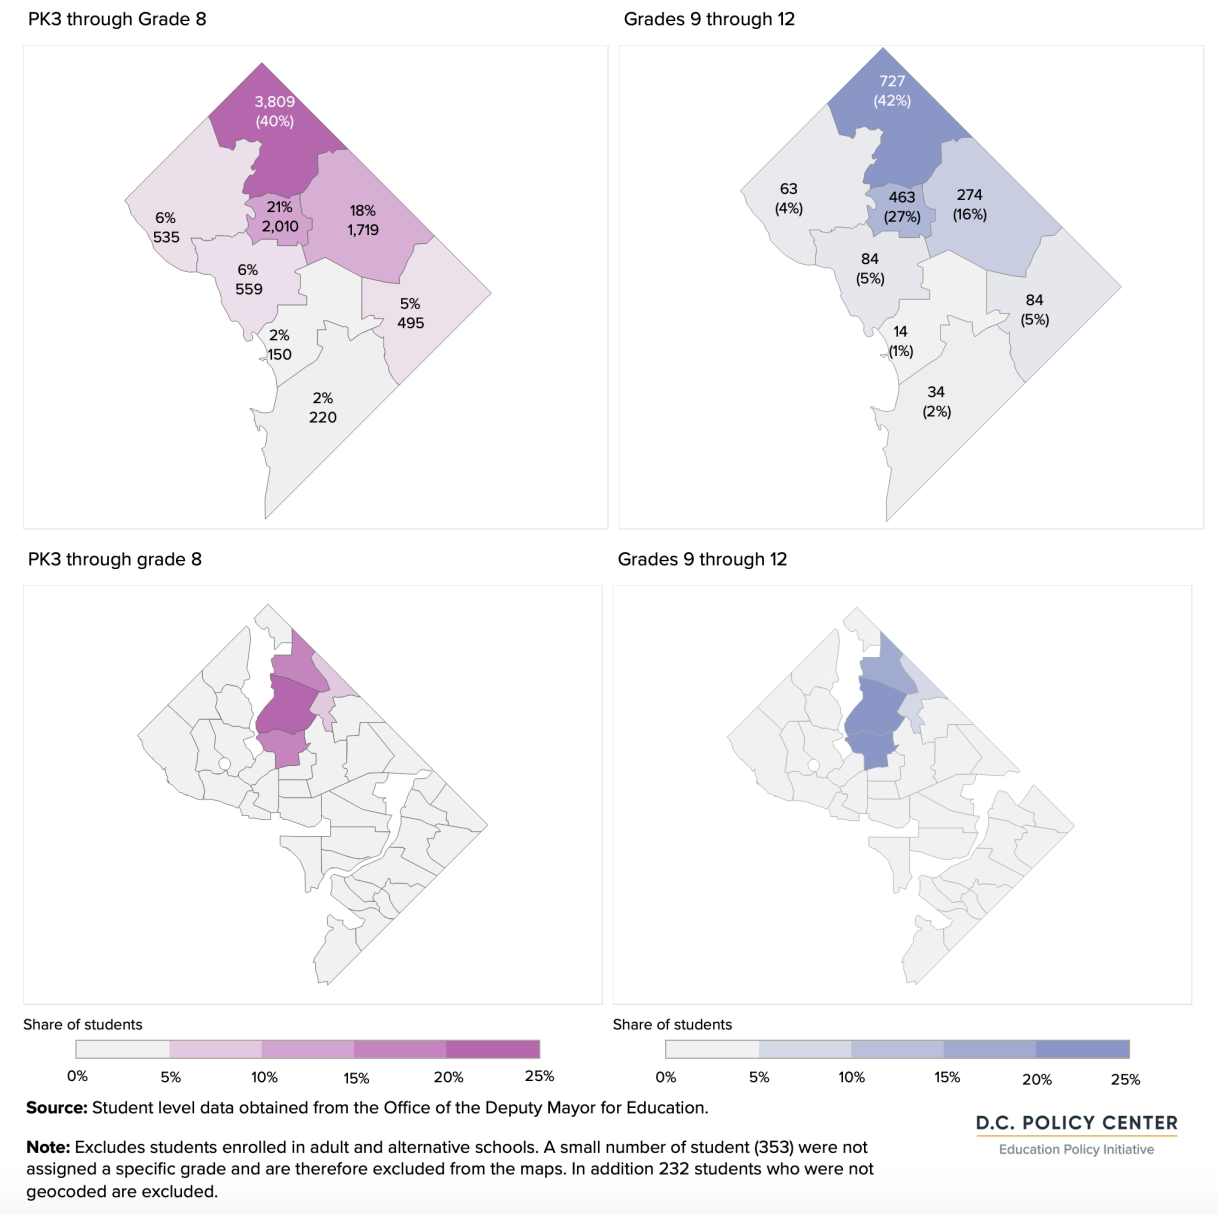
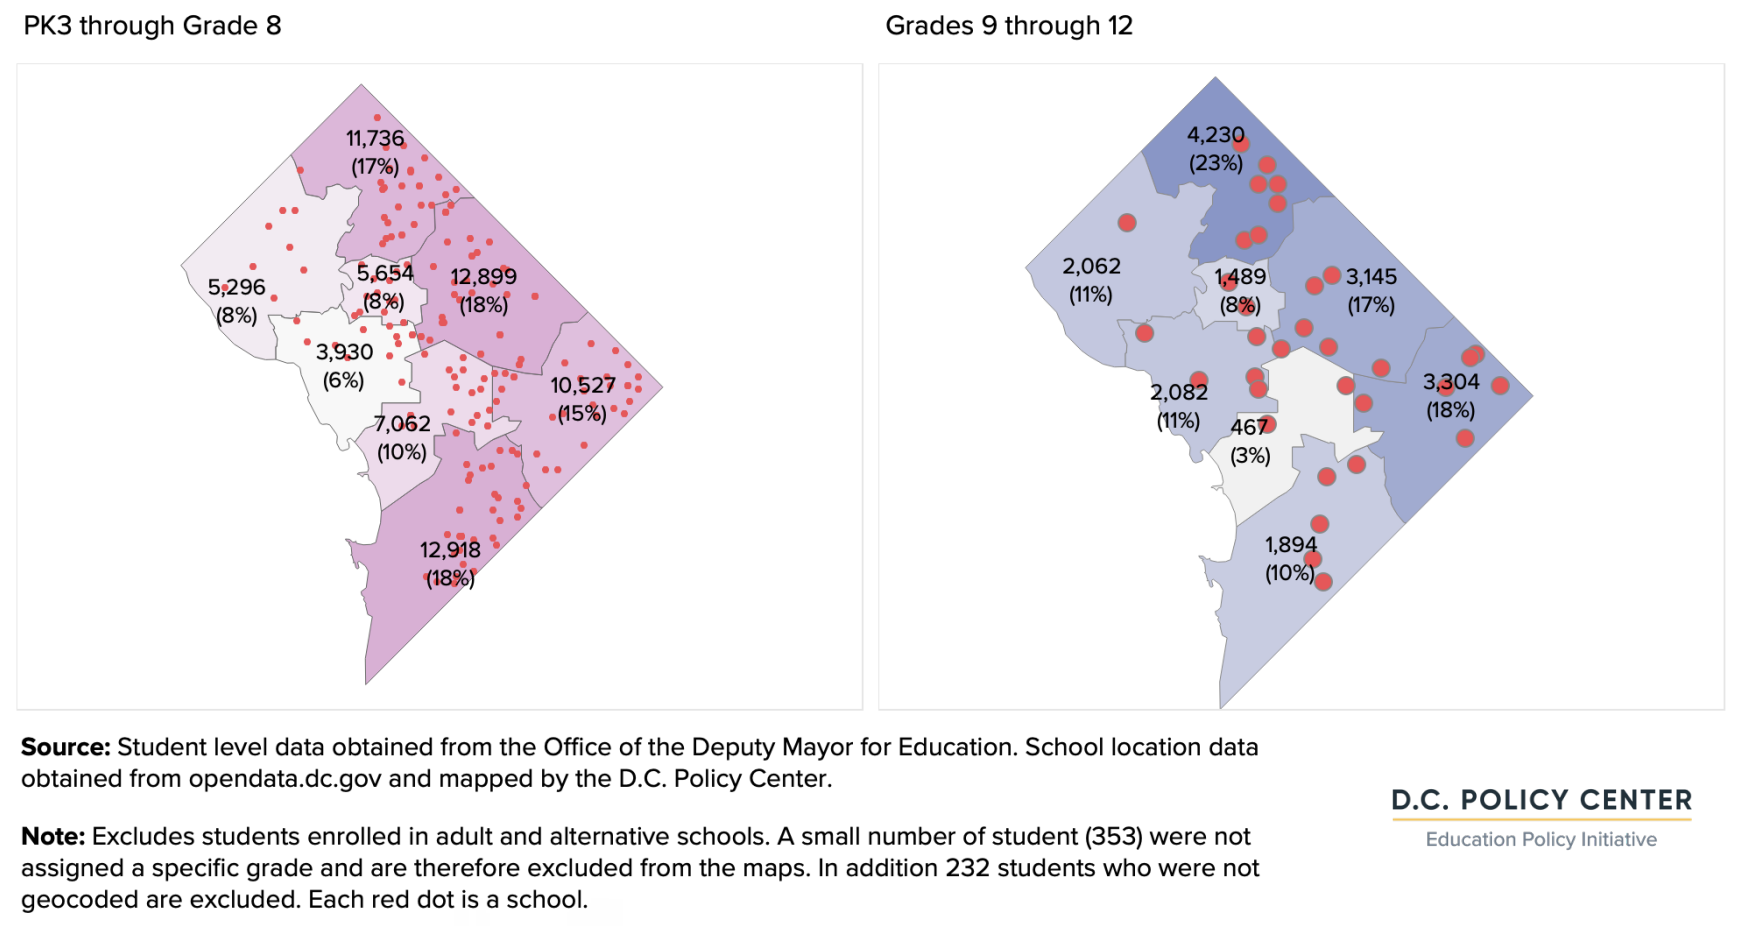
The ward and neighborhood cluster level maps of where students attend school look different from where students live. The largest share of elementary and middle school students attend public schools
located in Wards 5 and 8 (18 percent), followed by Ward 4 (17%). At the high school level, schools located in Ward 4 enroll the largest share of students followed by Ward 5. Wards 7 and 8 stand out because a large share of students who live in these wards attend a school outside of their ward of residence. Ward 8 is home to 27 percent of public school students attending high school, but Ward 8 schools enroll only 10 percent of public school students at this grade band.
Distribution of public school students across wards, by ward of the school they attend, school year 2021-22
Distribution of public school students by the neighborhood of the school they attend, school year 2021-22
At the neighborhood level, student school locations are even more concentrated than where students live. The Edgewood, Bloomingdale, Truxton Circle, Eckington cluster alone holds eleven elementary or middle charter schools, and two DCPS schools including a city-wide middle school. The Tenleytown, Friendship Heights, AU Park in west of Rock Creek Park, cluster also lights up on the map because it is the home to Jackson-Reed High School, the largest high school in the city with over 2,000 students.
Race and ethnicity
Breakdown of students by the ward of their school show that wards could be more diverse in terms of
the race and ethnicity of students who attend school within their boundaries relative to the race and ethnicity of students who live there. But that is largely because many Black students who live in Wards 7 and 8 attend school somewhere outside these two wards.
Public school students by race/ethnicity and ward of their school, school year 2021-22
For example, 34 percent of Black elementary and middle school students live in Ward 8, but 27 percent
attend school there. More Hispanic or Latino students attend high school in Ward 4 (49 percent) compared to those who live there (40 percent). And more white students attend school in Ward 3 compared to the white students who live in this ward. For example, 28 percent of white students who attend high school live in Ward 3, but 47 percent of the white students in the city attend high school in this ward.
These trends become even sharper at the neighborhood level. Twice as many Black elementary
and middle school students attend schools in the Edgewood cluster than those who live in these
neighborhoods; at high school level, this rate goes up to three times. And 12 percent of Black students who attend high school live in Congress Heights cluster, but only 7 percent attend school there. Compare this to the Friendship Heights, Tenleytown, AU Park cluster, which is home to 17 percent of white students attending high school—yet 47 percent of white students attend high school in this neighborhood.
D.C. public school students by race and ethnicity and neighborhood of the school they attend, school year 2021-22
At-risk status
As shown before, students who are designated as “at-risk” for funding purposes live predominantly in Wards 7 and 8 (61 percent of elementary and middle school students and 52 percent of high school students). Yet many of these students attend schools outside of their home wards. The share of at-risk students who attend schools in these two wards is 51 percent at the elementary and middle school level and 38 percent at the high school level. Ward 7 schools enroll the largest share of at-risk high school students, followed by Wards 1 and 5. And nearly 11 percent of elementary and middle school students designated as at risk attend school in the Congress Heights cluster (15 percent of such students live there).
D.C. public school students designated as at risk, by their school location, school year 2021-2022
Students with special education needs
Similar to the patterns seen with at-risk students, students with special education needs are most heavily concentrated in Wards 7 and 8 but attend school elsewhere in the city. These wards are home
to 47 percent of all elementary and middles school students and 51 percent of high school students with
special education needs. However, only 34 percent of elementary and middle school students with special education needs attend school in Wards 7 and 8, and this share is slightly higher—37 percent—among high school students.
D.C. public school students with special education needs, by ward and neighborhood of school location, school year 2021-22
Every other ward hosts a larger share of students with special education needs compared to the share
of students who live within the ward boundaries. For example, Ward 6 is home to 7 percent of elementary and middle school students with special education needs, but 15 percent of such students attend school there. And Ward 4 is home to 15 percent of high school students with special education needs but 25 percent of such students attend school there.
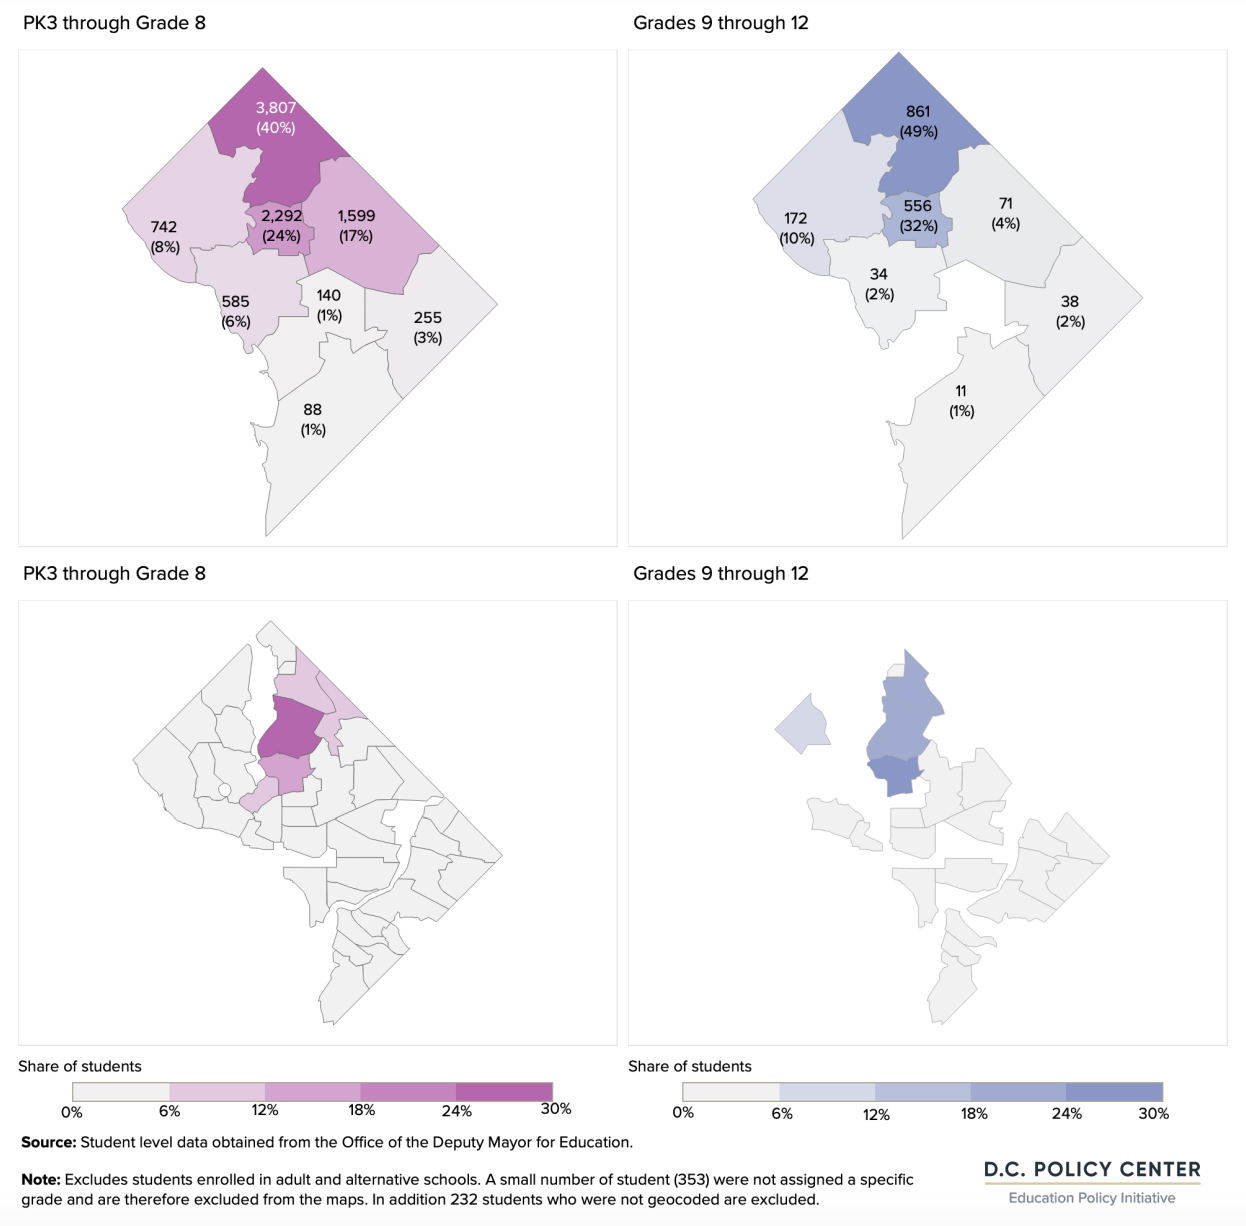
English learners
As shown before, English learners are concentrated in Wards 4, 1, and 5. They also tend to go to school in these wards, concentrated in the Columbia Heights, Takoma, and Brightwood neighborhoods.
English learners, by the ward and neighborhood of their school, school year 2021-22
Assessment of needs and how they change with where students live and where they attend school
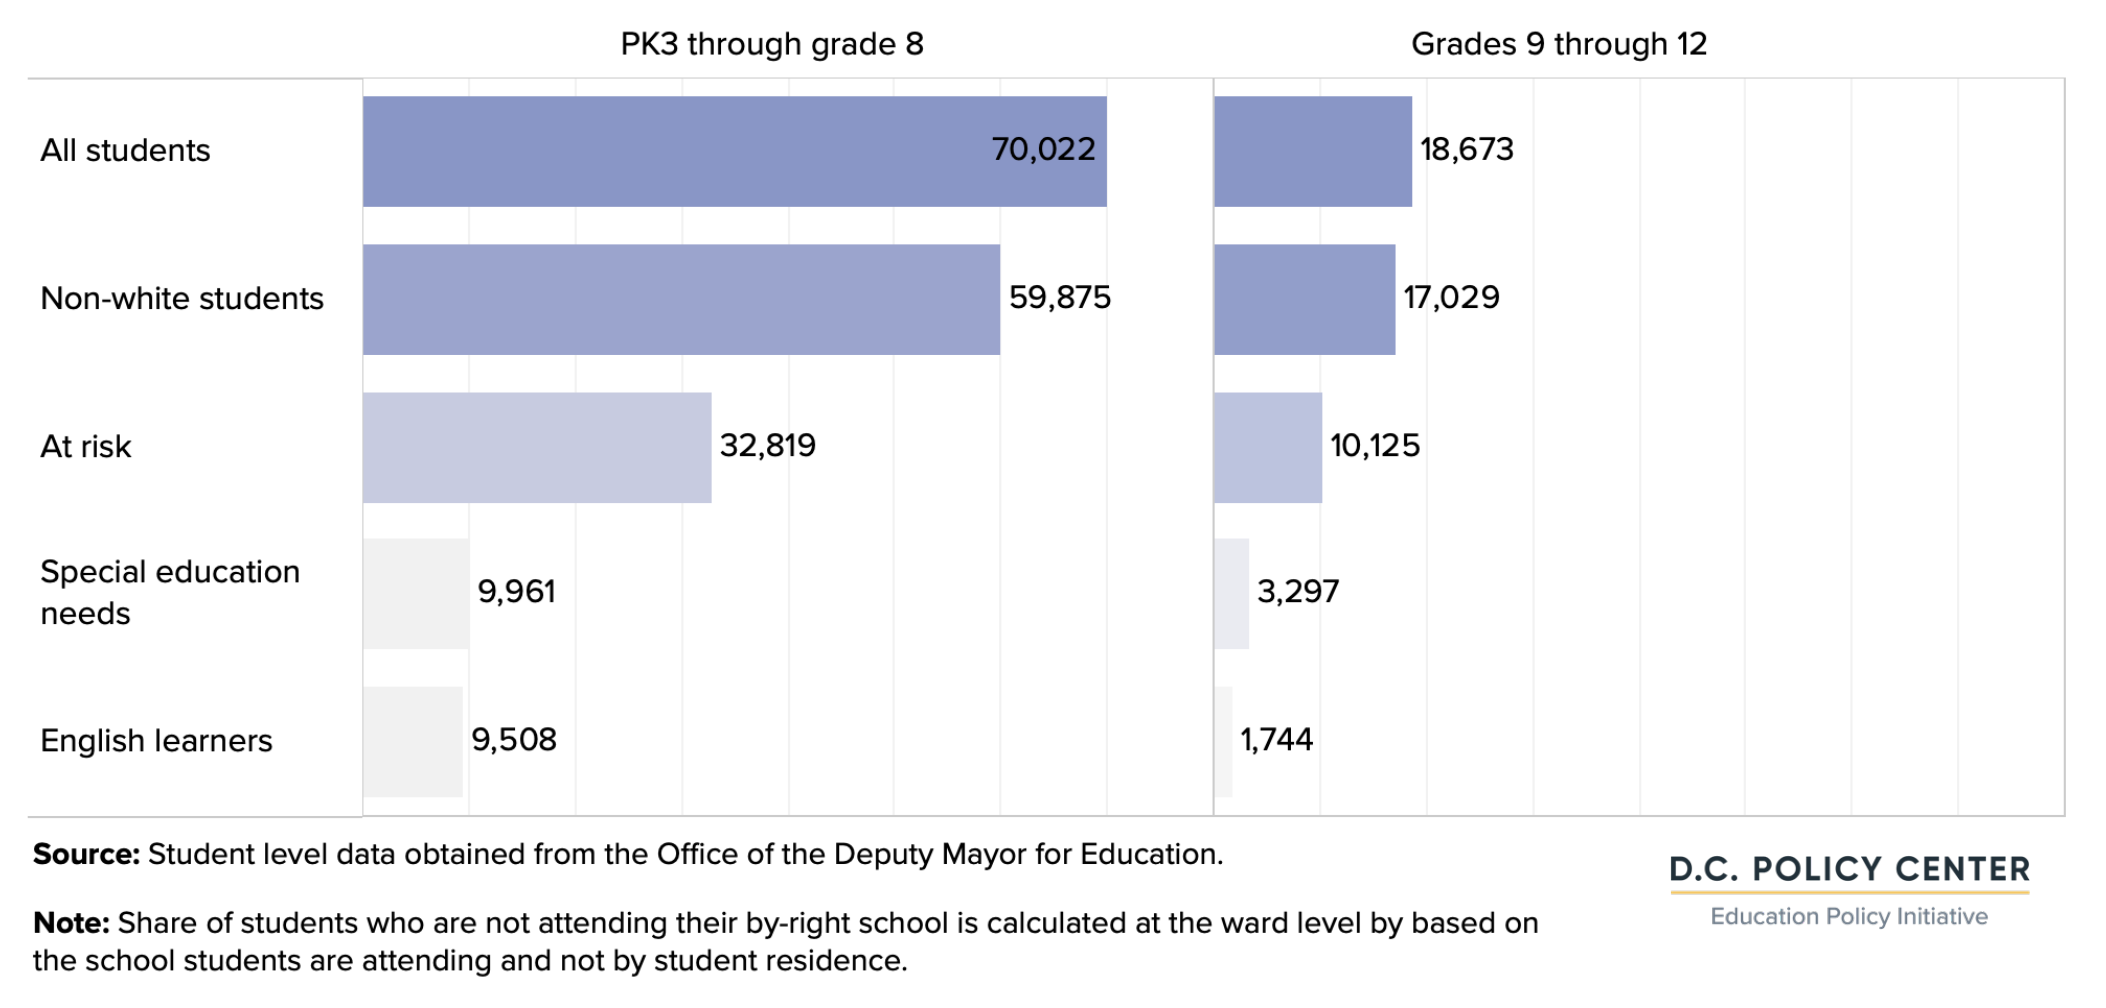
The District subsidizes OST programs to support the learning and growth of all its public school students. To provide every student attending public schools an OST seat, the city would have to build up to a capacity of 70,000 seats at the PK3 through grade 8 level, and 18,673 seats at the high school level. But given constrained resources, the city may have to prioritize which students subsidized OST programs serve.
For example, prioritizing Black, Hispanic, Latino, and other minority students would require 59,875 seats at the elementary and middle level (combined) and 17,029 seats at the high school level. Alternatively, prioritizing at-risk students would require 32,819 seats at the elementary and middle school level and 10,125 seats at the high school level. If the city committed to providing OST seats to all students with special education needs, it would have to set aside 9,961 seats for these students at the lower grade bands and 3,297 seats at high school level. Finally, targeting English learners would require 9,508 seats at the elementary and middle school level and 1,744 seats at the high school level.
Needs assessment for OST programs with specific targets
These needs would shift across the city if the programs were in close proximity to students’ homes versus their schools. For example, if the city prioritized serving at-risk students in locations close to their homes, a larger share of the seats would have to be provided in Wards 7 or 8. But if the city were to prioritize seats close to students’ schools, some of these seats would have to shift to Wards 4, 5, and 6 at the lower grade band, and Wards 4 and 5 at the high school level. Similarly, some of the seats targeting students with special education needs would have to shift from Wards 7 and 8 to Wards 4 and 5 if the District prioritized seats close to students’ schools over those close to their homes.
Distribution of different student groups, by ward of residence and ward of school, elementary and middle school students
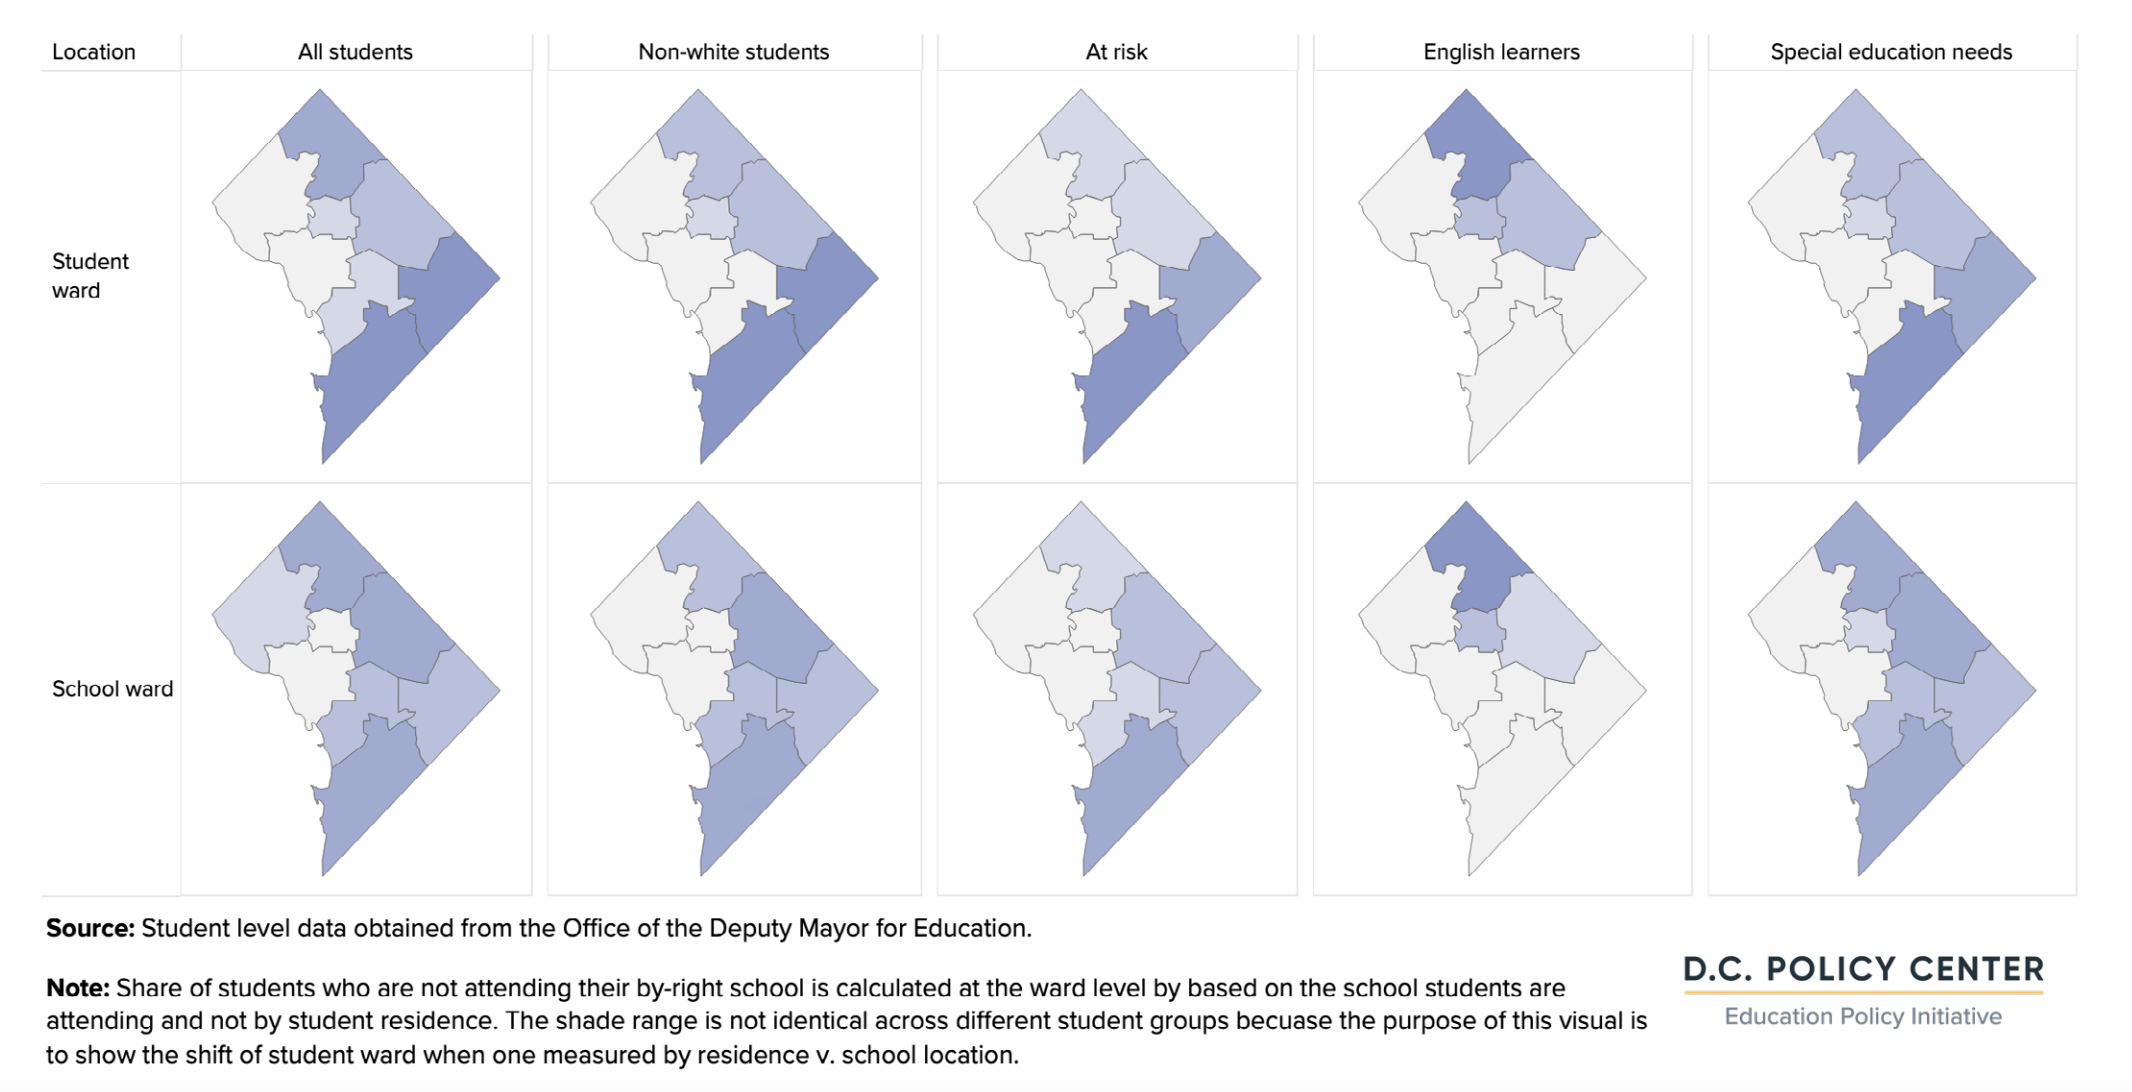
Distribution of different student groups, by ward of residence and ward of school, high school students
Importantly, availability of seats does not guarantee that all students will be served. There could be demand level constraints that prevent students from participating in OST programs (transportation needs, for example, or the need to work or attend to chores at home). Additionally, lack of information about program availability and locations may leave some seats empty. If parents (and youth) do not think their OST program is serving students well, they may be less likely to enroll or attend. And parents may choose not to enroll their students if they do not think that the program is meeting the needs of their students, especially those who are English learners or have special education needs.
Detailed information on capacity of OST programs and locations, estimated gaps across the city and at the neighborhood level, and the experience of providers and families can be found in the main text of our report.
Endnotes
- It excludes 5,579 students enrolled in adult charter schools; and 1,065 students enrolled in alternative high schools. In addition to students marked as enrolled in alternative schools, we excluded Goodwill Excel Center from the analyses. Even though this school is not marked as adult or alternative in the data set, it serves older youth.
- The D.C. Policy Center also geocoded student residence and school data at the census block, block group, and tract level. This information is later used in developing exposure maps and charts.
- 2021-22 School Year Enrollment Audit Report and Data retrieved from https://osse.dc.gov/node/1579401.
- The analyses excludes students identified as adult, alternative, and full special education schools. It also excludes students enrolled in Goodwill Academy, since most students attending this school are older, and work. With these adjustments, the number of students included in the analyses is 88,482.
- The number of students attending grade 9 through 12 is 18,594 when adjusted as described in note 3.
- Four neighborhood clusters are excluded from the analyses because there were too few students living within these boundaries. For a full list of neighborhood clusters and enrollment at each cluster, see Appendix table 1.
- Kids count D.C. Population by age group by Ward, 2021. This data has been constructed using the 5-year data summary from the American Community Survey for the period 2017-21. It shows the number of children in Ward 2 between the ages of 3 and 18 is 2,385, or only 2.4 percent of children in this age group in the city (99,794).
- These include Congress Heights, Bellevue, Washington Highlands in Ward 8, Columbia Heights, Mt. Pleasant, Pleasant Plains, Park View in Ward 1, and Brightwood Park, Crestwood, Petworth cluster in Ward 4. See appendix table 1 for a full list of neighborhood clusters.
- These include Takoma, Brightwood, Manor Park cluster in Ward 4, Union Station, Stanton Park, Kingman Park cluster split between Wards 6 and 7, Douglas, Shipley Terrace cluster in Ward 8, and Capitol View, Marshall Heights, Benning Heights cluster in Ward 7.
- Coffin, Chelsea and Julie Rubin (2023). “The role of school boundaries in the District of Columbia: Facts and findings on boundary participation, student representation, and facility utilization.” D.C. Policy Center. Available at https://www.dcpolicycenter.org/publications/school-boundaries/