From its conception, the Paycheck Protection Program (PPP) attracted a lot of attention. The PPP loans were thought of as lifelines for small businesses that have taken large losses from the pandemic-induced economic shocks. By providing sums of money to cash-strapped businesses, PPP loans were intended to allow small businesses to keep their employees on the payroll. Importantly, it was advertised that businesses that could demonstrate need and spend the loans mainly on preserving they employees would be able to convert these loans into grants.
Controversy followed, with funding that seemed insufficient to meet the demand, murky rules that were changed numerous times, inequitable access to banks that approved these loans, and the realization that some of the companies that received these loans were national chains with large financial assets.
In response to public pressure, the U.S. Small Business Administration (SBA) and the Department of Treasury released additional data on loan recipients. For loans below $150,000, only aggregated data were provided (we were unable to find any explanation for the selection of this threshold). However, for loans greater than $150,000 the data included company names, zip codes, industry areas, and additional information on owner characteristics such as race, ethnicity, gender, and veteran status. The data also included the number of jobs that PPP loans were estimated to preserve for each business applicant.
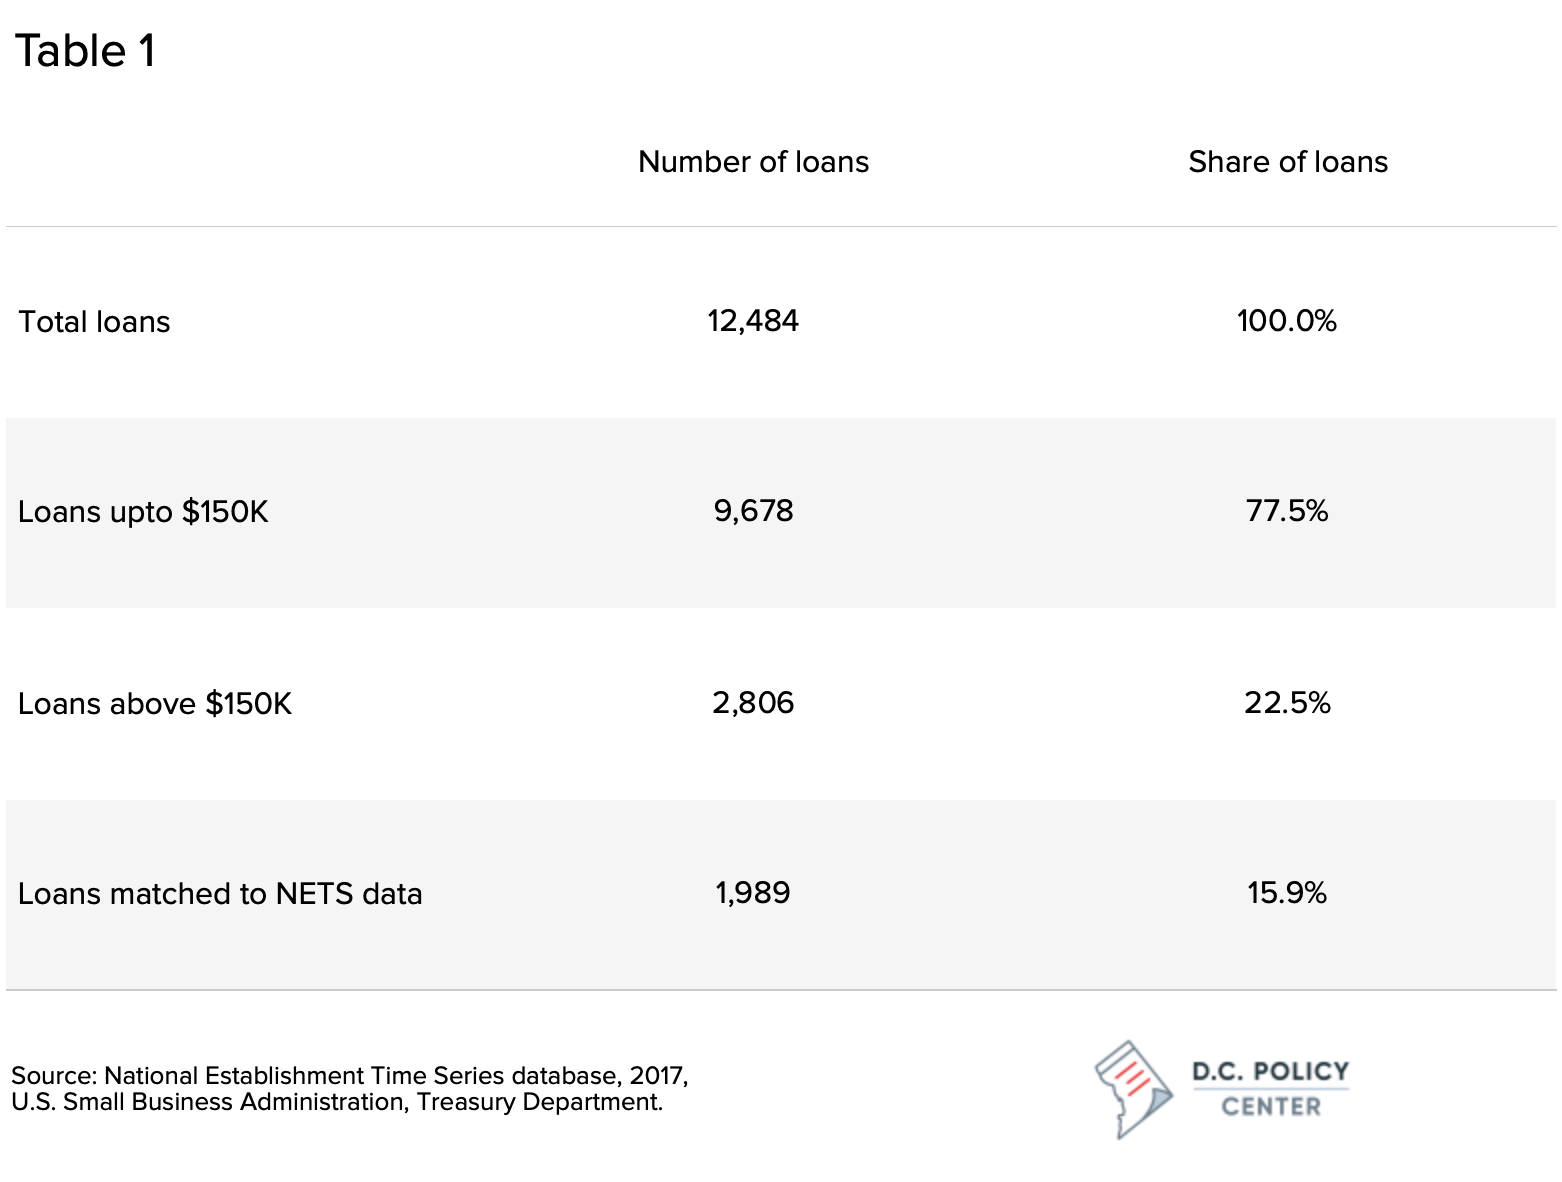
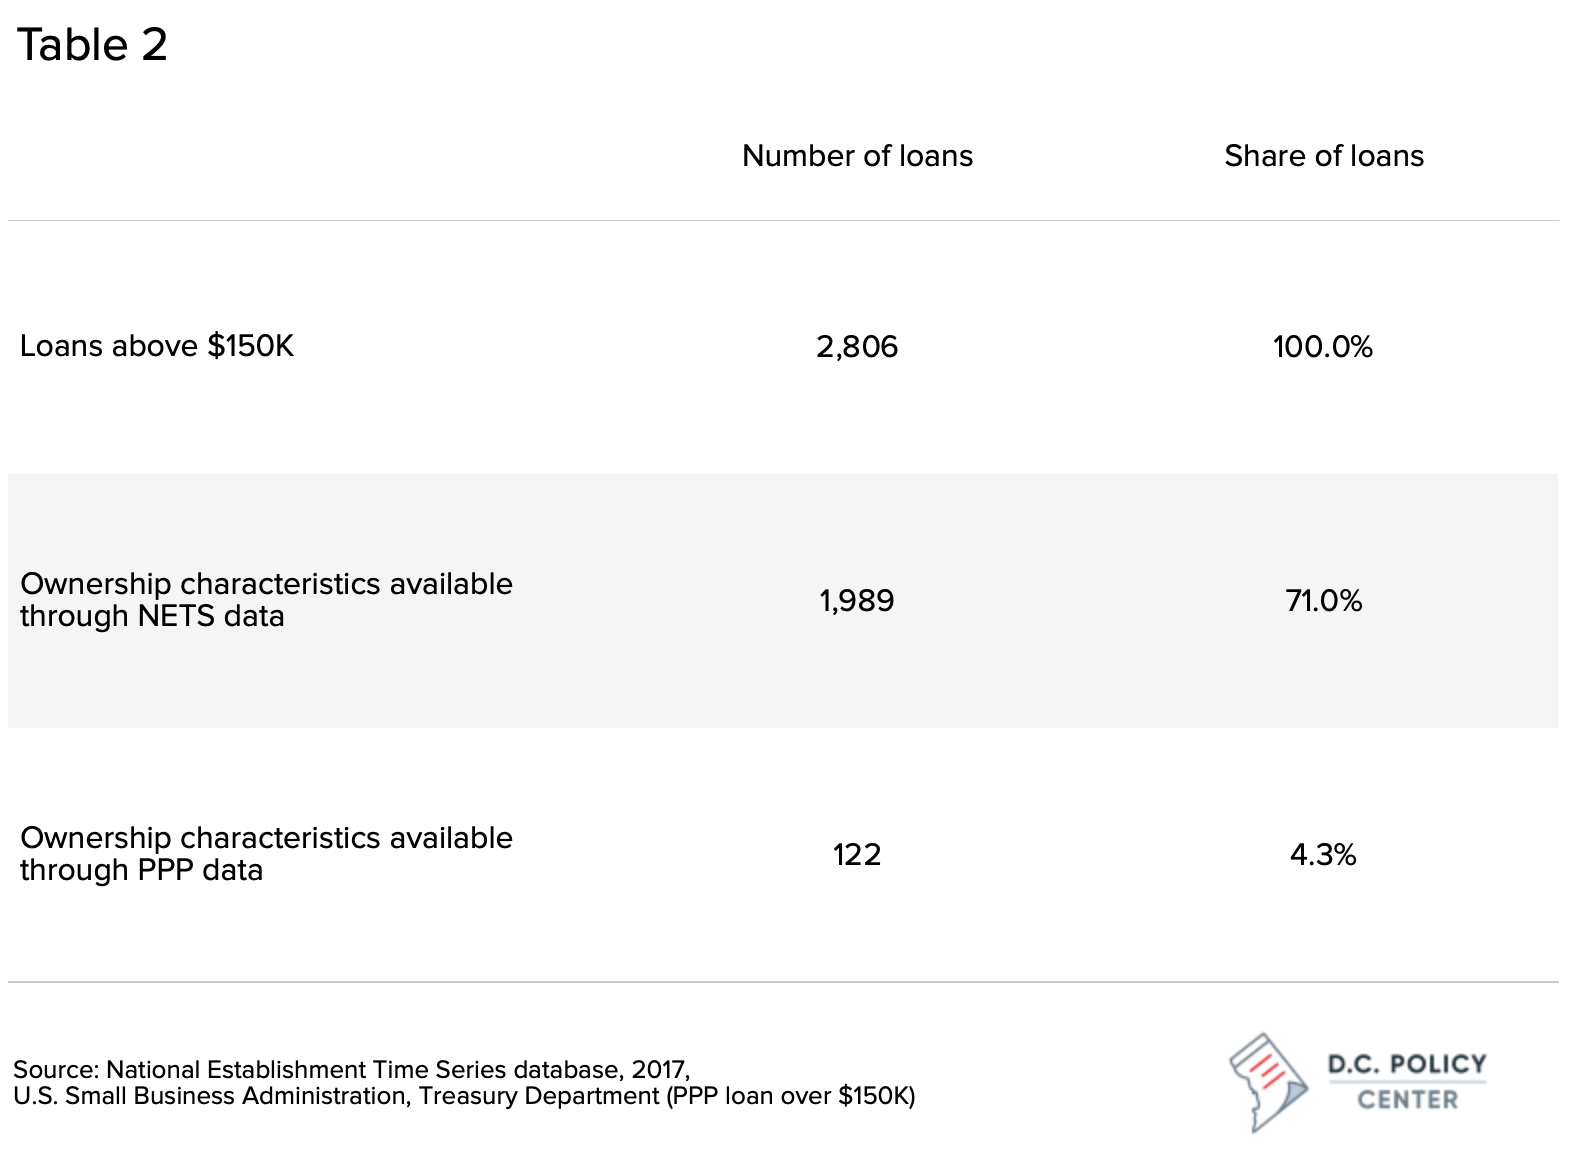
According to this data, 12,484 businesses in the District received PPP loans. Of this group, 9,678 businesses received loans under $150,000 and 2,806 businesses received loans for at least $150,000. Importantly, for the 2,806 businesses with detailed data, only 122 (4.3 percent) had any information on owner characteristics, such as race, ethnicity, and gender. We wondered: can we use firm specific data to provide more information on the establishments that received PPP loans?
We compared the information from the SBA to the National Establishment Time Series (NETS) database. While not official administrative data, the NETS database provides exceptionally rich information on establishment characteristics, characteristics of the owner, and a historical track record of the establishment, including location changes, gross receipts history, and employment history. The NETS database is not comprehensive, but since we are looking for specific firms named in the SBA data on PPP loans, we thought using it was appropriate to find additional information about PPP loan recipients.
Using the business names and zip codes, we were able to match 1989 firms (71 percent of the 2,806 establishments for which SBA released detailed PPP data) to the NETS data. These 1,989 recipients account for 15.9 percent of all PPP loans. The following analysis is based on this 71 percent slice of the full universe of PPP recipients over $150K.
Businesses in Professional, Scientific, and Technical Services received the largest share of loans
Among the industries receiving PPP loans, the five industries that received the largest percentage of loans consist of Professional, Scientific and Technical Services, Other Services (religious, grantmaking, civic, professional, and similar organizations, etc.), Accommodation and Food Services, Health Care and Social Assistance, and Retail Trade. This differs slightly from the national trend, which includes the construction industry.
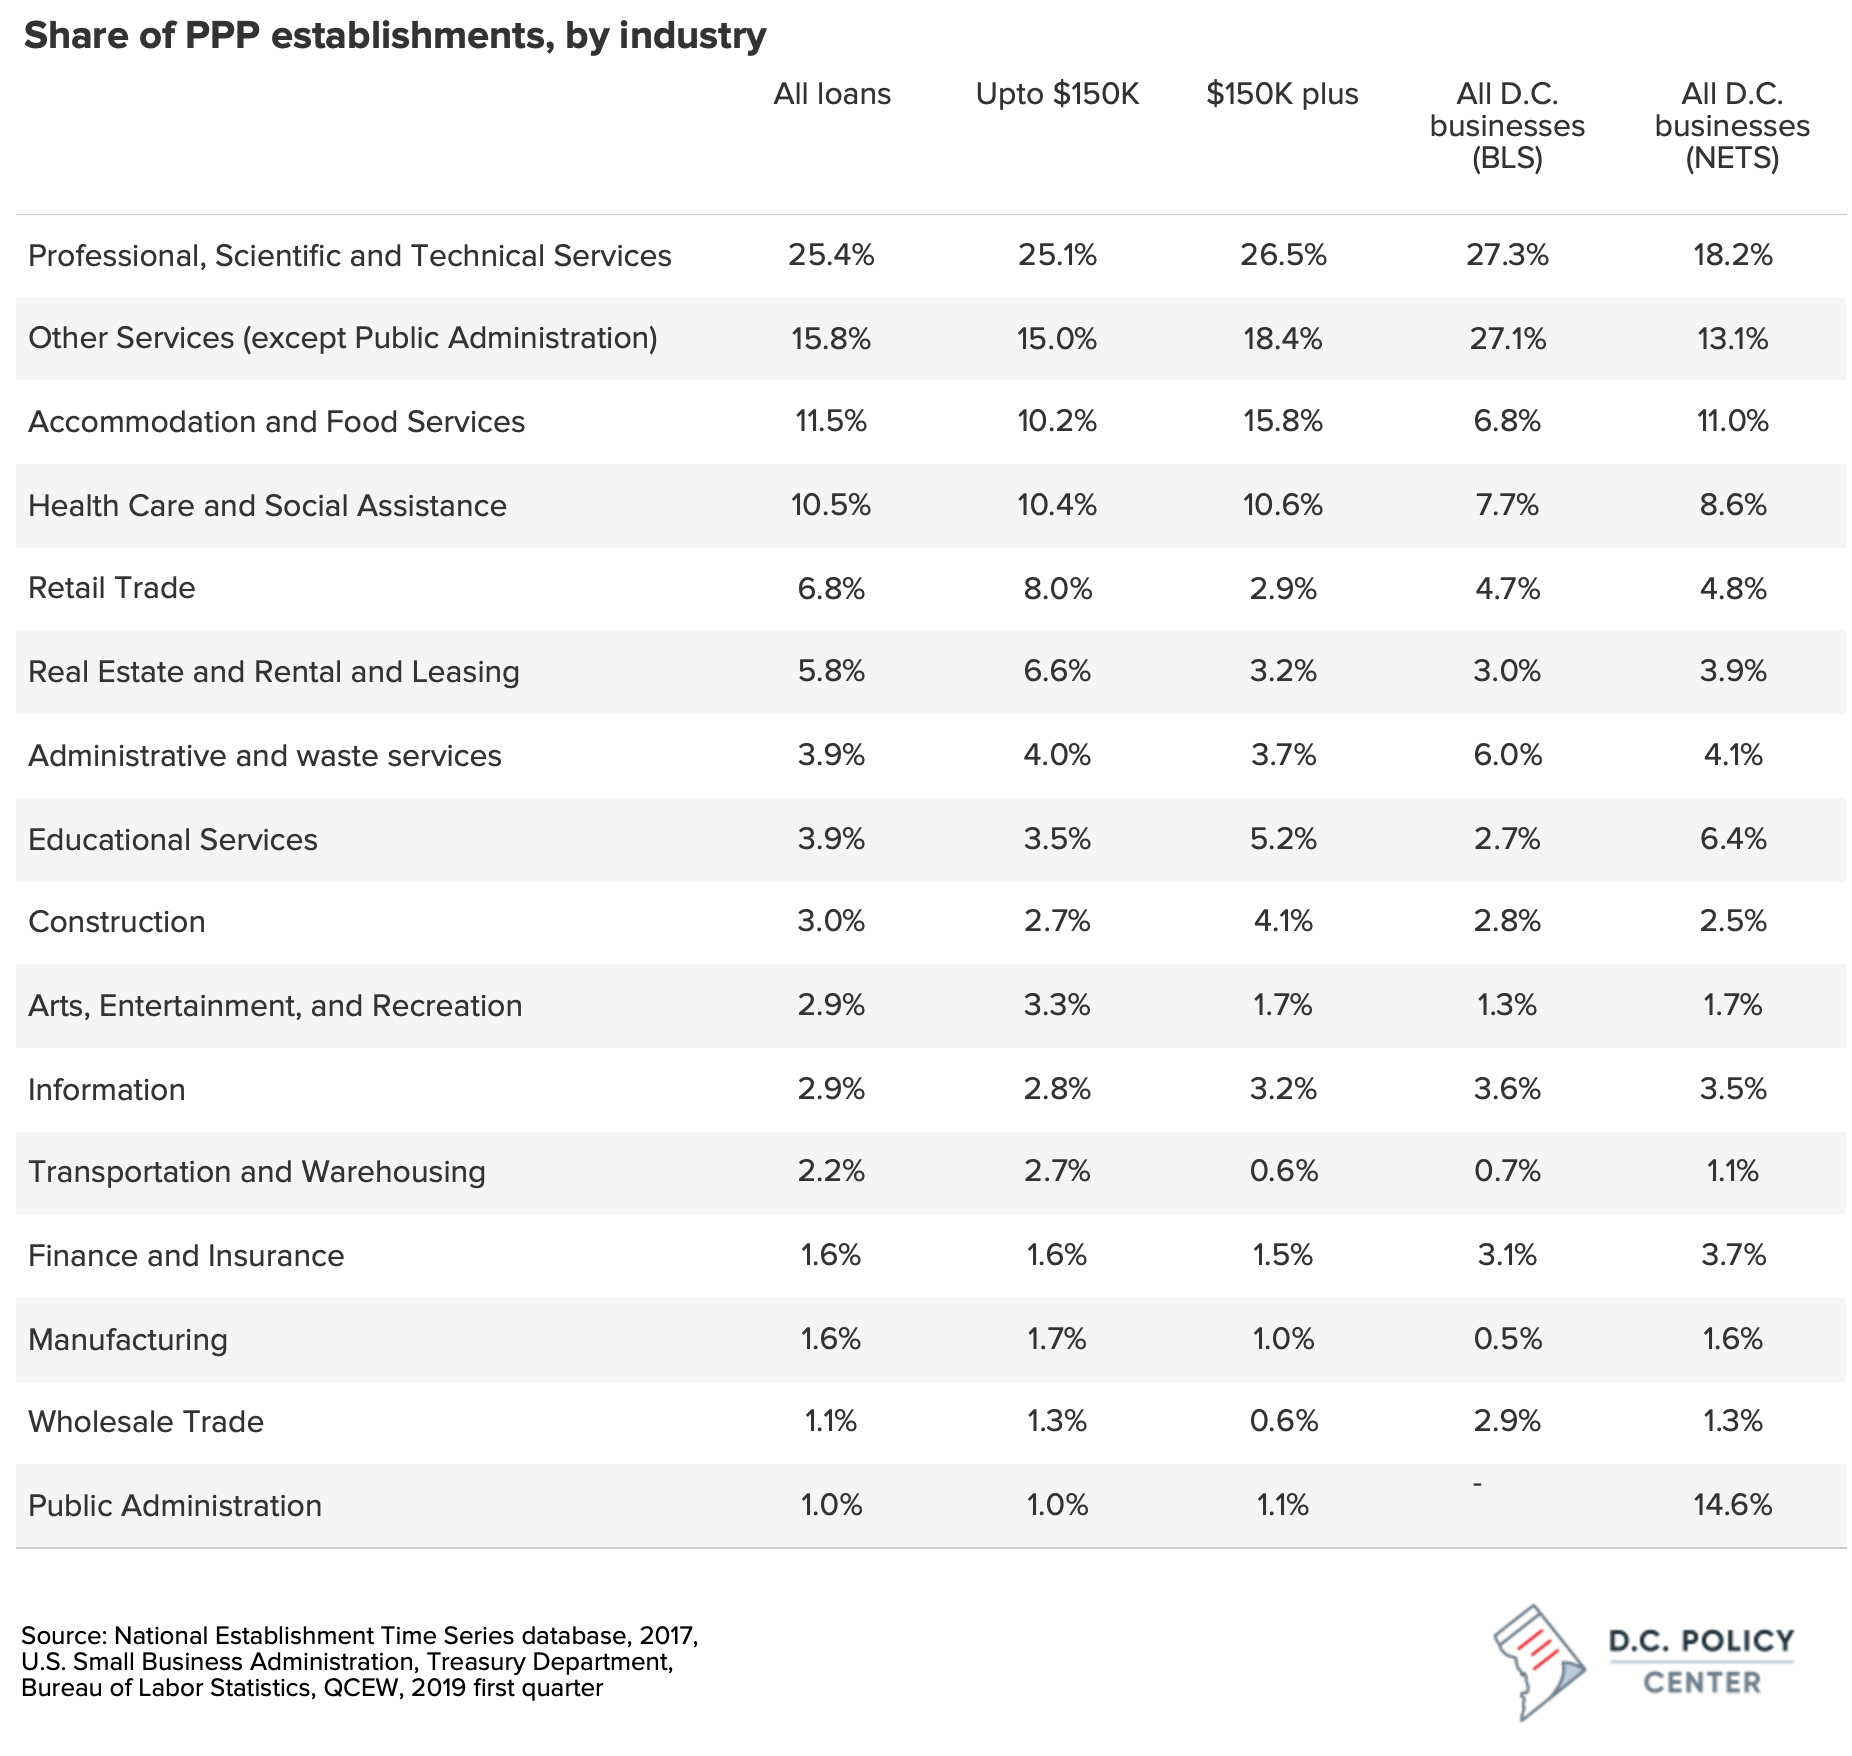
According to the Bureau of Labor Statistics (BLS) data, Professional, Scientific and Technical Services, and Other Services (except Public Administration) received a greater bulk of total loans. These types of firms also make up the majority of all establishments in the District. The Accommodation and Food Services sector received 15.8 percent of the loans over $150,000, while comprising 5 percent of D.C. businesses. However, the Retail Trade, and Arts, Entertainment, and Recreation sectors constituted only 2.9 and 1.7 percent of the loans over $150,000, and comprise 4.7 and 1.7 percent of total businesses, respectively[1]. This is potentially due to companies not meeting certain criteria for eligible costs or employee retention. Loans are forgivable only if at least 60 percent (initially 75 percent) of the loan is used for payroll, and this may have discouraged small businesses in the heaviest hit sectors from applying, especially if costs of rent, equipment, or other non-payroll costs account for a relatively large share of their expenses. Access to banks may have also served as a deterrent to small businesses applying for PPP. Many businesses were turned away for not having existing relations with the banks providing loans, and some businesses did not have enough capacity to be able to apply. The relatively short window of time[2] for spending the PPP loans, confusion about the requirement about demonstrating need, or having part time employees might have also contributed to the reluctance to apply for loans.
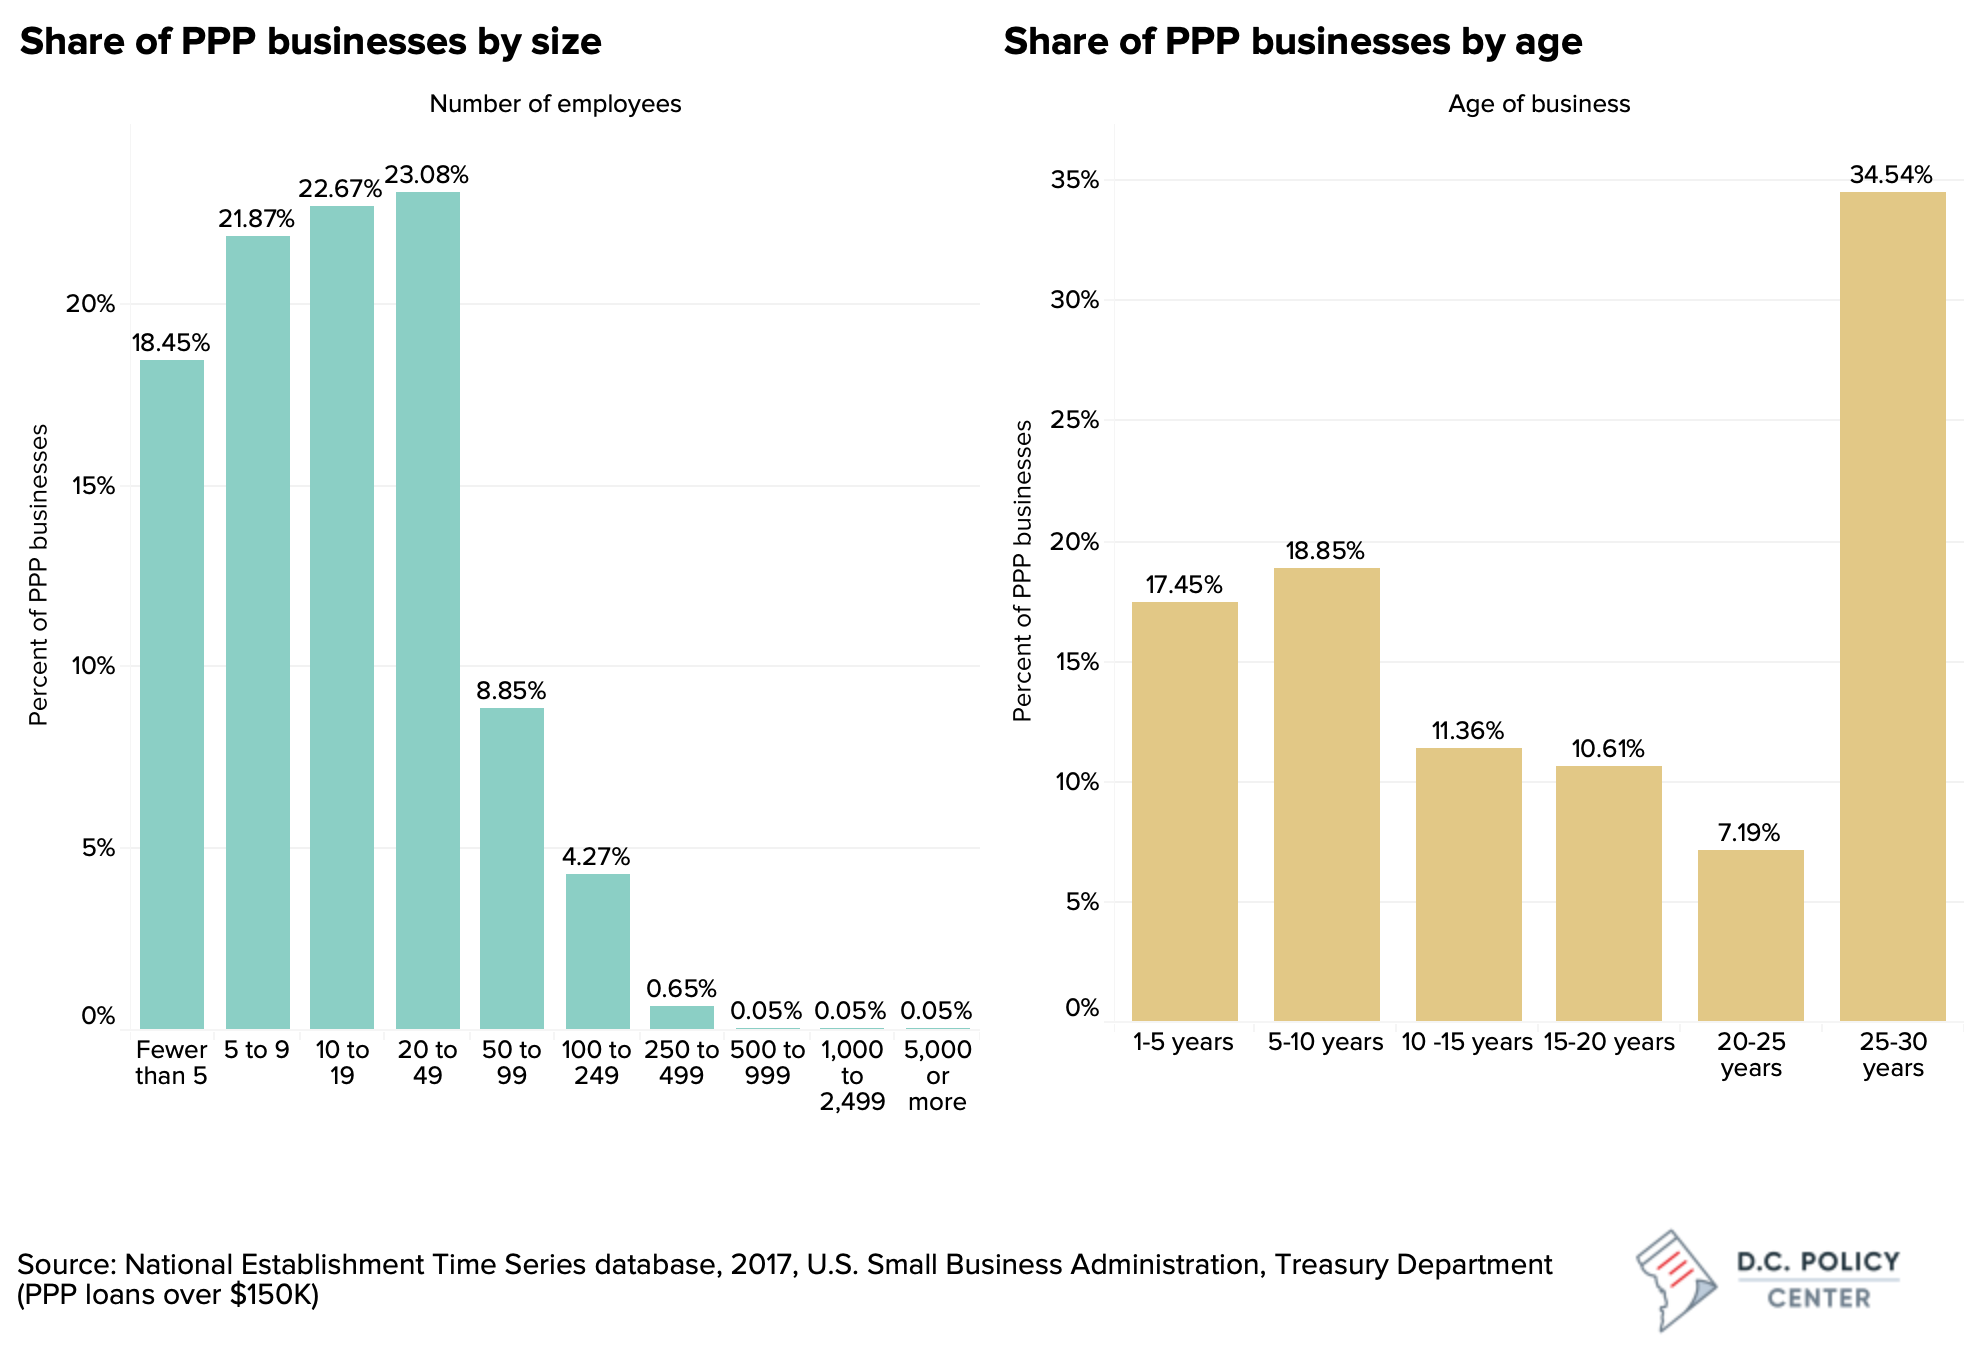
Among those businesses we could match, older businesses and businesses with 50 or fewer employees comprise the greatest share of PPP loan recipients
Of the establishments receiving loans above $150,000, those aged between 25 and 30 years received 35.4 percent of PPP loans and account for 26.1 percent of the District’s businesses overall. While businesses aged 5 or less years make up a similar share of the city’s businesses (26.5 percent), they represented a much smaller share of businesses receiving loans (17.5 percent). Establishments with 20-49 employees formed a slightly larger share of PPP loan recipients at 23.1 percent, while constituting roughly 15 percent of the District’s businesses[3]. Although 68.7 percent of businesses in the city have fewer than 5 employees, these businesses account for a relatively smaller share of PPP loans (18.5 percent). Since loan eligibility was based on payroll sizes, this is not a surprising outcome.
The 154 D.C. businesses that received large loans over $2 million are not generally from industries heavily impacted by the pandemic
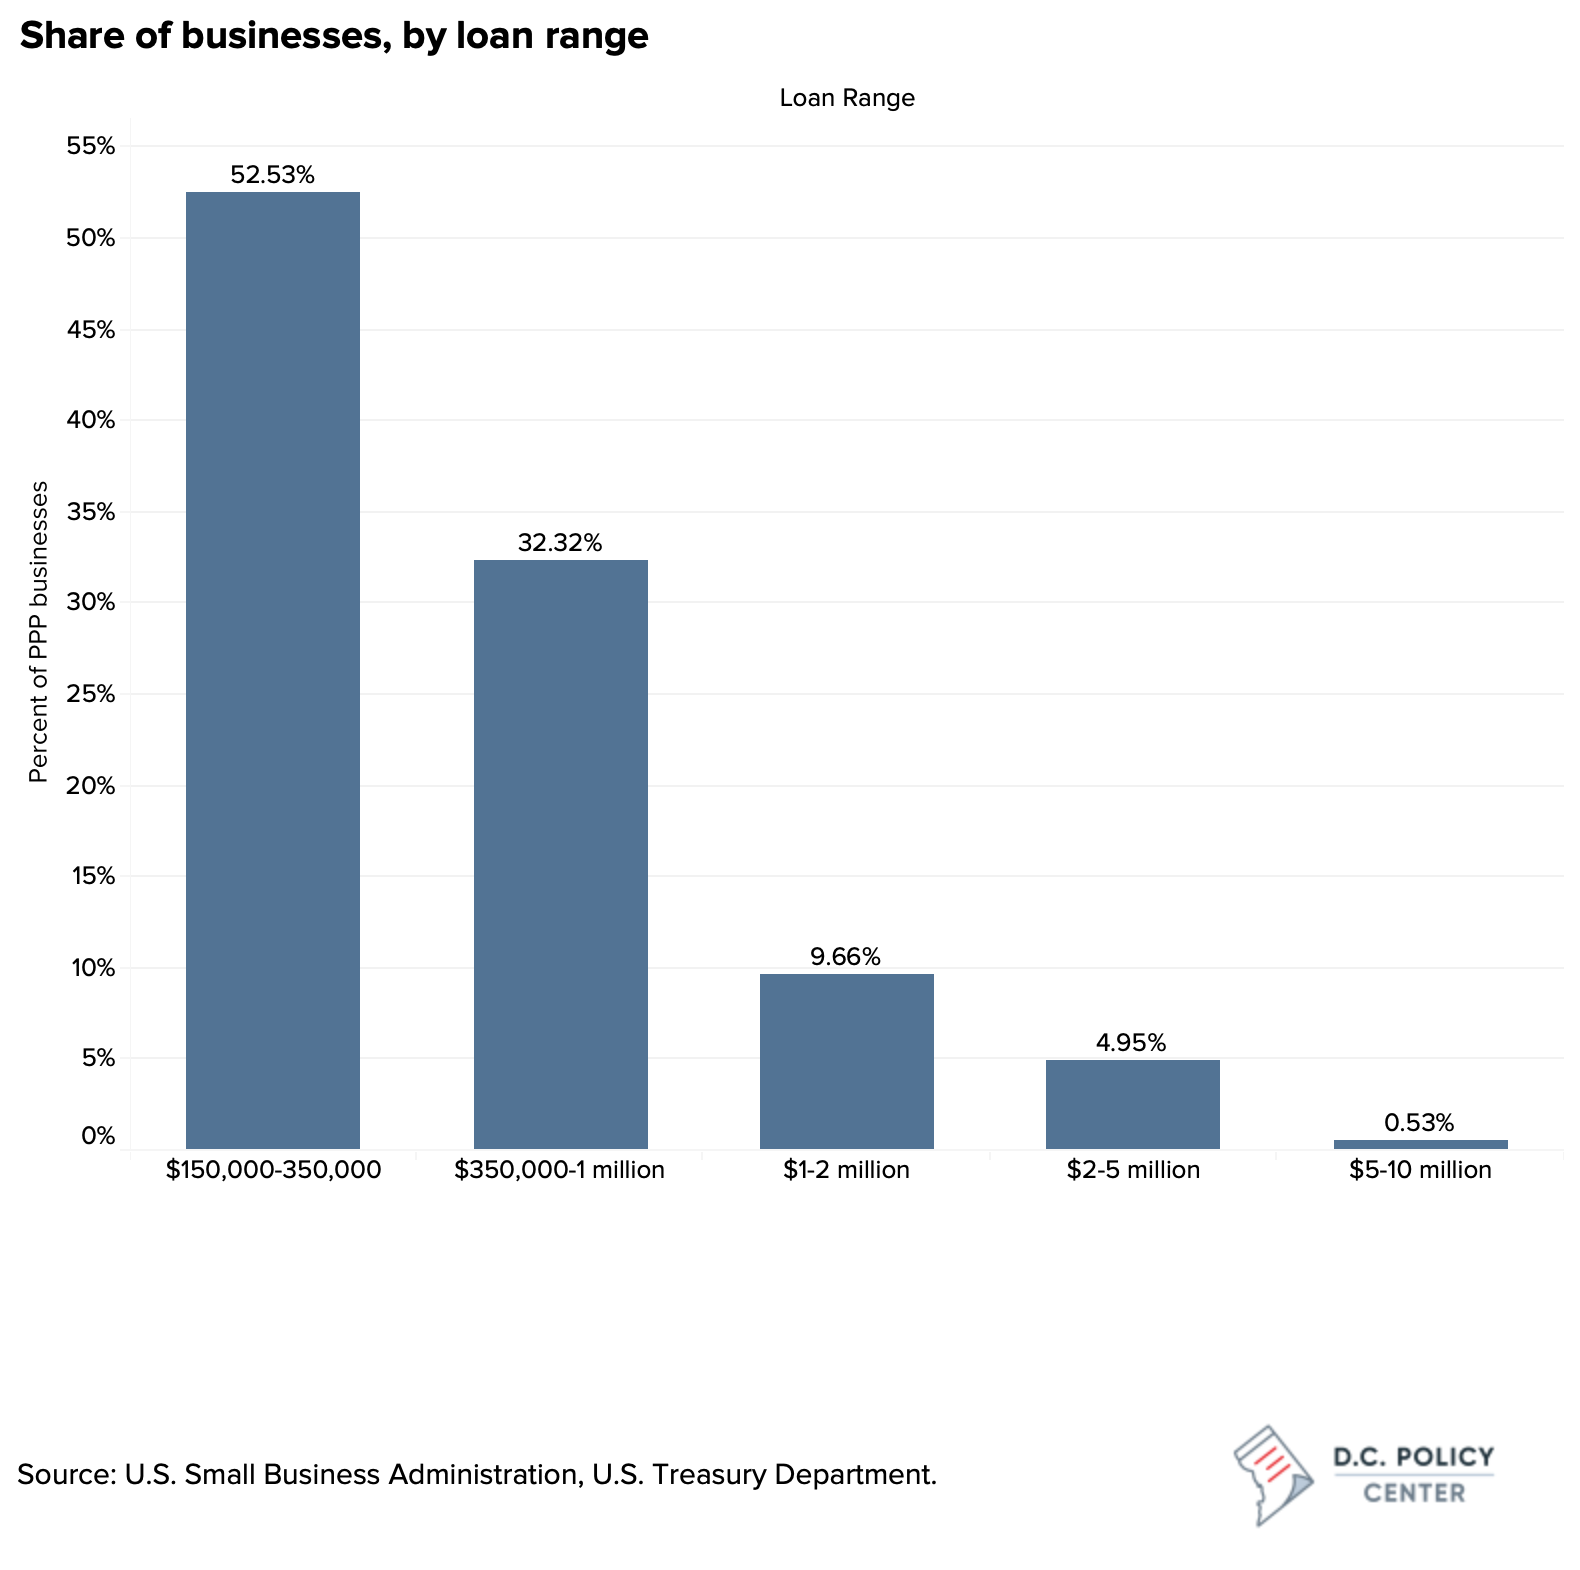
Over half of the businesses that applied for PPP loans above $150,000 received loans of less than $350,000. Loans worth over $2 million accounted for 5.5 percent of these loans, and only 1.2 percent of all loans. According to our analysis, most businesses that received large loans were not in industries that were significantly impacted by the pandemic. Accommodation and Food Services, Retail Trade, and Arts, Entertainment and Recreation constituted just 12.2 percent of businesses that received loans between $2 and $5 million (9.4 percent, 0.7 percent, and 2.2 percent, respectively). Moreover, the Retail Trade sector, as well as Arts, Entertainment, and Recreation sector saw no loans above $5 million. Similarly, older businesses accounted for the majority of large loans, and businesses with 100-250 employees represented 63.6 percent of businesses that received more than $5 million.
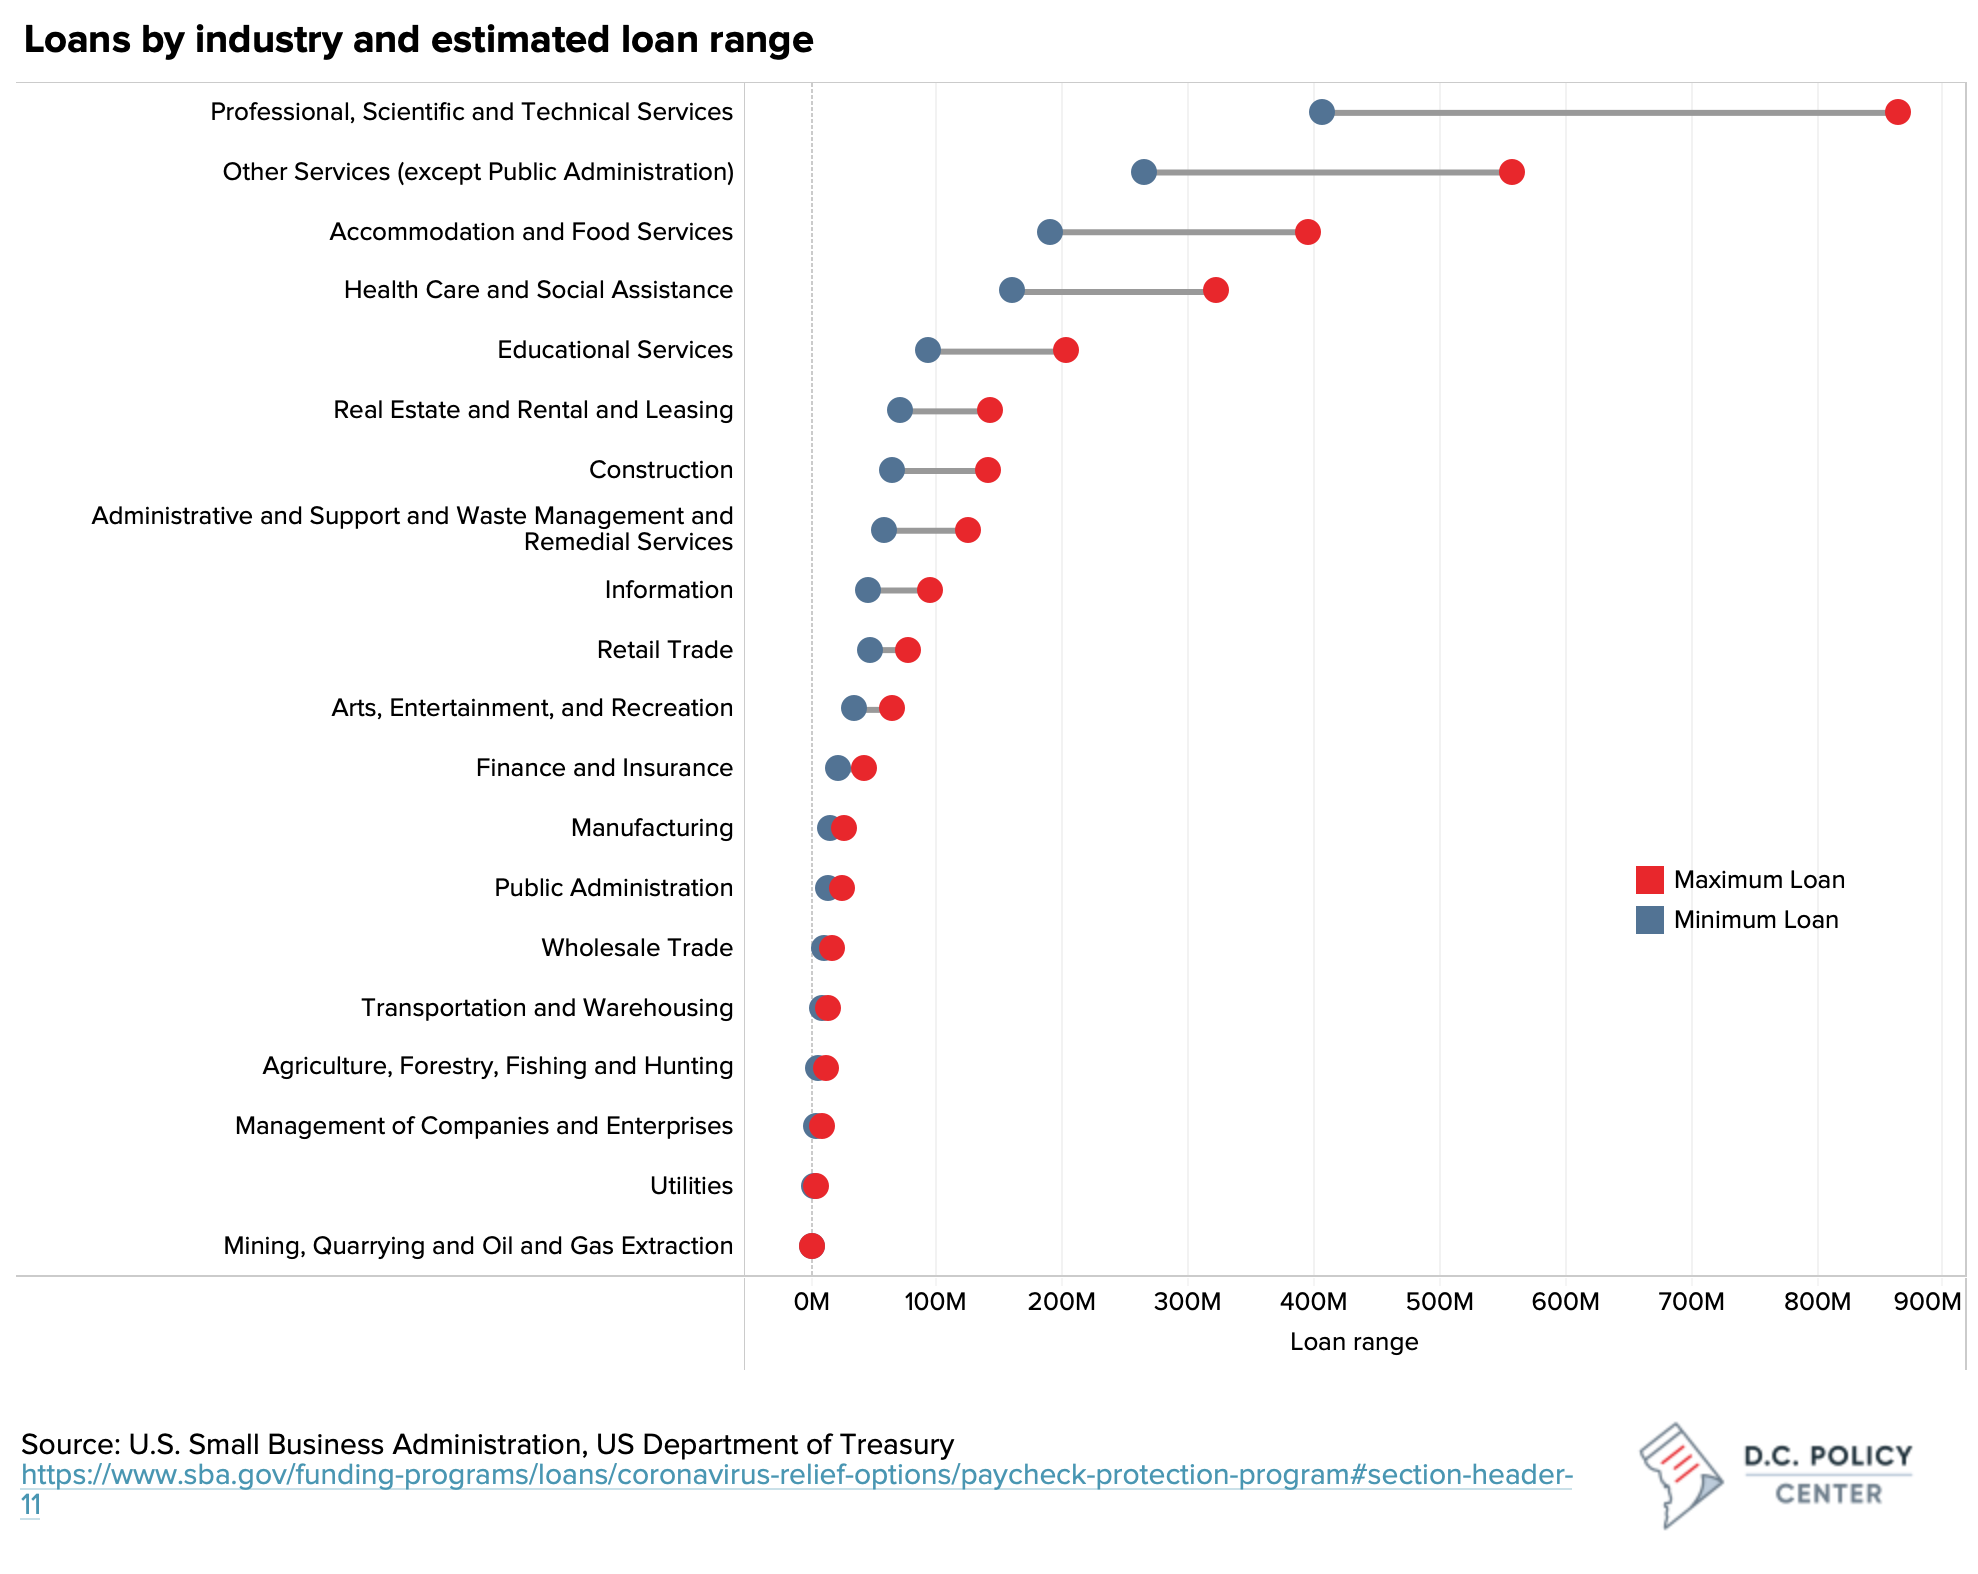
According to an SBA report, small businesses in the District received a total of $2.1 billion in loans. Using the loan amounts for businesses that received under the $150,000 threshold and loan ranges for those that received above the threshold, we estimated a loan range for each industry. Our estimates suggest that Professional, Scientific, and Technical Services received between $407 and $865 million, the largest by far, accounting for roughly 26.3 percent of total loan amounts. This is different from what we have seen nationally, according to the SBA report, with health care and social services receiving relatively larger shares of the amount (12.9 percent), and professional, scientific, and technical services, construction, and manufacturing services accounting for similar shares.
Businesses in Ward 2 benefit the most
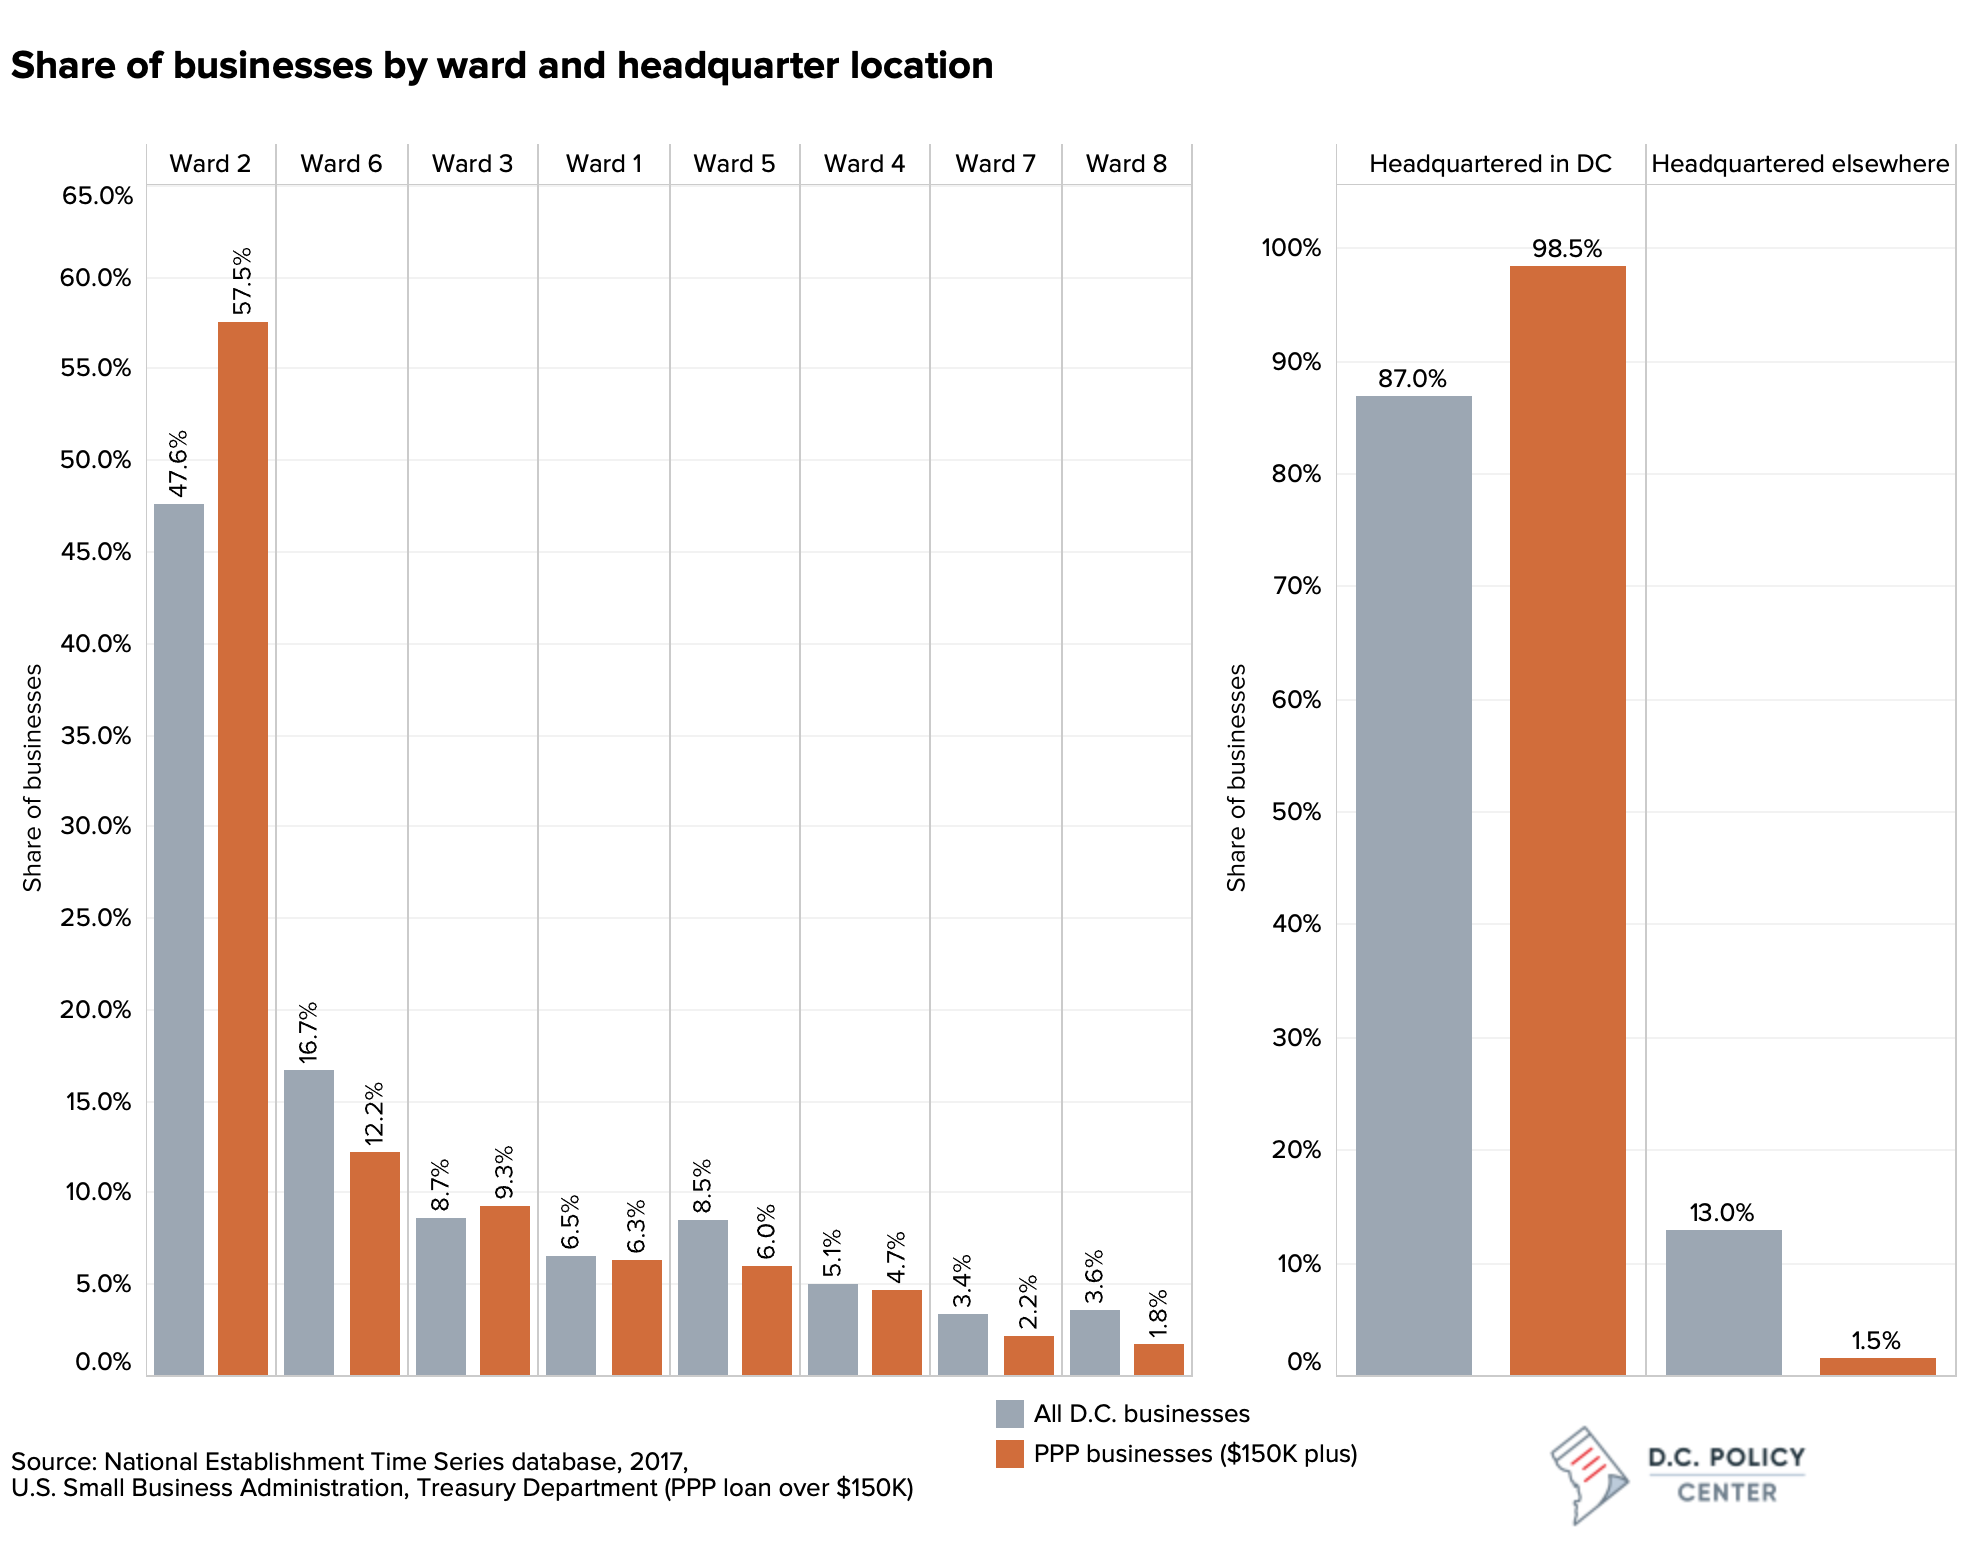
The geographic distribution of businesses receiving PPP loans greater than $150,000 is consistent with the geographic distribution of all businesses in the District. Ward 2 contains 47.6 percent of all D.C. businesses, and accounted for 57.5 percent of loans. Almost all of D.C.’s PPP PPP loan recipients are headquartered in D.C. Only 1.5 percent of businesses that received PPP loans in the District have headquarter locations somewhere other than D.C. (compared to 13 percent of all businesses in the District having headquarter locations somewhere other than D.C.).
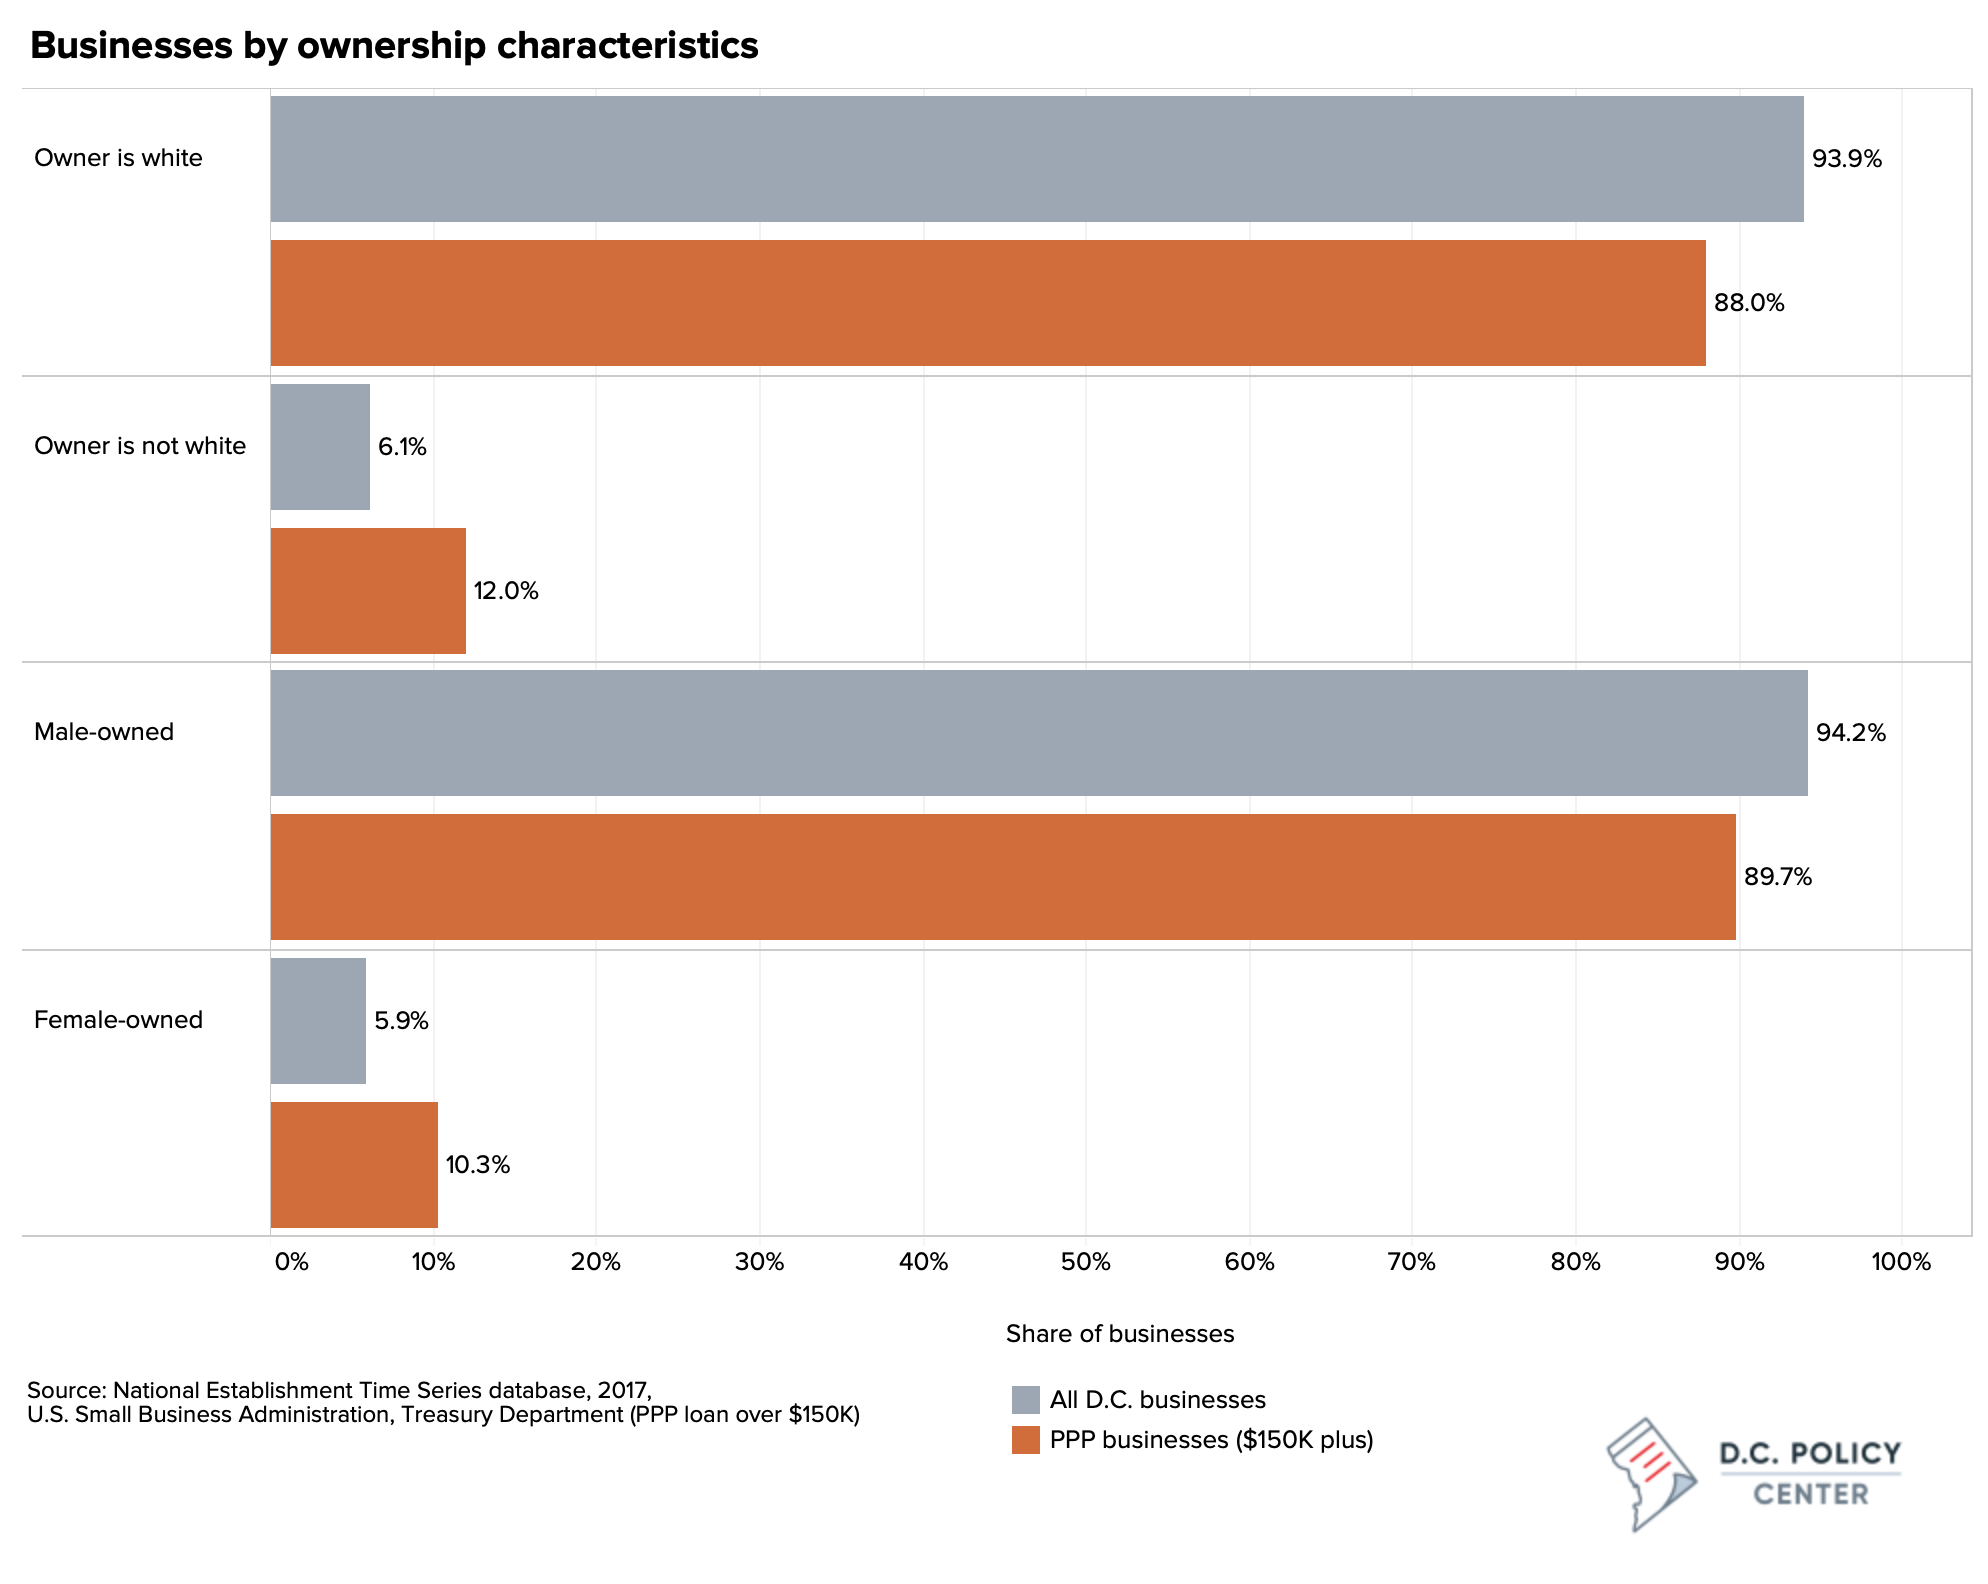
Businesses owned by people of color and women represent a larger share of recipients, relative to their shares of all businesses
Despite accounting for only 5.9 percent of all businesses in the District, women-owned businesses constituted 10.3 percent of establishments that received loans above the $150,000 threshold (203 out of the 1,989 establishments that we were able to match). Businesses owned by people of color followed a similar trend, accounting for 12 percent of the loans, while representing just 6 percent of overall businesses in D.C. Importantly, women-owned businesses formed 18.2 percent of loans above $5 million, and people of color-owned businesses represented 27.3 percent of loans above $5 million. The geographic distribution of businesses owned by people of color and women which received PPP loans across the District is largely consistent with the overall distribution.
The Accommodation and Food Services sector accounts for the largest share of estimated jobs retained through PPP, despite not receiving the largest loan amounts
A total of 165,495 jobs in the District have been retained as a result of the Paycheck Protection Program. Loans under $150,000 constitute 25.5 percent of retained jobs and loans worth between $1 and $2 million constitute 32.3 percent. Almost 20 percent of these jobs came from the Accommodation and Food Services sector, forming the largest share of retained jobs amongst all industries.
PPP loan constraints appear to have discouraged firms in hardest hit sectors
According to our analysis, the distribution of loans suggests that the contingency of PPP loan forgiveness on continuous employment of staff disincentivized many small businesses from participating in the program, especially those in sectors that faced the greatest shocks of the pandemic. The low representation of these businesses could also be due to banks favoring existing clients, as smaller firms and firms owned by people of color or women are less likely to have accounts with commercial institutions. However, our analysis also shows that businesses owned by women and people of color have received disproportionately more loans given their share of the District’s businesses.
About the data
The Paycheck Protection Program (PPP) loan-level data has been made available by the U.S. Small Business Administration (SBA) and Department of Treasury, and can be found here. This includes aggregated data for all loans below $150,000, and recipient information such as business name and addresses, for loans above $150,000.
The National Establishments Time Series (NETS) is a proprietary time series database collected by the Dun & Bradstreet Corporation. The NETS database provides establishment-level longitudinal microdata, which covers various business dynamics such as annual employment and sales, headquarter linkages, and related establishments, and provides characteristic information such as ownership and age of establishments. More information on the NETS database and how it compares to administrative data can be found here. The most recent year for which NETS is available is 2017.
There was a total of 12,484 loans in the District, of which 9,678 were loans below $150,000, and 2,806 were loans above $150,000 (Table 1). Of the 2,806 businesses with detailed information, only 4.3 percent (122 businesses) had data on business characteristics.
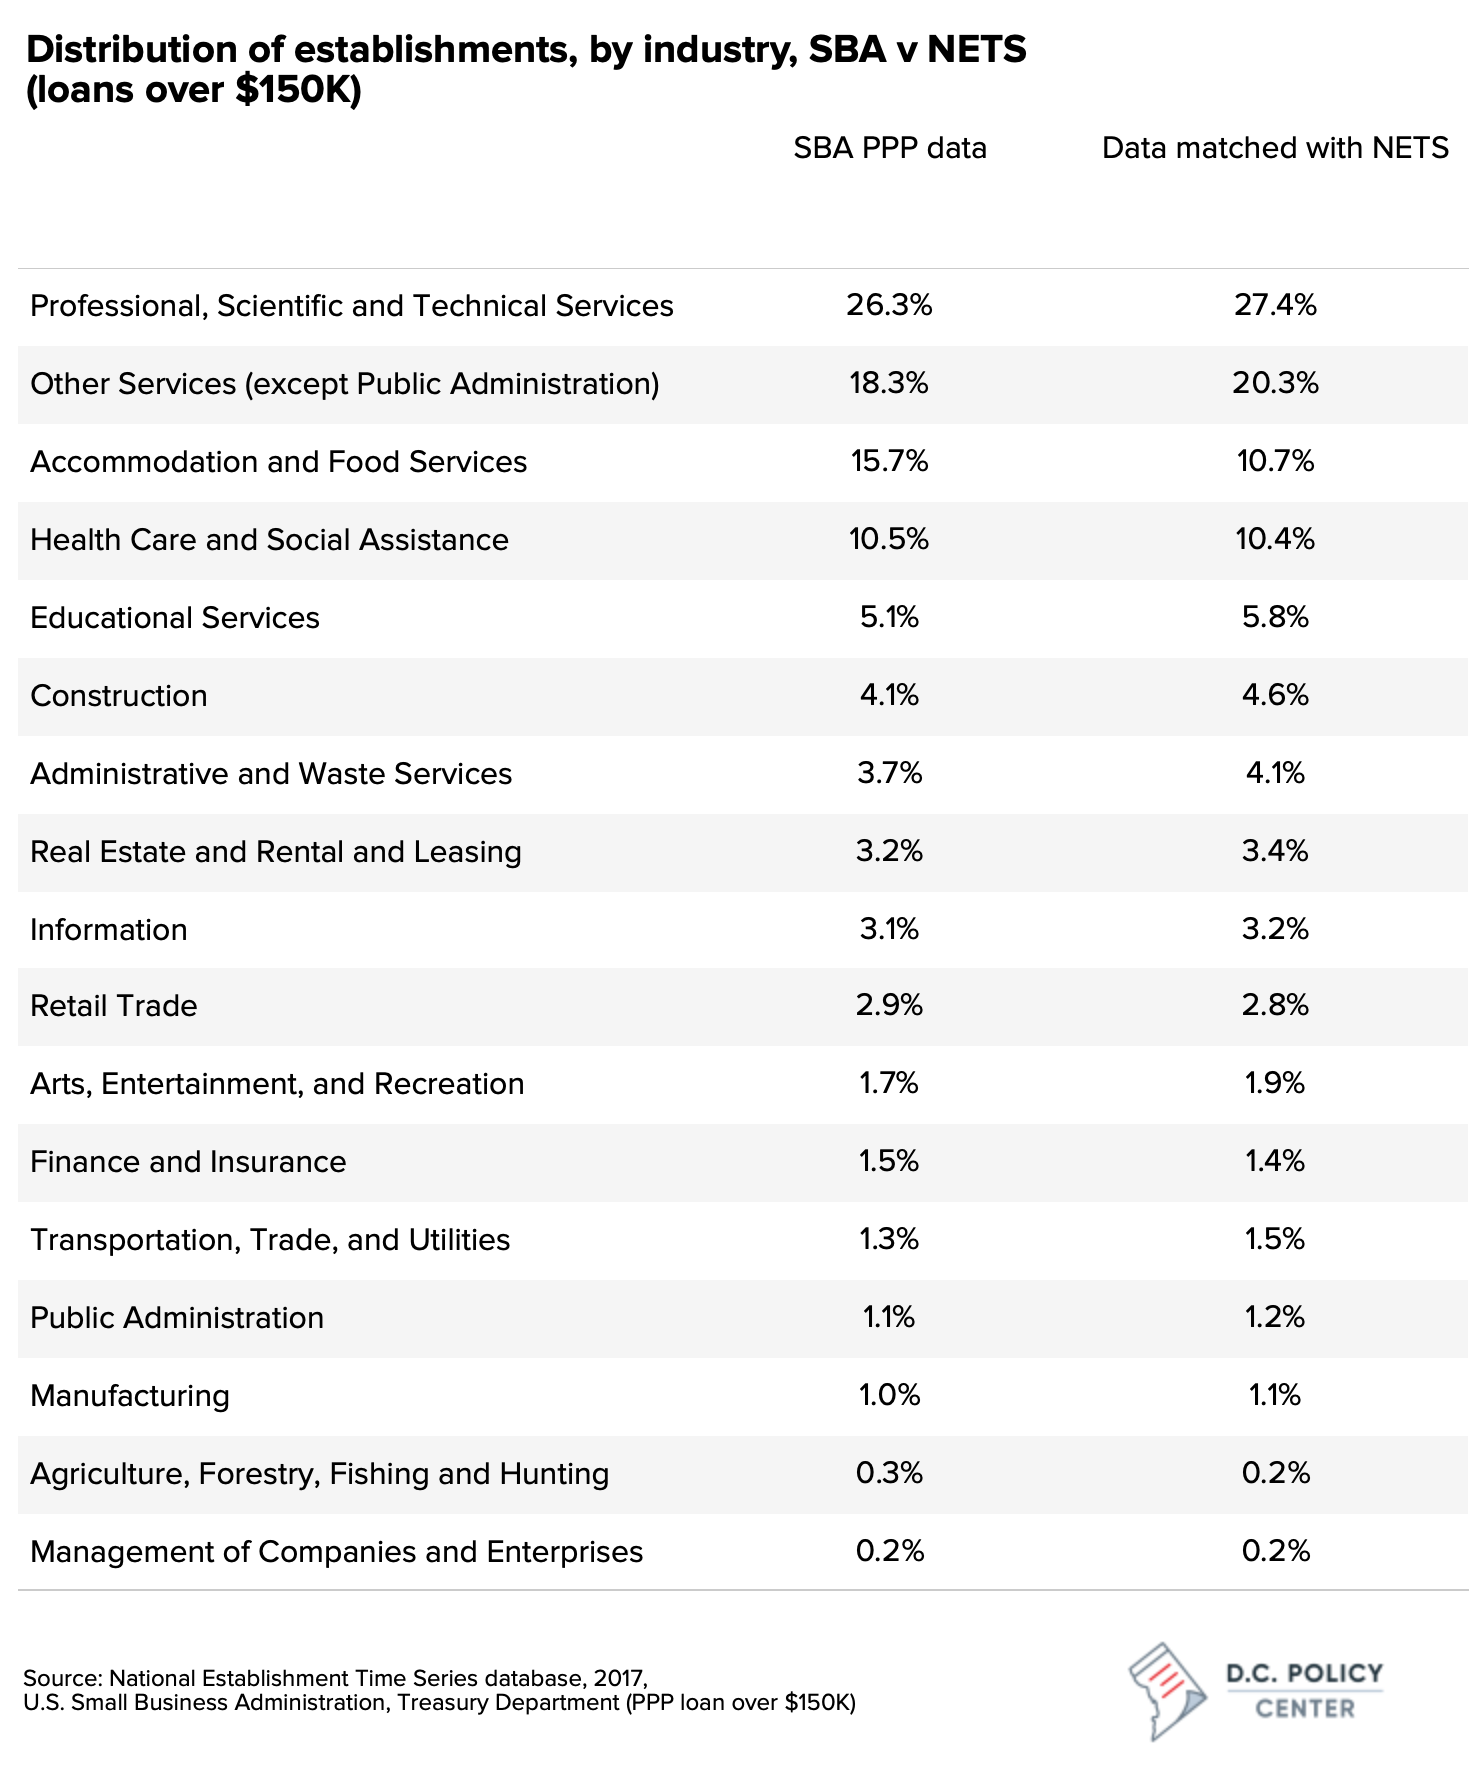
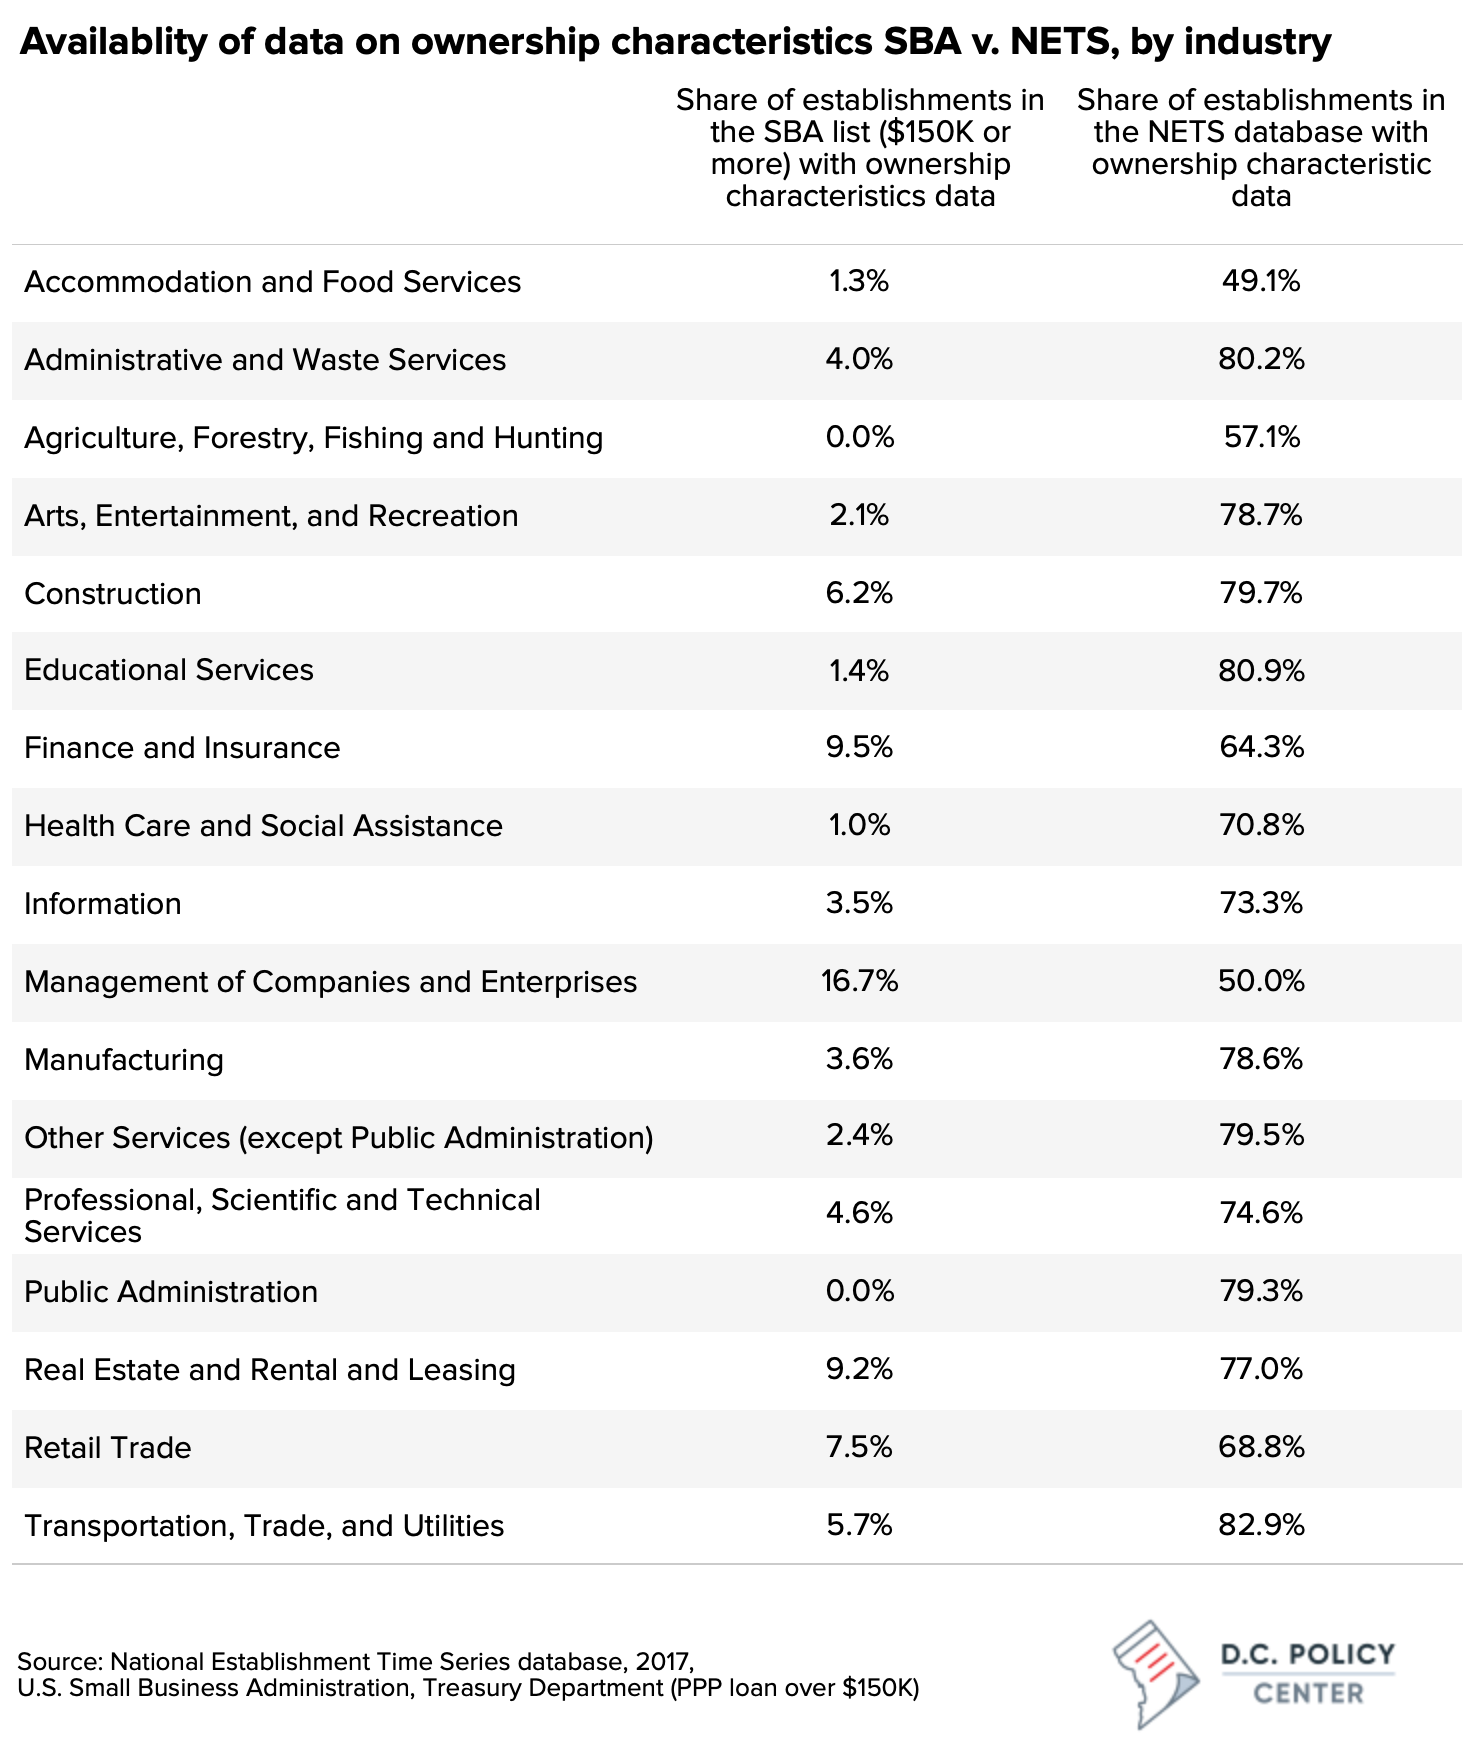
For almost all industries, the PPP data had less than 10 percent of data available on ownership characteristics. We were able to match 71 percent of the data for loans made above $150,000 to the NETS data by using the business names provided by PPP data, to obtain information on ownership characteristics (Table 2).
The distribution of establishments across industries amongst the 1,989 businesses we were able to match is largely consistent with that of the total 2,806 businesses, with only one sector, Accommodation and Food Services, having a difference of more than 2 percent. This comparison indicates that our 71 percent match is representative of all PPP loans over $150,000.