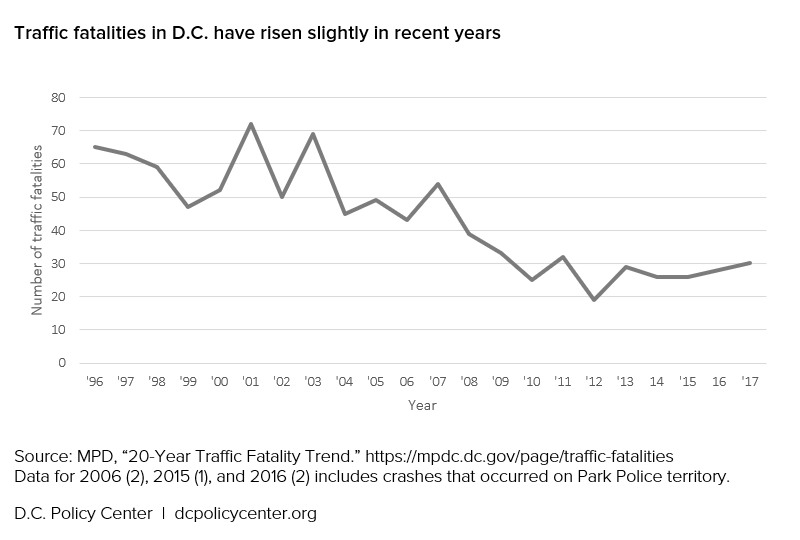
In late 2015, Washington, D.C. joined the international Vision Zero movement by committing to end traffic deaths and serious injuries by 2024. The Vision Zero movement recognizes traffic collisions as a public health epidemic with identifiable causes and solutions, rather than accidental and immutable forces of nature beyond reach of safety interventions; using this framework, the District has taken concrete steps to address root causes and reduce traffic fatalities. However, Vision Zero efforts in D.C. and elsewhere in the U.S. have been criticized for being ineffective—traffic deaths rose locally and nationally in recent years—and for exacerbating existing racial inequities.
Strategies to prevent traffic fatalities traditionally fall into three categories: engineering, enforcement, and education. Among these three, engineering is the most fundamental, but also the most difficult. Enforcement is often an easier tool for cities to deploy, especially when safer street design is held up by logistical and bureaucratic barriers.
“The thing that we think makes the biggest difference is design,” Jacob Bason, President of All Walks DC, said, in a recent discussion on the Kojo Nnamdi Show. Greg Billing Executive Director of the Washington Area Bicyclist Association, agreed: “It’s going to take us a little bit of time to redesign an entire city that has been designed for cars.” Billing also described enforcement as “a strategy of last resort”:
If our only mechanism to make a street safer is to go out and have police out there or speed cameras, we’ve already failed at the design of the street. So when you have a community, particularly communities of color, low-income communities where there has been historical disinvestment in safe streets, it’s no wonder that the outcomes of traffic fatalities and serious injuries are higher in those communities. … [A strategy based on enforcement] is not only going to perpetuate those inequities, but also cause additional harm in those communities.
In terms of D.C.’s enforcement mechanisms, the vast majority of citations for moving violations are from automated traffic cameras. Proponents have argued that speed cameras and red light cameras remove the potential of racially discriminatory enforcement. And in a sense, this is correct, as they do lessen the potential for selective enforcement and potentially volatile police encounters. But as with many technologies, even “neutral” automated traffic cameras can be used in ways that unintentionally further racial disparities. Given the District’s high degree of residential racial segregation, decisions about where and how to use “neutral” technology like speed cameras can still have a disparate impact in terms of outcomes.
My analysis of moving violations citations and crash data suggests that the racial geography of D.C. does play into in the enforcement of traffic violations: census tracts with higher proportions of black residents are associated with a higher incidence of traffic fines, despite not experiencing a greater number of crashes. This initial investigation suggests that absent an affirmative effort to equitably site automated traffic cameras, a disproportionate burden of enforcement could be borne within the District’s predominantly black neighborhoods. While research shows that traffic cameras do reduce vehicle speeds, collisions, and injuries, this analysis highlights the racial inequities that can happen when a city relies too much on enforcement as a Vision Zero strategy.
The history of D.C.’s automated traffic enforcement cameras
A high-profile report released in 2013 found that black residents in D.C. accounted for 70 percent of traffic-related arrests, despite making up under 50 percent of the population, with no indication of a commensurately higher rate of dangerous driving behavior. One strategy for reducing number of police interactions and their potential for violent escalation is by shifting traffic enforcement to cameras that detect dangerous infractions such as speeding and red light running. Without human bias at play, red light cameras and speed cameras would reduce the potential for selective enforcement, or using technical violations as a pretense for vehicle searches of questionable legality.
D.C.’s Automated Traffic Enforcement (ATE) was first implemented in 1999 with red light safety cameras, of which there are currently 47. The 74 speed safety cameras were added more recently, beginning in 2012. In order to maintain public trust that this enforcement mechanism is guided by safety rather than revenue, a 2014 municipal law stipulated that an engineering study be conducted to “determine the nexus between safety and speed cameras throughout the City.” Each safety nexus was assessed using available speed data, crash data, and engineering judgement, which itself considered factors such as adjacent land-use that may generate additional pedestrian activity.
A 2014 joint report issued by DDOT and MPD, indicates that the program has been largely successful in this regard. On average, collisions and injuries in the vicinity of the camera have decreased by 17 percent and 20 percent respectively in the three years following installation compared with the three preceding years. This reduction is in the context of a growing population, with collisions tracking upward within the District from 17,768 crashes in 2002 to 24,265 in 2015, while injuries have remained roughly constant in that same time period.[1] (Read more about speed cameras in D.C.)
Calculating residential segregation and the impact of moving violations
In order to understand the role that racial geography plays in traffic enforcement, I first had define a metric to quantify segregation, using the 2016 5-Year Estimates of the American Community Survey (ACS) at the census tract level. Then, I computed several quantities within these tracts, such as the number of moving violations and the sum of fines issued. Finally, I computed the sum of traffic collisions within each area as an additional check on the relative issuance of citations across the different tracts.[2]
Considering that nearly 90 percent of Washington residents identify as either “white alone” or “black alone,” I chose to focus my analysis on these groups specifically.[3] I then categorized all census tracts in D.C. based on their level of segregation by race: “80-100 percent white,” “60-80 percent white,” “Diverse,” “60-80 percent black,” and “80-100 percent black.” Each of these categories holds roughly one fifth of D.C.’s population (see below).[4]
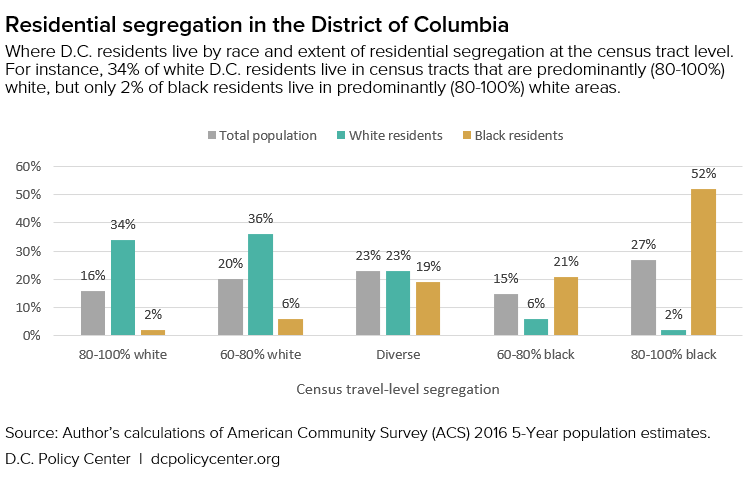
From a citywide perspective, 34 percent of white residents live in white-segregated tracts where more than 80 percent of the population is white, while 52 percent of black residents live in highly black-segregated tracts where more than 80 percent of the population is black. Conversely, only 2 percent of the city’s black population lives in tracts where at least 80 percent of the residents are white, and vice versa.
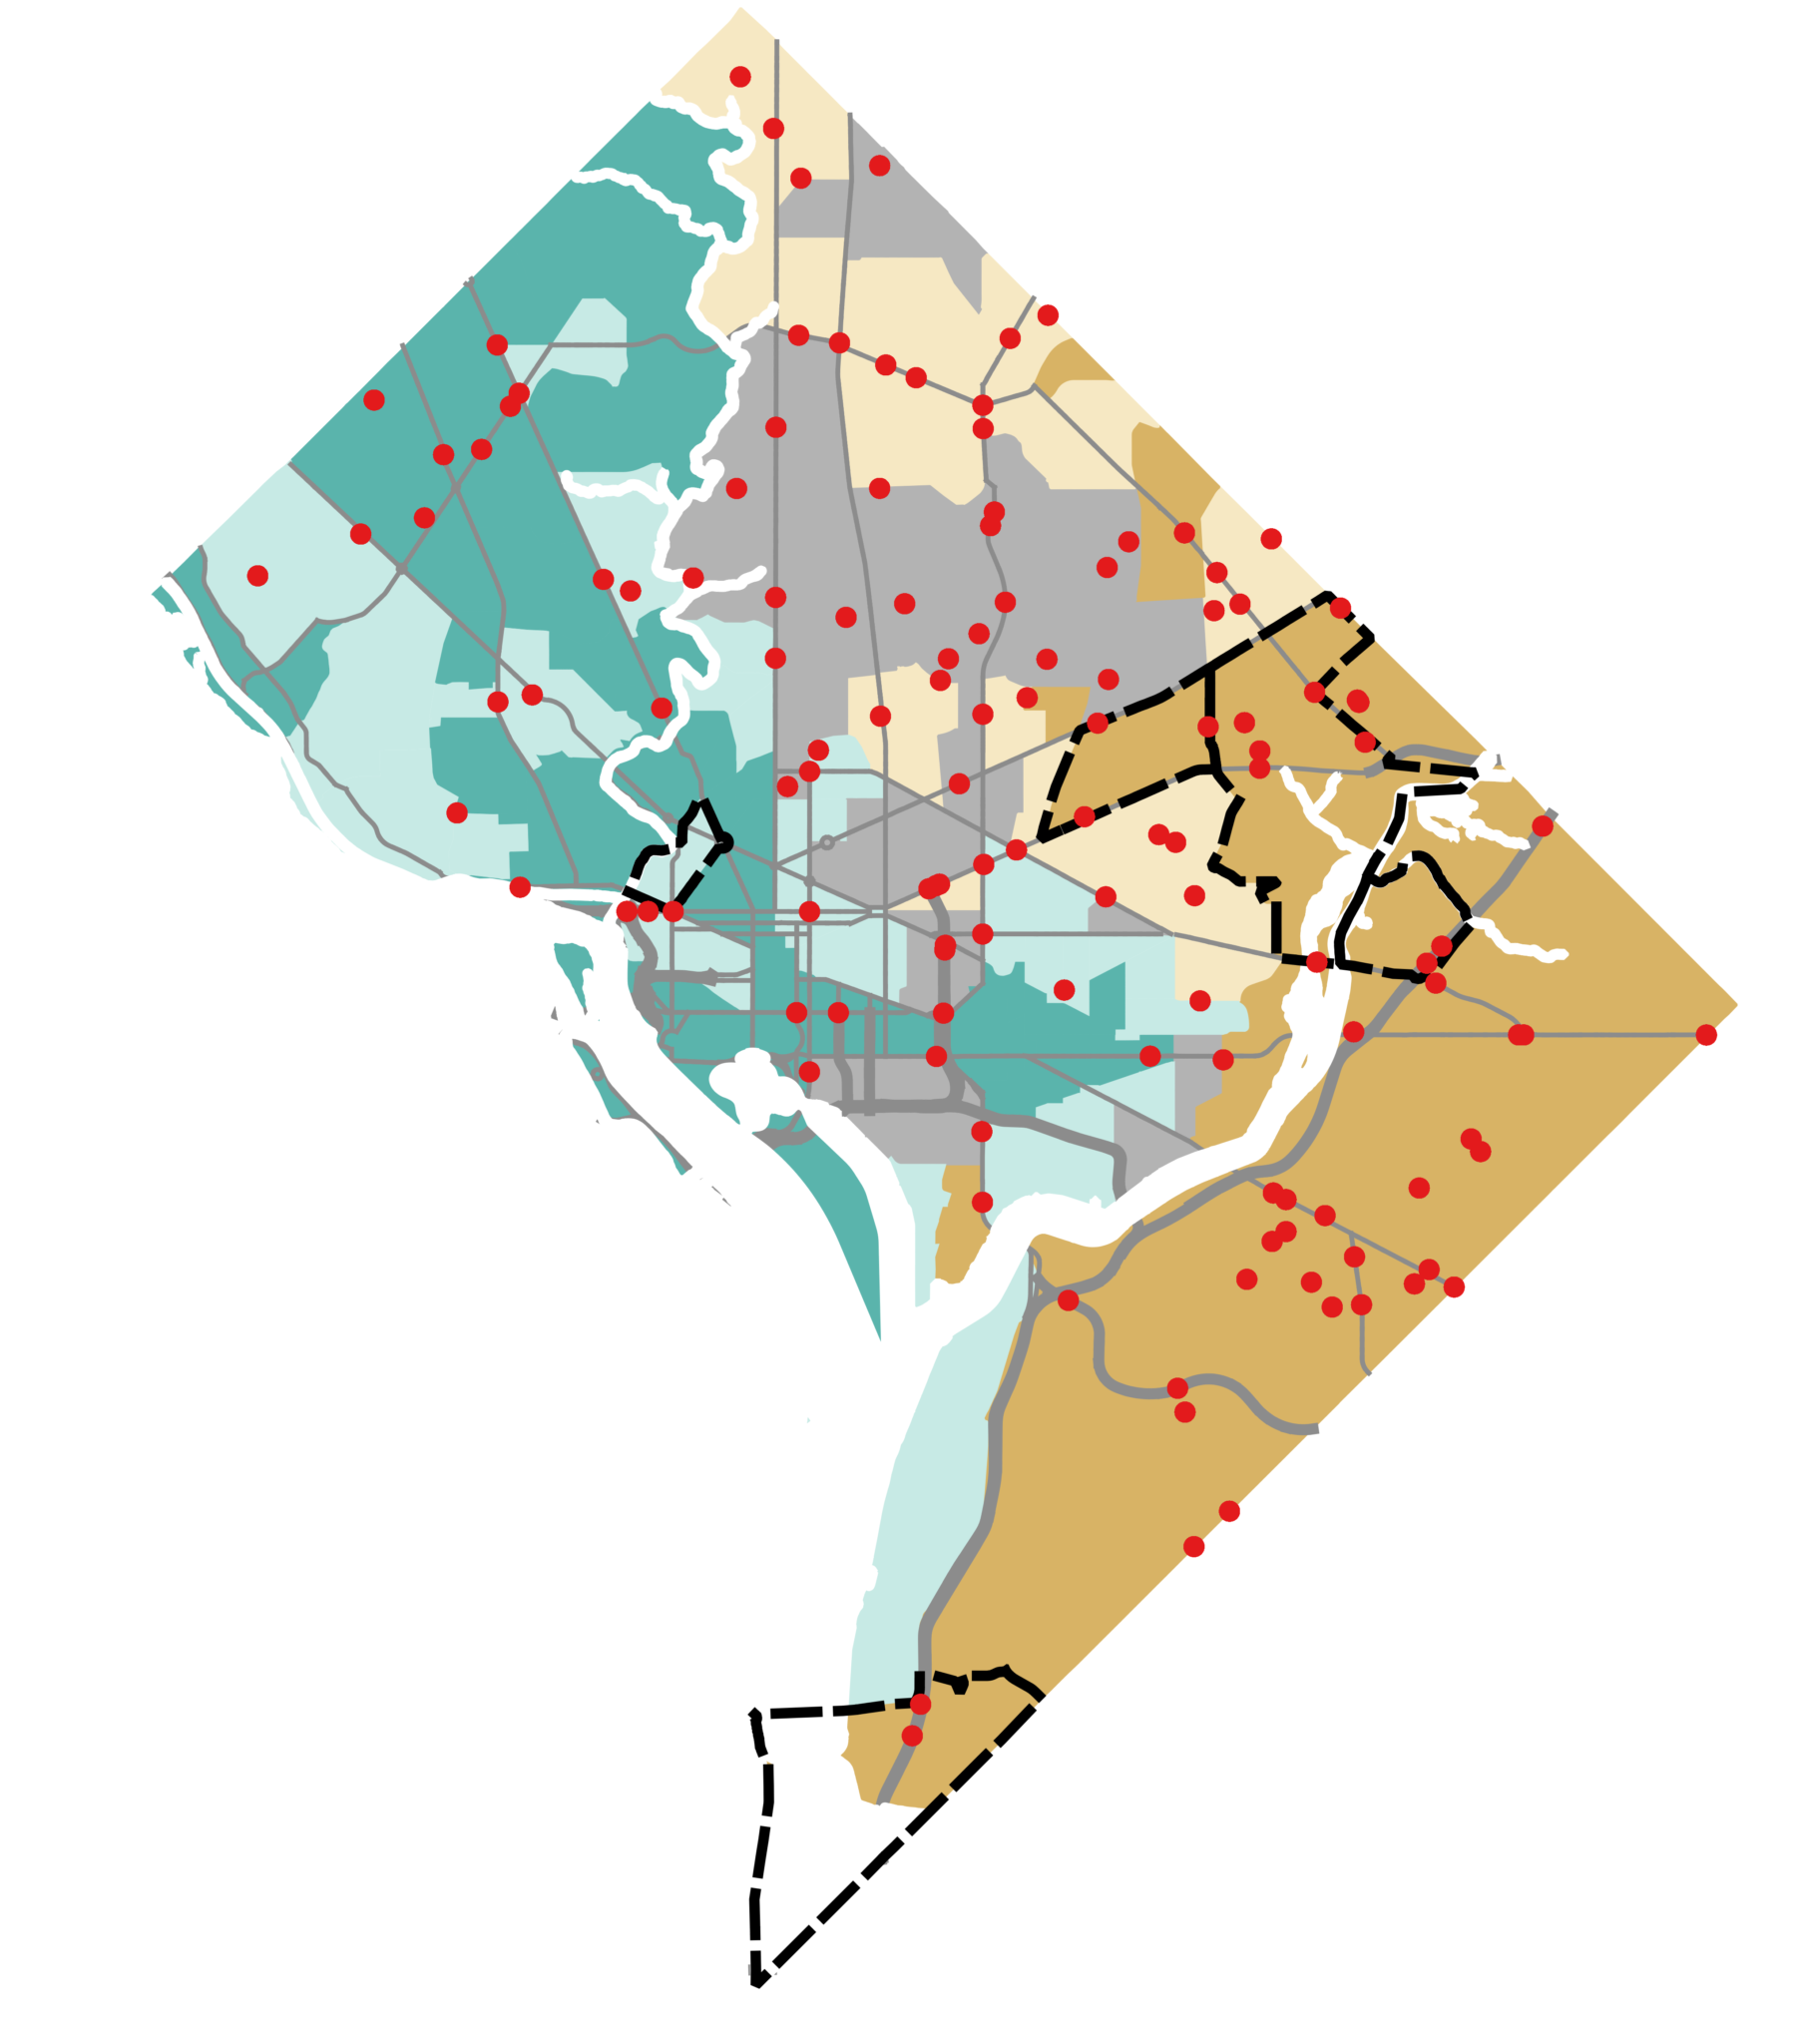
Using geospatial information available in the D.C. Open Data Portal, I then used QGIS to sum the numbers of moving violations, amount fined, and number of crashes in each census tract for the year 2016, the most recent year where a complete dataset exists for all variables. In this period the Metropolitan Police Department (MPD) issued 966,806 moving violations, which drew nearly $115 million in fines. Photo enforcement accounted for the overwhelming majority of citations (96 percent) and fines (97 percent). Considering the mostly stationary nature of photo enforcement and the high degree of racial residential segregation in D.C., even relatively small geographic disparities in enforcement can be magnified into large disparate impacts by race.[5]
Results: Drivers in predominately black neighborhoods receive more moving violations and higher fines
Upon analyzing these data at the census tract level, I found that drivers in black-segregated neighborhoods receive double the average number of moving violations per capita, while drivers within white-segregated areas receive just one eighth the average.
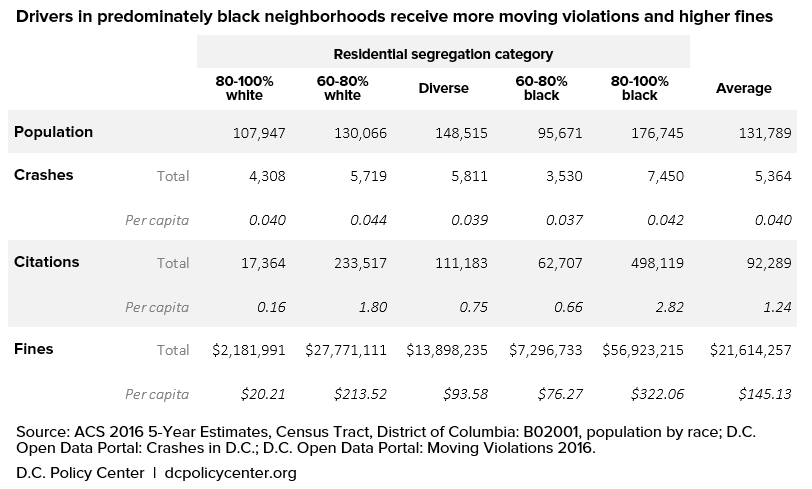
Put differently, a driver in a black-segregated area is over 17 times more likely to receive a moving violation (at a cost of 16 times more per resident) than in a white-segregated area.[6] Considering that each tract group represents a remarkably similar number of crashes per capita, this is quite an extraordinary disparity.
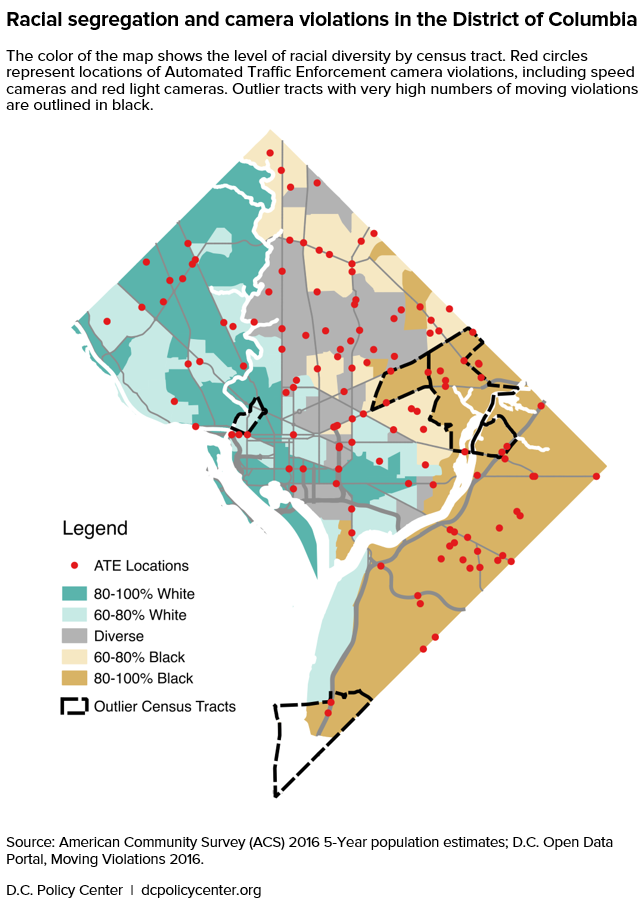
Further inspection reveals five outlier tracts which warrant closer inspection. Four of these outliers were found in 80-100 percent black tracts while one was found in a 60-80 percent white tract. Of course, by removing these extreme values, the remaining numbers in each racial category do fall much closer to the average. But notably, the number of citations and total fines per resident within black-segregated tracts remains 29 percent and 19 percent higher than the citywide average, even after removing the outlier locations. Meanwhile, the considerably lower numbers of citations and fines within 80-100 percent white census tracts remain considerably lower than average. (For a more in-depth discussion of the results and the effect of these outliers, please see the accompanying methods post on the D.C. Policy Center’s Data Blog.)
On average, each census tract had two traffic enforcement cameras; 97 percent of tracts have four or fewer. It was often the case that the results of outlier tracts were driven by a single camera producing an order of magnitude more citations than typical. Of the five outliers, one had cameras on I-295, which could be reasonably assumed to over-represent drivers from outside the neighborhood. However, the rest were located on arterial and local streets, which of course serve drivers from across the region, but would be expected to over-represent drivers local to the neighborhood.
Repeated violations and disparate outcomes suggest more interventions are needed
While traffic camera enforcement can be a useful tool in curbing dangerous driving behaviors, we should think carefully about their costs and their effectiveness. Ideally, we would expect to see an eventual reduction in citations as drivers respond to the disincentive of being issued a ticket. Data from New York City shows that speed camera locations saw an overall reduction in speeding by 60 percent within 18 months of camera installation, with only 19 percent of drivers ever receiving a second violation. Data available for D.C. do not tell us whether the same drivers are receiving multiple citations, but the chronic pattern of violations observed would suggest that there is a failure of street design that would require more direct intervention to address.
It is also troubling that so many of these outlier locations fall within black-segregated census tracts. And while chronic speeding violations certainly pose a grave danger to those living in that area, we should ask why a punitive remediation is sought rather than a restorative one. Because this analysis can only examine the demographics of the neighborhoods these citations were received in, not the demographics of the drivers themselves, we don’t know for sure that black drivers are being ticketed more than white drivers. But the data does suggest that this is something that D.C. should explore in more depth. In light of the District’s staggering racial wealth gap, where the median wealth of white families is 81 times higher than the median wealth of black families, there is also a greater likelihood of fines issued to black residents incurring excessive financial burden.
These data also show that the number of moving violations issued in white-segregated neighborhoods is much lower than average, even after removing outlier tracts. Yet the fact that the number of collisions per capita is similar in white- and black-segregated census tracts suggests that these streets in these predominantly white areas may not be not inherently safer than others. And while the current analysis can answer high-level questions about the racial component of traffic enforcement, additional data and analysis would be required to understand how street safety interventions are selected and funded, and if they are done so with an eye towards equity.
These disparities indicate that absent an affirmative effort to equitably site automated traffic cameras, a disproportionate burden of enforcement is likely borne within the District’s predominantly black neighborhoods. And while research shows that traffic cameras do reduce vehicle speeds, collisions, and injuries, this analysis highlights the racial inequities that can happen when a city relies too much on enforcement as a Vision Zero strategy.
This is not to say that laws enacted for the benefit of public safety should not be enforced. Driver error is cited as a contributing factor in nearly a third of D.C. crashes in 2015, and the likelihood of pedestrian fatalities doubles when speeds increase from 25 and 30 miles per hour.[7],[8] But we also know that historic underinvestment in communities of color has resulted in unsafe street designs that do not discourage speeding, and that the necessity of enforcement is often an indication of a street design that has failed to provide a safe environment for the people using it. At best, enforcement is a stopgap measure for the interim between identifying dangerous locations and remediating the infrastructure, perhaps even by earmarking the revenue raised from fines to fund structural safety improvements along that very corridor.
At a minimum, DDOT and MPD ought to do more to incorporate the disparate racial and economic impacts of camera enforcement into their siting criteria. Better yet, revenue from cameras could be used to create permanent safety improvements. Such a measure may even improve public trust in the system when residents witness the funding induced by dangerous street design reinvested to make the community safer—at which point the camera can be relocated to the next dangerous location. Finally, in a city with such profound wealth disparity, authorities should consider a progressive fining scheme scaled to income so that the consequences of dangerous driving are not disproportionately borne by the District’s poorest residents.
Engineering safer streets might take more time and political effort, but it’s ultimately the best way to equitably reduce traffic fatalities and make D.C.’s streets safer for all residents. Enforcement has a role to play, but it can’t compensate for fundamental design issues—and at worse, it can worsen existing racial and economic inequities.
About the data
Data sources:
- Demographic data: ACS 2016 5-Year Estimates, Census Tract, District of Columbia: B02001, population by race
- Crash data: DC Open Data Portal: Crashes in D.C.
- Moving violations: DC Open Data Portal: Moving Violations 2016
For a more in-depth discussion of the analysis approach and results, please see the accompanying methods post on the D.C. Policy Center’s Data Blog.
Notes
[1] DDOT Traffic Safety Report Statistics. Despite increasing population growth in that time period (19%), collisions grew faster (37%). Notably however, fatalities have halved from 50 to 26 in the same time period. Regardless, crashes have fallen at camera locations amidst the same context.
[2] Many metrics for quantifying racial segregation have been used in research, including the index of dissimilarity and various indices of isolation. However, the purpose of these metrics is usually to aggregate the racial composition of subareas into a single value which can be compared across different cities. The constituent values for these metrics are not sufficiently meaningful to compare the degree of segregation from one tract to the next. For this reason, I chose to divide the tracts into categories defined by simple percentages of racial composition based on the 2016 5-Year Estimates of the American Community Survey (ACS) at the census tract level.
[3] This analysis does not include Hispanic origin in the segregation analysis. Within this dataset, 10.5 percent of all D.C. residents identify as Hispanic in a question separate from the “race” categorization (“White”, “Black or African American”, “American Indian and Alaska Native”, “Asian”, “Native Hawaiian and Other Pacific Islander”, and “Two or more races”.)
[4] One census tract was not considered for analysis due to a population lower than the estimate’s margin of error.
[5] Moreover, this investigation is interested only in the outcome of where a summons was issued and the demographics of that location. Whether the cameras are moved intermittently is immaterial so long as the location is correctly geocoded at the time of the violation.
[6] This analysis only looked at citations and fines in the context of the surrounding neighborhood, not individual drivers. Therefore, the analysis cannot take traffic levels or drivers’ demographic characteristics into account. Presumably, the number of drivers is proportional to the lane mileage in each tract, which was similar across all tracts, per capita.
[7] Traffic Safety Statistics Report for the District of Columbia (2013-2015), Table 4.27. Prepared by the Howard University Transportation Research Center for the District Department of Transportation. December 2016.
[8] Erik Rosen and Ulrich Sander, “Pedestrian fatality risk as a function of car impact speed.” Accident Analysis & Prevention. Volume 41, Issue 3, May 2009, Pages 536-542
William Farrell is a Transportation Engineer living in Brooklyn, NY. He received his Bachelor and Master of Engineering degrees from McGill University in Montreal, QC, for civil and transportation engineering, respectively. He now works for a civil engineering consulting firm in New York, NY and sits on the Advisory Board of the Tri-State Transportation Campaign. He blogs at transpophile.com and tweets at @wjfarr.