
If you follow the latest articles on workforce development, you might be forgiven for thinking that the big question today is whether a robot will take your job, or which specific skills workers should learn in order to survive this automation apocalypse.
It is true that technology is transforming the nature of work in entire sectors in real-time, with major implications for workers and employers. But for all the forecasts about the “skills of the future,” the main takeaway from all the research is that the most successful workers will be those with a solid foundation who can adapt to a rapidly-changing skills environment—while those who cannot are likely to be left behind.
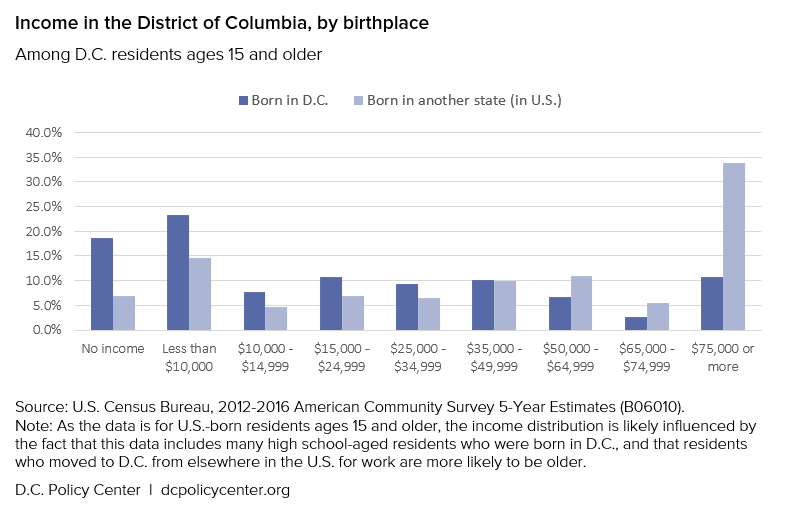
While it’s useful to think about the future of work, many of the present-day workforce challenges are centered around those who are already being left behind. In the District of Columbia, employers draw workers from all over the United States (and the rest of the world) to fill high-skill, high-paying jobs, but few local residents are able to benefit from this job market. Among all D.C. residents ages 15 and older who were born in the District, only about one in ten earn $75,000 or more per year, compared with one in three residents who moved here from other parts of the U.S.[1]
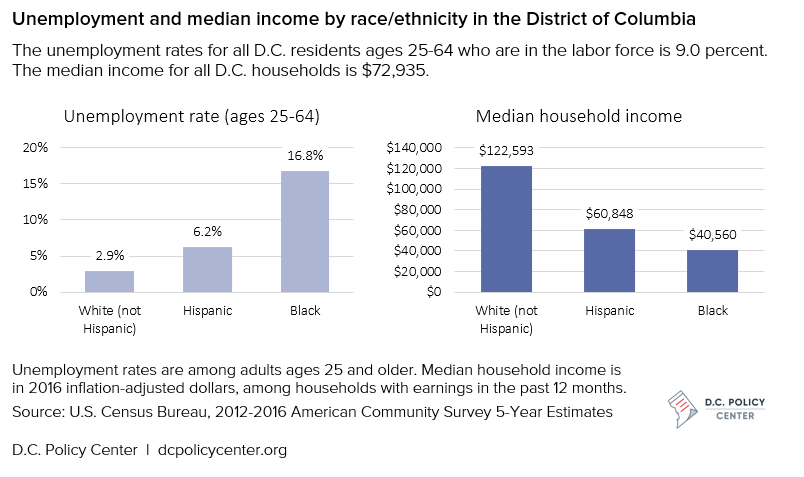
Income disparities are also stark when examining employment and income patterns by race and ethnicity, regardless of birthplace. Among white (non-Hispanic) residents in D.C., the unemployment rate is 2.9 percent, and the median income is $122,493. Among black D.C. residents, the unemployment rate is 16.8 percent, and the median income is $40,560.[2]
In D.C., as in many places, networks of non-profit organizations, local, state, and federal authorities, and higher education institutions work to connect job-seekers to employers and sustained employment. In many cases, workers may need basic training in literacy and numeracy, as well as life skills. They may also face challenges related to transportation access, housing stability, and family caregiving needs, which further reduce their ability to find and maintain employment. Successfully connecting D.C.’s jobseekers with stable and quality employment will take much more than training a person in a skill and sending their resume to the right employer.
Instead of trying to forecast specific skills, then, we ask: How do we move people into the jobs and career pathways for them to live a life of independence, self-sufficiency, and pride? What barriers do vulnerable job-seekers face in the District of Columbia, and how can public and private actors help address them?
1. Improve the initial experience with school and the pipelines for adult learners
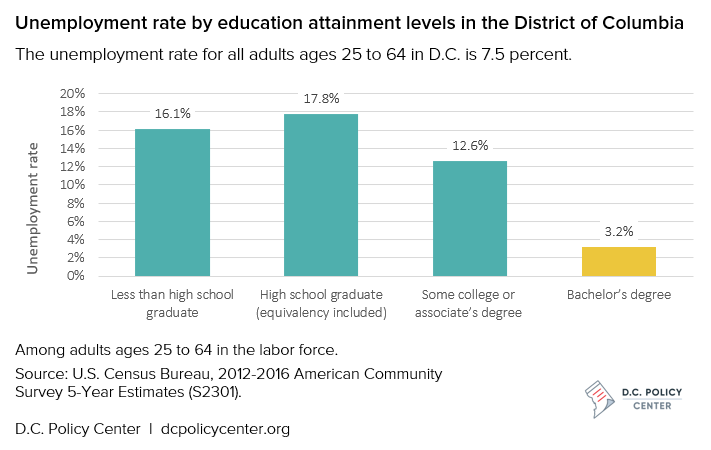
Today’s job market requires a solid education foundation, and often advanced degrees or credentials. According to the US Census Bureau, a review of D.C.’s 50 High-Demand Occupations from the Department of Employment Services shows that a Bachelor’s degree or higher is necessary for more than 70 percent of the listed jobs. Among D.C. residents ages 24-64, approximately 58 percent have a Bachelor’s degree or higher; the unemployment rate among residents in this group is 3.2 percent. For residents with lower levels of education, the picture is much darker: the unemployment rate is 17.8 percent among those with only a high school degree, and 12.6 percent for those with just some college experience.[3] Only 17 percent of residents in Ward 7 and 15 percent of residents in Ward 8 who are 25 years or older possess a Bachelor’s degree of higher,[4] and both Wards have had high rates of unemployment for over a decade.[5]
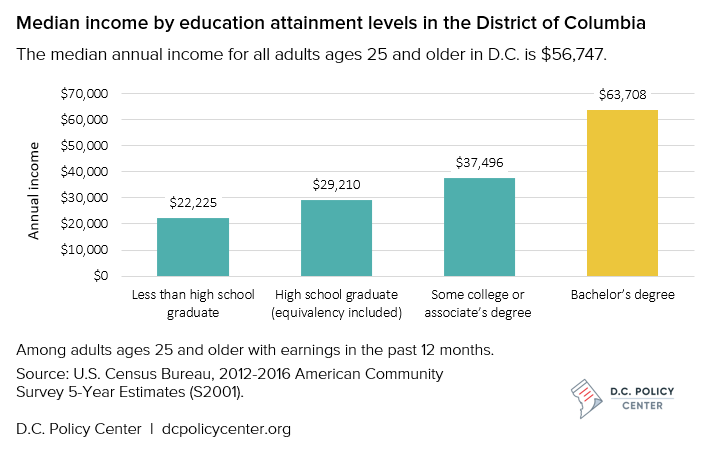
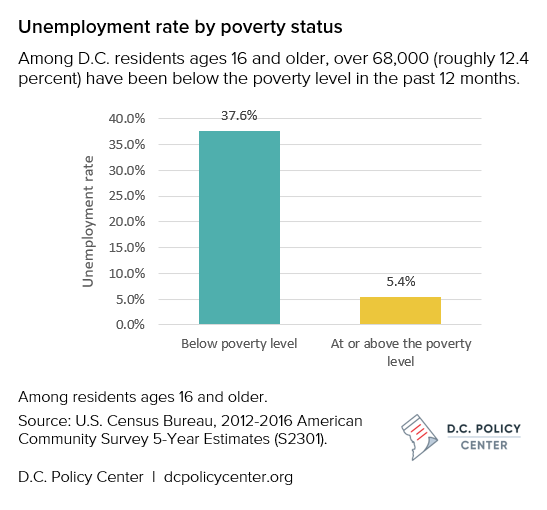
Those with a high school diploma or less stand to remain low-paid and uncompetitive in a city that attracts highly educated talent from the rest of the county and the world. According to the 2012-2016 American Community Survey, 24.3 percent of D.C. residents who have not attended college have lived below the poverty line in the past year; among those with some college education, 17.3 percent of them lived below the poverty line. These numbers are in stark contrast to the 5.5 percent of those in poverty with a baccalaureate or higher in D.C.[6] As the following chart shows, the median income in D.C. for adult with a college degree ($63,708) is more than twice as high as the median income for those who have only graduated high school ($29,210).[7]
Improving education, training, and skills among some of the lowest-resourced members of the D.C. workforce requires a very nuanced approach. While learning is lifelong, a child’s initial experiences with school and education sets up a lifelong learning and earning trajectory. Providing quality education in early childhood, for instance, is cost effective in the long run, and allows for the educational continuum to address and work with those who need assistance at later stages. It is also important to improve the learning outcomes in the District’s public schools and public charter schools to help children and youth grow up to be fully engaged and learned citizens.
Every year brings new research that identifies specific skill gaps among the local workforce, or future areas where skill demand is expected to outstrips skill supply. To address these gaps, D.C. needs more than training programs that address the latest new skill or technology; instead, the District needs to build robust adult learning pipelines that are cost effective and accessible, and that can engage learners across the life-span. By strengthening initial schooling, ensuring equitable and equal access to quality education, and linking classroom skills to employability, policymakers can create new and improved spaces for learning and economic success for all.
2. Improve policy supports for returning and incarcerated citizens
Many D.C. residents lack access to the area job market due to criminal convictions or an arrest record; at least 15,000 returning citizens in D.C. are monitored by the Court Services and Offender Supervision Agency (CSOSA). Data show that over 70 percent of D.C.’s returning citizens in community supervision are unemployed,[8] and two-thirds of returning citizens recidivate within three years.[9]
D.C.’s lack of a local prison system makes reentry particularly difficult, as residents who are incarcerated are held in federal prisons across the United States that offer very little to prepare them for life after they complete their sentence. Each year, thousands of formerly incarcerated residents are returned to their D.C. neighborhoods, and in many cases, have not had opportunities to build very skills to access and persist in the labor market.[10] As such, their employability, or their ability to secure and persist in subsidized or unsubsidized employment, requires wrap-around services.
Under D.C. law, employers are not allowed to ask applicants about arrests or criminal convictions during the interview process, but this does not mean that the hiring process is free from bias. Most employers in the D.C. area (including the federal government and private businesses) have not yet created enough economic spaces for returning citizens to successfully attach to employment, persist in employment, and continuously earn a living wage. Therefore, one way to support returning citizens is to incentivize employers who hire, train, and retain these persons. The private sector in D.C. creates and/or holds 70 percent of all jobs,[11] and could work with governmental agencies and anchor institutions to create and execute such programs.
In addition, returning citizens face impediments in obtaining certain business licenses, accessing financial funding for business ventures, and accessing financial aid at post-secondary learning institutions. As such, policy could work to increase opportunities for these persons to, among other activities, become entrepreneurs themselves. By enabling opportunity for some of our most vulnerable residents, D.C. could activate a wave of change that could inform other jurisdictions across the country.
Finally, another avenue would be to help incarcerated individuals earn portable and workplace-ready credentials while still in prison. It is important to keep our incarcerated population healthy, current, and prepared to engage with a world that they may return to – thus enabling economic resilience while diminishing the probability of recidivism.
3. Connect health policy with other policy areas for a holistic approach
D.C.’s African American communities face many overlapping and interconnected barriers. For example, residents in Ward 7 or 8 are more likely to suffer from high blood pressure, diabetes, cancer, or other chronic diseases as opposed to other D.C. residents.[12] Further, higher-income D.C. residents are also more likely to report fewer unhealthy behaviors and have better health outcomes than lower-income residents. Poor health can be a potential result of poverty or unemployment, as well as a cause: if one is chronically or persistently ill, attachment to work can be fractious and inconsistent at best. This is a particularly difficult matter for certain under-resourced individuals, such as some returning citizens, who may have an undiagnosed mental health or physical issue.
There is ample research on health disparities in the District of Columbia which speak to environmental, social and economic correlates to health outcomes. The activities and goals of health policy are therefore connected to housing policy, educational policy, and economic policy – whether on a ward or District level. A nuanced, collaborative and holistic approach to evaluation can drive policy derivation, or at minimum, integrate reporting approaches and drive positional cohesion amongst policymakers and legislators.
4. Insist on creating opportunities for low-income residents and those who are persistently/chronically unemployed
Unhelpfully, poverty itself can be a barrier for many low-income residents seeking stable employment. It is very expensive to be poor: Lower-income families and adults spend a higher percentage of their income on housing and transportation, and, with only four American Job Centers scattered throughout D.C., the costs of looking for a job can be quite expensive. Wards 7 and 8 have the lowest median household incomes in the District, while also reporting the highest poverty rates (27.7 percent and 36.8 percent, respectively)[13]; these are also the neighborhoods with the longest commutes and circuitous public transit infrastructure. Furthermore, online job listings and other digital resources may be especially difficult for some low-income job-seekers to access, due to the expense or low levels of digital literacy.
In a similar vein, chronic unemployment, or unemployment of 27 weeks or more, has a devastating effect on families, children, and adults. When work disappears, it may lead to housing insecurity, issues with the criminal justice system, and physical and mental health issues. However, chronic unemployment itself can be a barrier for job searchers, as employers are sometimes less willing to hire workers who have large gaps on their resume.
Creating opportunities for low-income residents and those who are persistently or chronically unemployed starts when a child is born, continues when they are in the educational pipeline, and persists through the life-cycle. However, one concrete action local businesses can take is to form councils that specifically address poverty and chronic/persistent unemployment in certain areas. Working together, local businesses can assess their capacities to hire and train local workers and commit to hiring from specific pools of populations, such as older workers, returning citizens, or citizens that reside in certain neighborhoods. Employers can target certain neighborhoods for specific hires, commit to certain standards (such as paying a living wage), and ultimately engage with communities in a real way to alleviate unemployment. Finally, these local employers could use the council to address, if possible, other correlational issues that impact community unemployment patterns (i.e., housing, education, physical and mental health, etc.) with community involvement and active engagement.
About the data
The data used in the charts and for much of the analysis in this article are from the U.S. Census Bureau, 2012-2016 American Community Survey 5-Year Estimates. See individual charts and footnotes (below) for specific variable and geography for each data point.
Notes
[1] Place of birth by individual income in the past 12 months (in 2016 inflation-adjusted dollars) in the United States, among those 15 years and over (B06010). U.S. Census Bureau, 2012-2016 American Community Survey 5-Year Estimates. Note: This income distribution is likely influenced by the fact that this data includes many high school-aged residents who were born in D.C., and that residents who moved to D.C. from elsewhere are more likely to be older.
[2] Income: Median income in the past 12 months (in 2016 inflation-adjusted dollars) (S1903). U.S. Census Bureau, 2012-2016 American Community Survey 5-Year Estimates. Unemployment rate: Employment status (S2301). U.S. Census Bureau, 2012-2016 American Community Survey 5-Year Estimates.
[3] Employment Status (S2301): Educational attainment among residents ages 25-64, U.S. Census Bureau, 2012-2016 American Community Survey 5-Year Estimates.
[4] District of Columbia State Data Center, 2012-2016 ACS Key Demographic Indicators.
[5] District of Columbia, Labor Force, Employment and Unemployment Rate by Ward, Annual Averages, 2002 – 2016.
[6] Poverty status in the past 12 months (S1701). U.S. Census Bureau, 2012-2016 American Community Survey 5-Year Estimates.
[7] Median earnings in the past 12 months (in 2016 inflation-adjusted dollars) by sex by educational attainment for the population 25 years and over with earnings (S2001).U.S. Census Bureau, 2012-2016 American Community Survey 5-Year Estimates.
[8] Marina Duane and Emily Reimal, “Locked up and left out: Returning citizens struggle to find work in Washington, DC.” The Urban Institute. August 4, 2017.
[9] Kiminori Nakamura and Douglas Weiss, “Measuring Recidivism in the District of Columbia.” Criminal Justice Coordinating Council of the Government of District of Columbia. February 20, 2012.
[10] “Beyond Second Chances: Returning Citizens’ Re-entry. Struggles and Successes in the District of Columbia.” Council for Court Excellence. December 12, 2016.
[11] Example: Work Opportunity Tax Credit: Eligible New Hires. Bureau of Statistics, United States Department of Labor. See also www.dcnetworks.org.
[12] District of Columbia Community Health Needs Assessment, 2016. DC Health Matters.
[13] Poverty status in the past 12 months (S1701) for Ward 7 and Ward 8. U.S. Census Bureau, 2012-2016 American Community Survey 5-Year Estimates.
Feature image by Ted Eytan (Source).
Dr. Bruce Ormond Grant is a scholar who writes about issues of equity and social justice across life spaces. He holds a Ph.D. in African Studies and Research from Howard University, an M.A. in Experimental Psychology from Brooklyn College, and an M.A. in Organizational Psychology from Teachers College, Columbia University.