D.C. is often referred to as a city where a car-free lifestyle is a distinct possibility. The real estate service Redfin recently rated D.C. as the fourth best U.S. city to live in without a car. Several organized citywide initiatives, such as Car-free Day and Bike to Work Day, promote car-free commutes. The D.C. Council is also considering a bill that would require employers to offer transit benefits or cash in lieu of parking subsidies.
A car-free lifestyle in D.C. has many benefits, both for the individual and for the city. It can lower household commuting costs and promote a healthy lifestyle. It can reduce citywide traffic congestion, increase accessibility for businesses, and help the city meet its goals in reducing greenhouse gas emissions. However, for some residents, getting around the city without a car may be easier said than done.
The Car-Free Livability Index
To assess the ease of switching to a car-free lifestyle, I’ve developed a Car-Free Livability Index—a simple scale that shows whether or not a D.C. neighborhood supports a car-free lifestyle. The index incorporates relative walk-ability, bike-ability, and public transit scores using data from Walk Score, as well as average availability of private transit services such as Car2Go and taxicabs. (For more details about how the Index was created, see the “About the data” section at the end of this piece.)
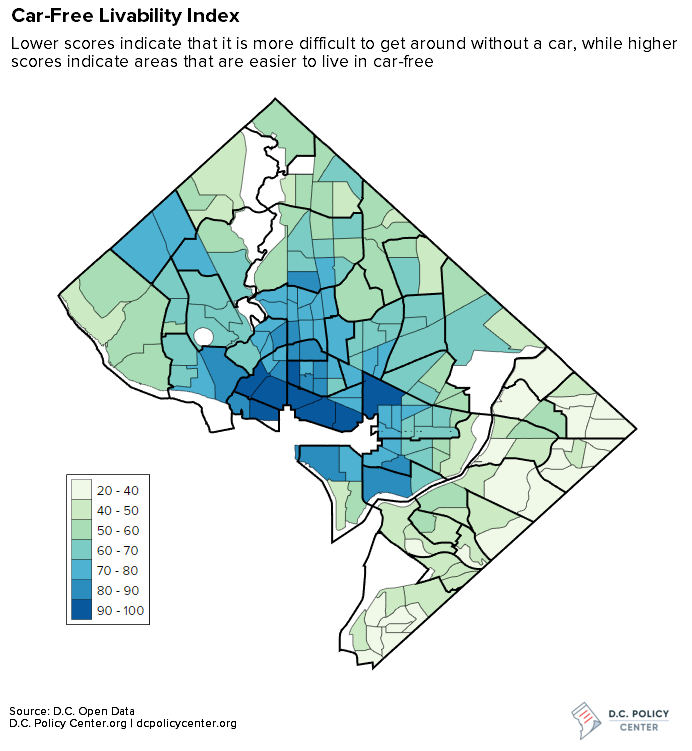
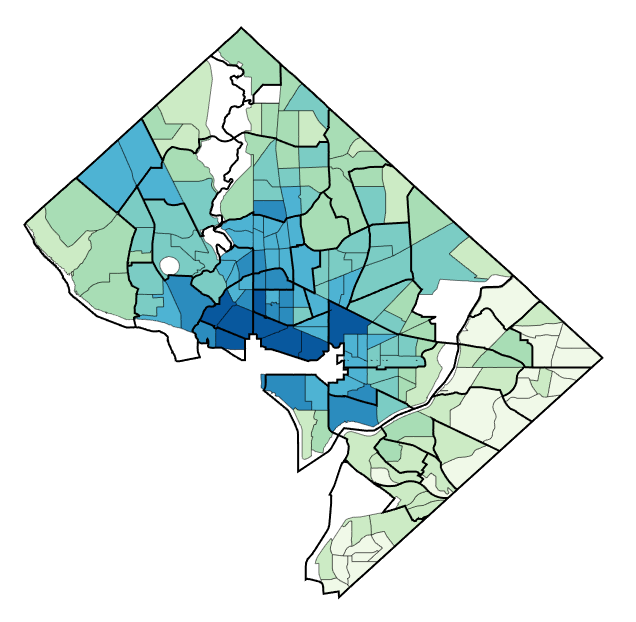
The map above illustrates the range in car-free livability values throughout D.C., with higher scores showing areas that are likely relatively easier to live in without a car. Scores are highest in central areas such as Chinatown (96), Dupont Circle (93), and Logan Circle (92), where the abundance and density of public transit and on-demand rental options make it relatively easy to live and work without owning a car. At the ward level, residents are much more likely to walk or bike to work in these areas, with an average commute time of 24 minutes for residents living in Ward 2 (compared with 31 minutes for the entire city).
Meanwhile, the lowest scores are concentrated in neighborhoods to the south and east, specifically in neighborhoods such as Kenilworth (29.1), Burrville (29.5), and Benning Ridge (29.6). However, at the ward level, residents in Wards 7 and 8 are still only somewhat more likely to drive to work than take public transit, and face average commute times of 35-36 minutes. While “car-free” implies a positive decision to live without a car, the lack of reliable transportation alternatives in these areas means the absence of a car can compound other hardships, potentially lengthening residents’ commutes and reducing access to grocery stores and other amenities.
The demographics of car-free living
As the Car-Free Livability Index map suggests, “car-free living” isn’t always a lifestyle choice. Due to the landscape of racial and socioeconomic divides that persist in the city, many D.C. residents are forced to live car-free because of circumstances beyond their control despite also lacking sufficient and reliable access to other transportation options.
Median income
A look at median household incomes across the car-free livability index confirms that households with lower median incomes tend to live in areas where car-free living is less supportable. In fact, median incomes among residents in mid- to high-score areas (60 to 100) are more than double those of residents in low-score areas (20 to 40).
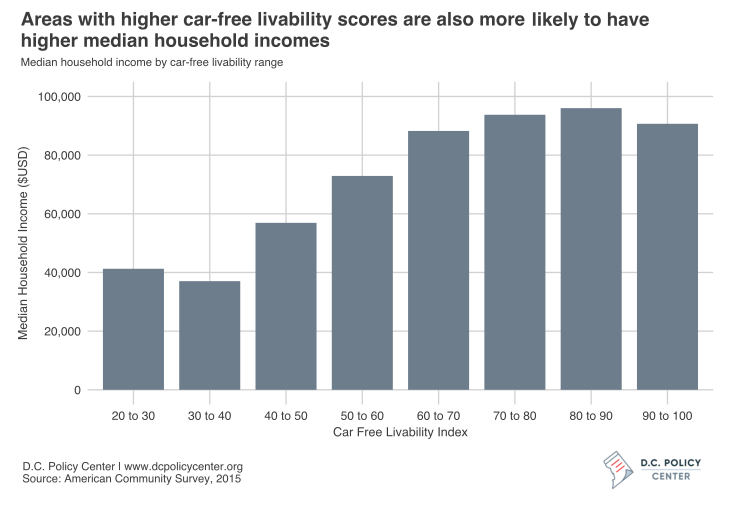
The disparity in scores is manifest during periods of severe weather and interruptions to public transportation, like WMATA’s SafeTrack, for example. When these interruptions hit, private transit and on-demand services are theoretically an option, but may not be economically sustainable for many low-income households.
Household size
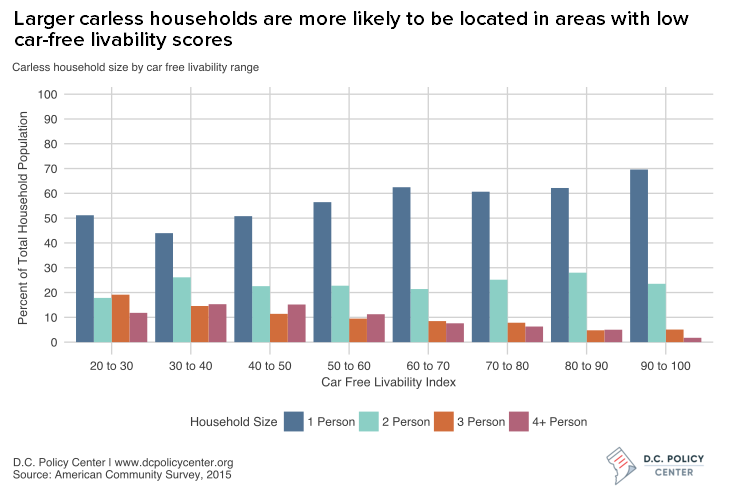
Household size can also add stress to car-free households. Children in a family may attend multiple schools across the city, and adult family members may head in opposite directions for work, education, or training; the amount of planning, forethought, and reliance on local infrastructure can be overwhelming.
The data reveals that larger households that don’t have a car are more likely to live in areas with lower car-free livability scores, while smaller car-free households are more likely to live in neighborhoods with higher car-free livability scores. This could be related to the small stock of multi-bedroom housing in D.C., as larger rental and condo options are in limited supply in areas that are easy to live in without a car. The result of these findings suggests that larger families are often pushed to areas with lower car-free livability scores in search of appropriate housing.
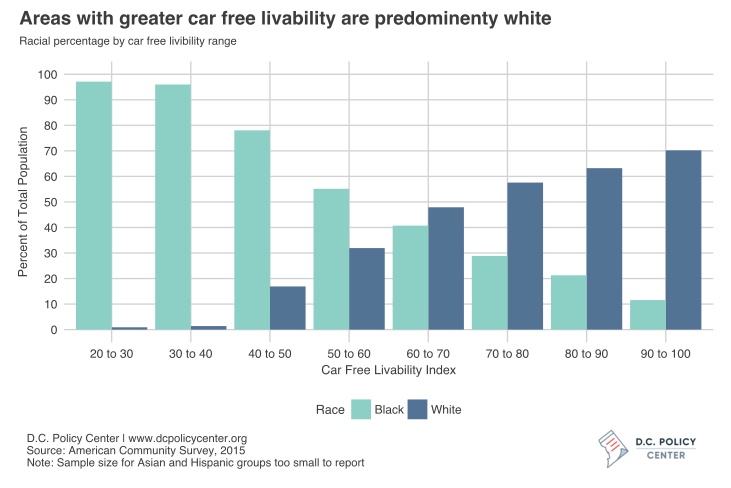
Race and ethnicity
As suggested by the car-free living index map, neighborhoods with low proportion of white residents are disproportionately likely to have low car-free livability scores. The chart below shows a clear trend that as car-free livability index scores rise, the percentage of black residents in those areas decreases (and the percentage of white residents increases). Due to sample size limitations, it is not possible to display data for Hispanic and Asian residents.
Conclusion: Car-free living starts with car-free infrastructure
There is an obvious disparity in car-free infrastructure throughout the city. While it makes sense that the economic heart of the city should also be an area where a car-free lifestyle is easily achieved, the focus needs now to be an investment in car-free infrastructures in neighborhoods which low car-free live-ability scores. This includes improving bus routes and metro service, as well as improving sidewalks, increasing mileage of bike lanes, and improving access to low-cost bike rentals.
While some of these changes can be relatively simple, the relative lack of reliable public transit options seems the largest hurdle to improving the lives of many of the cities car-free residents (whether they are car-free by choice or not). The rollback of Metro’s off-peak hours and other service cuts are likely to decrease the feasibility of living without a car and add to current economic stresses already faced by communities with the lowest car-free livability scores.
About the data: How the Car-Free Livability Index was created
The Car-Free Livability Index is a simple scale that shows whether or not a D.C. neighborhood supports a car-free lifestyle. The index incorporates relative walk-ability, bike-ability, and public transit scores using data from, as well as average availability of private transit services such as Car2Go and taxicabs and presence of bikeshare stations:
- Composite Walk/Transit/Bike Scores were weighted to 60 percent. Walkability, transit, and bike data came from Walk Score.
- Taxi and Car2Go usage was weighted to 30 percent. Taxi data was based on pick-up data from Open Data DC for the first half of 2017, and Car2Go data came from the company’s API service.
- Presence of Capital Bikeshare Stations was weighted to 10 percent. While the recent addition of dockless bikeshares may influence the presence of bike rentals somewhat in the future, the modest initial rollout of dockless bikes and relatively stable locations of Capital Bikeshare Stations suggest this is an appropriate proxy for the near future.
Deciding the exact weighting of each of these factors was based on a survey of literature indicating the importance of various factors in creating car-free cities (Source 1, Source 2, Source 3), but in the end creating such an index involves a certain level of subjectivity. Also, some factors will matter more to some residents than others, based on personal circumstances and general preferences; however, together these factors combine to serve as a starting point for a discussion about car-free livability in the District of Columbia.
Other data sources
Demographic data was derived from the U.S. Census Bureau’s American Community Survey (2015) and retrieved via the U.S. Census Bureau’s API service. Individual variable IDs can be found on lines 26 – 41 in the analysis code:
- B19013: Median household income in the past 12 months (in 2015 inflation-adjusted dollars)
- B08201: Household size by vehicles available
- B08141: Means of transportation to work by vehicles avaliable
- B02001: Population by race
- B03002: Populaton Hispanic or Latino origin by race
Code
The code for all the analysis and visuals in the piece is available on my Github.
D.C. Policy Center Senior Fellow Randy Smith is a Geographic Information Systems (GIS) Specialist, and has an MSc in Geospatial and Mapping Science from the University of Glasgow. He has a passion for maps, baking, and running. He lives in Tenleytown with his wife. For more about his current projects, visit www.rhsmithjr.com.