
As remote work is taking hold, it is breaking the relationship between where people live and where they work. Historically, proximity to work has been a key driver of population growth in the District of Columbia. And commuters have been an important source of economic activity, both supporting the local service economy and sustaining the demand for office space.
This brief is the first in a two-part series focused on better understanding how remote work will impact the District’s future. Part one identifies 1 ) how the geography of work might shift if remote eligible workers continue to work from home, 2) how often workers will continue to work from home post-pandemic, and 3) how many of the region’s workers are eligible to do so.
We find that of the nearly half a million commuters who used to travel to the city daily, 155,500 have jobs that can be worked remotely. Their continued absence from the city can permanently impair the demand for local services, especially in office-heavy downtown areas. In addition, 110,000 D.C. residents have jobs that can be worked remotely, regardless of where they work. If they largely work from home, economic activity will increasingly shift to mixed-use or residential neighborhoods. These trends present both challenges and opportunities for the District as the city continues to recover from the pandemic.
This is part 1. Read part 2 of this report here.
This report is a publication of the D.C. Policy Center’s Alice M. Rivlin Initiative for Economic Policy & Competitiveness, which provides an in-depth and objective look at the factors that influence the District of Columbia’s attractiveness and competitive position in the region and the nation.
We wish to thank Quadrangle Development Corporation, Ruben Companies, Tishman Speyer, and the Kimsey Foundation for their support of the Rivlin Initiative’s work.
Introduction
As pandemic-related restrictions are lifted and offices reopen, many people are now working remotely by choice rather than necessity. That is, remote work is here to stay and it is severing the relationship between where people live and where people work. This has implications for the District’s attractiveness, competitiveness, economic growth, and fiscal health.
Historically, the District’s population growth has been driven primarily by jobs: Between 2000 and 2014, 42 percent of those who moved to D.C. did so because of a career change, 14 percent did so to attend college, 10 percent to ease commute time, and five percent for other job reasons.1 Of the 810,000 people who worked in a D.C. business establishment in 2019, over half a million commuted to D.C. from somewhere outside of the city.2 The District’s economy has benefited greatly from the presence of commuters. For example, the local service economy (retail, restaurants, personal services), which often supports office workers, was one of the largest sources of job growth prior to the pandemic.
With the rise of remote work, workers no longer have to live nearby, or even visit, their workplaces. This results in domino effects on the city’s population growth, local service economy, demand for office space in the city, and public transportation, all of which are closely tied to the District’s economic strength and key revenue sources: sales, property, and income taxes.
To remain vibrant and competitive in this changing economic environment, the city will need to adapt to shifting worker preferences. Understanding how the rise of remote work will impact the District’s economy will be a key step in the city’s adaptation to these changes.
However, while we know there is a growing preference for remote work, there are still a lot of uncertainties. We do not know, with certainty, how many workers will shift to a permanent remote or hybrid work arrangement. We do not know the extent to which remote work will alter where workers prefer to live, and how these preferences will shape the District’s long-term population and jobs growth. But emerging population and commuter trends, along with pre-pandemic data, can help us understand how the geography of work in the region might shift, and what this might mean for the future of work, commuter patterns, and household migration in the region.
Remote work presents both challenges and opportunities to the District. Better understanding its impacts offers some foresight into how demand for the city’s space might change, how economic activity will shift, and how to maximize future revenue under changing conditions.
Remote work and cities: what other researchers have found
Recent research on remote work shows that as remote work takes hold, it is changing what workers and employers want at the workplace, and where people want to live and work. The impacts are disparate across workers and geographies, and the emerging trends generally favor lower-cost places over higher-cost cities like the District and Washington metropolitan region.
Remote work is baked into both employer and employee expectations.
Prior to the pandemic, across the nation, approximately 5 percent of workdays were worked fully from home.3 National survey data show that workers who can work from home want to continue to do so for three days a week, whereas employers are generally planning for three days in the office.4 That is, even among employers, the expectation is that workers who can successfully do their work from their homes will continue to do so through a significant portion of the work week.
Remote work is most common in industries with better pay and highly-educated workers.
This reflects the Washington metropolitan region. Researchers estimate that 37 percent of jobs in the U.S. can be performed at home, compared to 51 percent in the Washington metropolitan area. These jobs account for 64 percent of the salaries received in the region.5 A review of job openings shows that remote work is commonly offered as a perk, especially for jobs that pay over $80,000 per year,6 and employers are increasingly looking for skills that are particularly important when one is working remotely, such as time management, self-motivation, and strong communication.7 And despite concerns surrounding remote work (reduced collaboration, corporate identity, and knowledge sharing), managers believe offering remote work flexibility is key to talent attraction and retention in the future.8
Highly paid and highly educated workers are leaving high cost urban areas.
Researchers have found that urban jurisdictions with more highly-skilled residents and higher work-from-home numbers have seen larger population outflows. For example, throughout 2021 moves from D.C. to the suburbs increased by 0.4 percent.9 At the same time, moves from the entire Washington metropolitan region to lower-cost metro areas with a population of 2 million or more increased by 13 percent, and moves to smaller metropolitan areas increased by over 10 percent. Meanwhile, studies have shown that less dense cities have actually seen population growth, and mid-size metro areas with a lower cost of living have been the main destination for residents leaving larger metro areas with a high cost of living, including the Washington metropolitan area.
The U.S. Census Bureau estimates that D.C. lost nearly 23,000 residents to out-migration between April 1, 2020 and July 1, 2021.10 Though there is some evidence that some of these moves could be temporary,11 the overall trend of out-migration from large urban centers, which is partly driven by remote work options, appears to have taken hold. For example, using U-Haul data, researchers have found that more than 10 percent of moves in the period from April 2020 to May 2021 were influenced by COVID-19, with a significant shift in migration toward smaller cities, lower cost of living locations, lower tax locales, and locations with fewer pandemic-related restrictions. They also found that higher-income households are moving out at greater rates, and are moving more for lifestyle reasons and less for work-related reasons.12
These trends impact all things that matter to a local economy in the District of Columbia, including housing prices, office demand, and spending on the local service economy.
The geography of work in the region
As the relationship between where people live and where people work weakens, the geography of work in the region will change. To begin to understand the fiscal and economic impacts of this change, we first need to understand how many of D.C.’s workers—both the resident workforce and commuters—can do their jobs from home and where these workers live. While we can’t predict with certainty what the new geography of work will look like, pre-pandemic commuting patterns offer some insight into how economic activity might shift across the region as remote work becomes more prevalent.
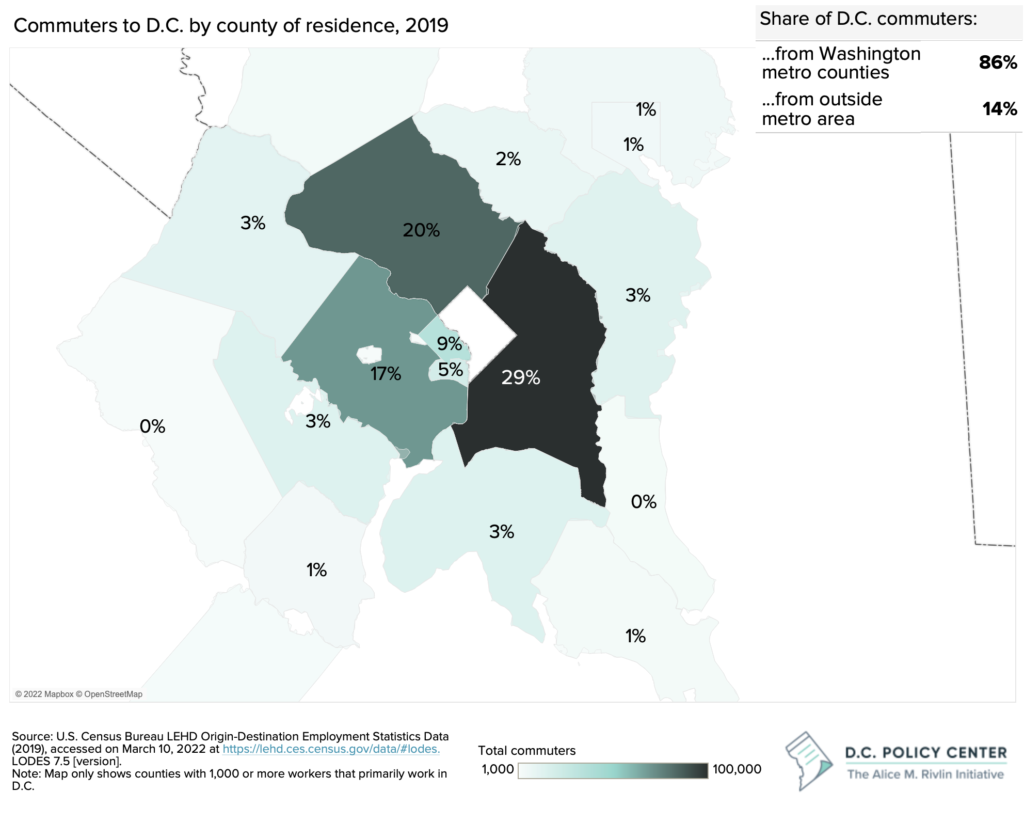
Pre-pandemic, D.C. was highly dependent on commuter activity, with over two-thirds of its workforce commuting from other jurisdictions.
In 2019, 70 percent of D.C.’s workers lived outside of the city, meaning the majority of the city’s workers are commuters from nearby jurisdictions.13 The city’s workers are primarily coming from Prince George’s and Montgomery Counties in Maryland, or Fairfax County in Virginia. A small share of D.C.’s workers live further away from the city, either outside of the MSA or outside of the District’s neighboring states all together, and likely did not commute to the city regularly even before the pandemic. Still, the majority of D.C.’s workers are commuters who contribute to the city’s economy by spending money and time at local businesses establishments in addition to their workplaces.
The D.C. metropolitan area is particularly vulnerable to the impacts the pandemic has had on commuting patterns due to the high concentration of workers in remote eligible jobs.
The transition to remote work will most quickly impact those who can do their jobs from home, typically workers in office-based industries, such as law, finance, or other professional services. While many service jobs support office workers, there will likely be a delay in the market’s response to new long-term worker behavior, so throughout this analysis, the focus is on the geography of the region’s jobs that can be done from home.
Researchers at the Becker-Freidman Institute for Economics at the University of Chicago estimate that in the D.C. metropolitan area, 51 percent of jobs can be done at home, or 64 percent when weighted by wage.14 This is relatively high compared to the national average of 37 percent, which is in part driven by the region’s high share of workers with a bachelor’s degree or higher.15 The higher concentration of workers in remote eligible jobs means the region’s worker dense areas are particularly at risk to the impacts of shifting commuting patterns, such as the economic loss that comes from a decline in daytime population.
If remote work continues, the region’s geography of work, and thus daytime activity, may shift from where office workers work to where they live.
We paired data from researchers at the Becker Freidman Institute for Economics at the University of Chicago, which estimates the share of jobs that can be done from home by industry, with data on pre-pandemic commuting patterns, to map where workers in remote eligible jobs lived and worked prior to the pandemic.16
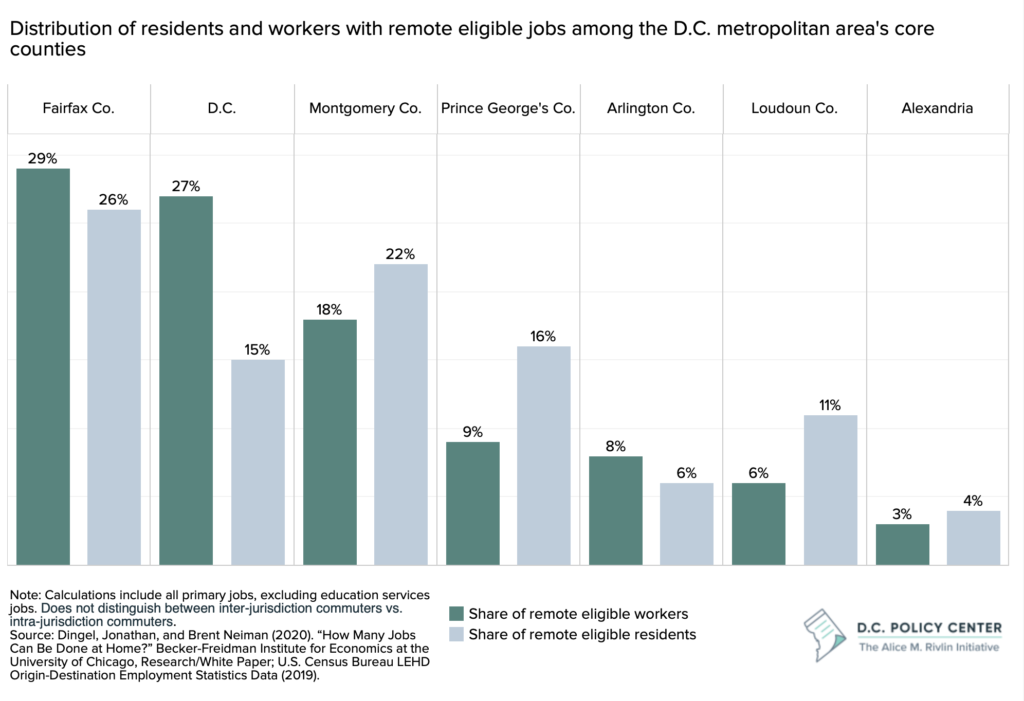
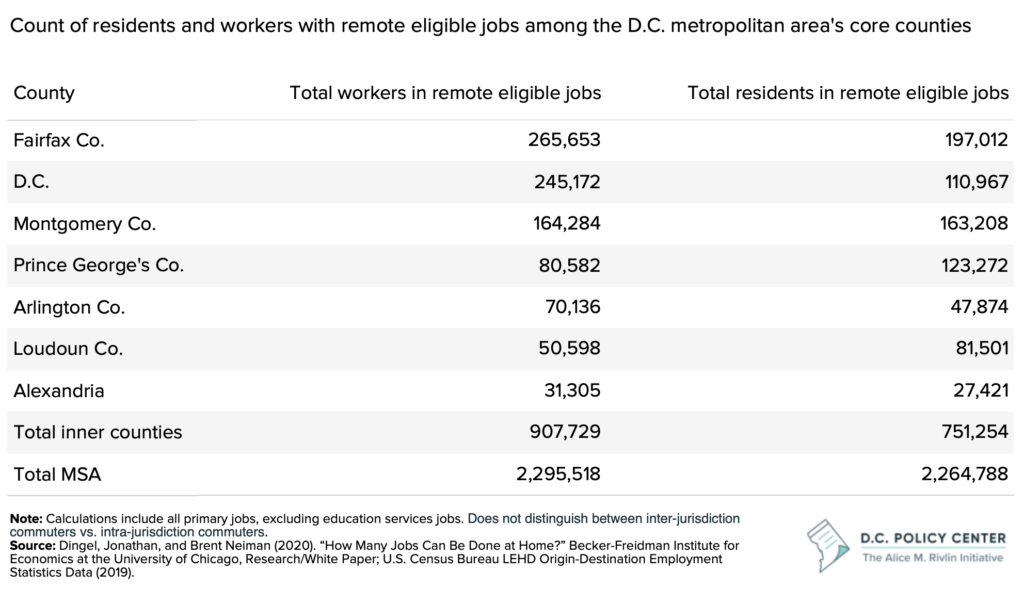
Pre-pandemic, the jobs that could be done from home were centered along the region’s transportation lines, with a particular concentration in and near downtown D.C. However, the home addresses of the workers in these jobs are more scattered throughout the region, with a particular concentration in D.C.’s neighboring jurisdictions. In fact, within the region’s core counties,17 nearly half of the workers who can do their jobs at home live in either Montgomery County or Fairfax County.
If remote work continues, workers who once commuted to D.C. five days a week, where they might have spent money on lunch or coffee, will now spend more time and money in their home jurisdictions. Given the higher concentration of workers with remote eligible jobs who live in D.C.’s neighboring jurisdictions, this means a shift in economic activity away from D.C.
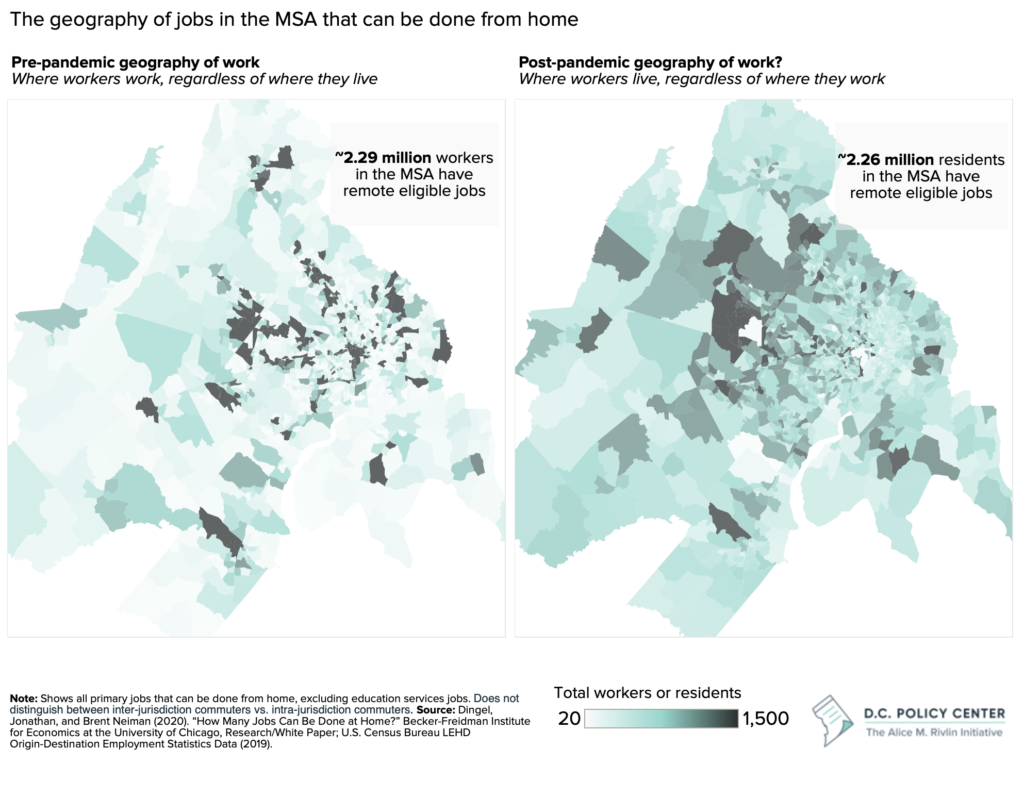
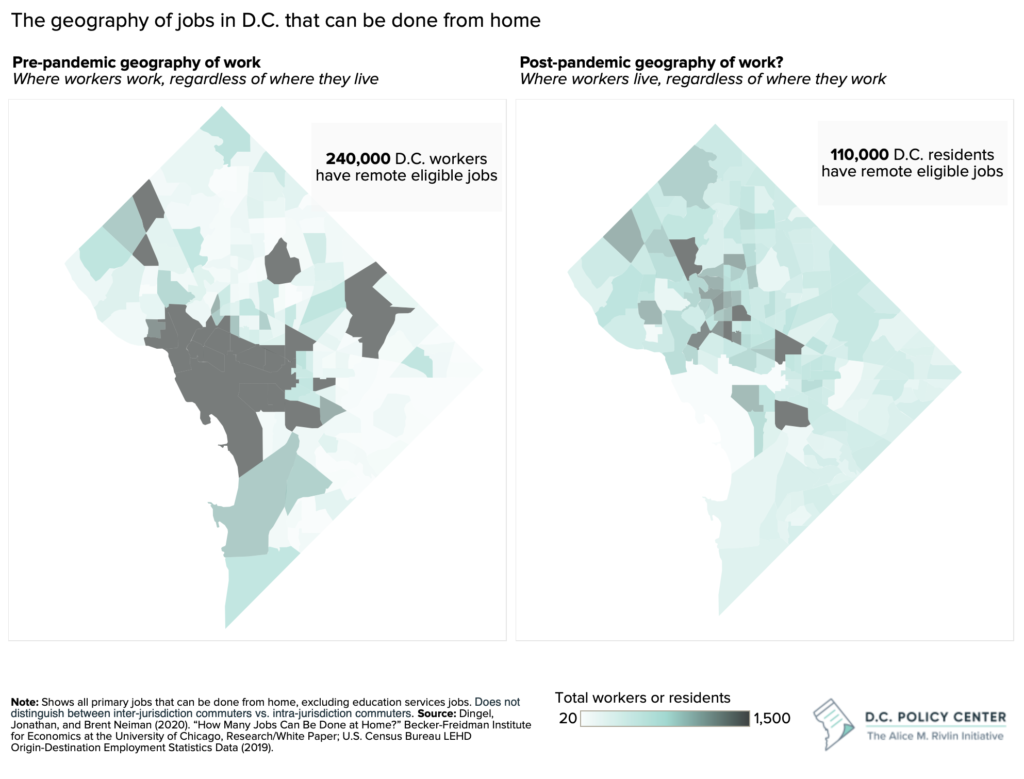
The same map, focused on the geography of work in D.C., shows that economic and commuter activity that was once concentrated in downtown may shift to the city’s mixed-use and university-based neighborhoods. This implies that within the District, remote work will have a disproportionate impact on the city’s businesses and neighborhoods.
Within the D.C. metropolitan area, the District of Columbia is particularly vulnerable to a decline in commuter-based economic activity.
Of metropolitan area-workers who can do their job from home, 11 percent work in D.C. and only five percent live in D.C. Of the workers who can do their jobs from home in the region’s core counties, 27 percent work in D.C. and only 15 percent live in the city. Only Fairfax County has more workers who can easily do their jobs from home, but the discrepancy between remote-eligible workers and remote-eligible residents is largest in D.C.18
Economic activity could also shift in more unpredictable ways if the transition to remote work prompts workers to move out of D.C. (or even the D.C. metropolitan area) in search of cheaper housing or more space.
Currently 240,000 workers in D.C. have remote eligible jobs and 110,000 residents in D.C. have remote eligible jobs. These workers are no longer tied to living within a reasonable commute from work. If workers decide to move out of the region entirely, economic activity will not simply shift to where workers lived pre-pandemic, but to a new, more unpredictable geography.
Using consumer credit panel data compiled by the Federal Reserve Bank of New York and Equifax, one researcher found that there was a sharp increase in net moves out of urban neighborhoods and large metropolitan areas with high costs of living. Migration flows out of the Washington metropolitan area were high in 2021 relative to pre-pandemic levels: there was an 11.1 percent increase in moves to lower-cost, but similarly sized metropolitan areas, a 12.3 percent increase in moves to smaller, mid-sized metropolitan areas, and a 13.9 percent increase in moves to areas with much smaller populations.19 Based on these patterns, workers who live in D.C. may be particularly susceptible to out-migration as the cost of living is higher than some nearby areas.
If office workers shift to a permanent remote or hybrid work arrangement, D.C. could lose approximately 155,000 commuters.
The number of commuters from other jurisdictions to D.C. who hold remote-eligible jobs varies, depending on the data source. Our best estimate is that of the 401,481 workers who commuted to D.C. from elsewhere prior to the pandemic, 155,550 can do their jobs from home.20 This means in a worst-case scenario, D.C. could lose 155,550 commuters. This is 63 percent21 of D.C.’s total workforce who can do their jobs from home and 24 percent22 of all D.C. workers. If these workers no longer visit their workplaces on a regular basis, the city will lose out on their spending, office demand will further weaken, and the entire region could lose out if these workers choose to relocate further away.
The future of work
While we can estimate the number of commuters who could be eligible for remote work, we still do not know how many of these workers will continue to work from home in the future, or how often they will work from home. This section reviews recent office occupancy trends and survey data as indicators for how people might behave in the future.
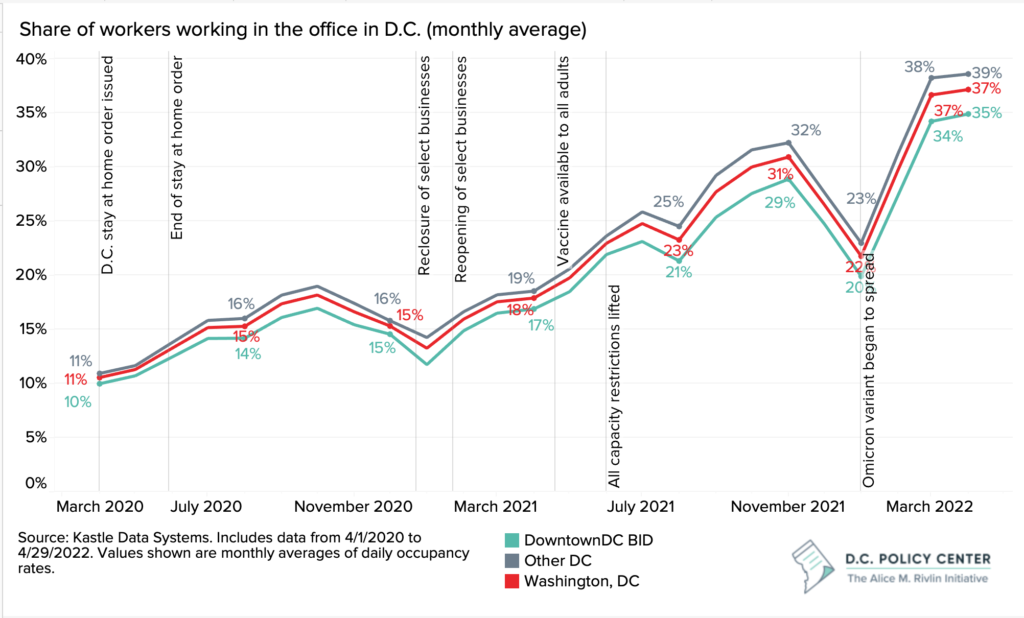
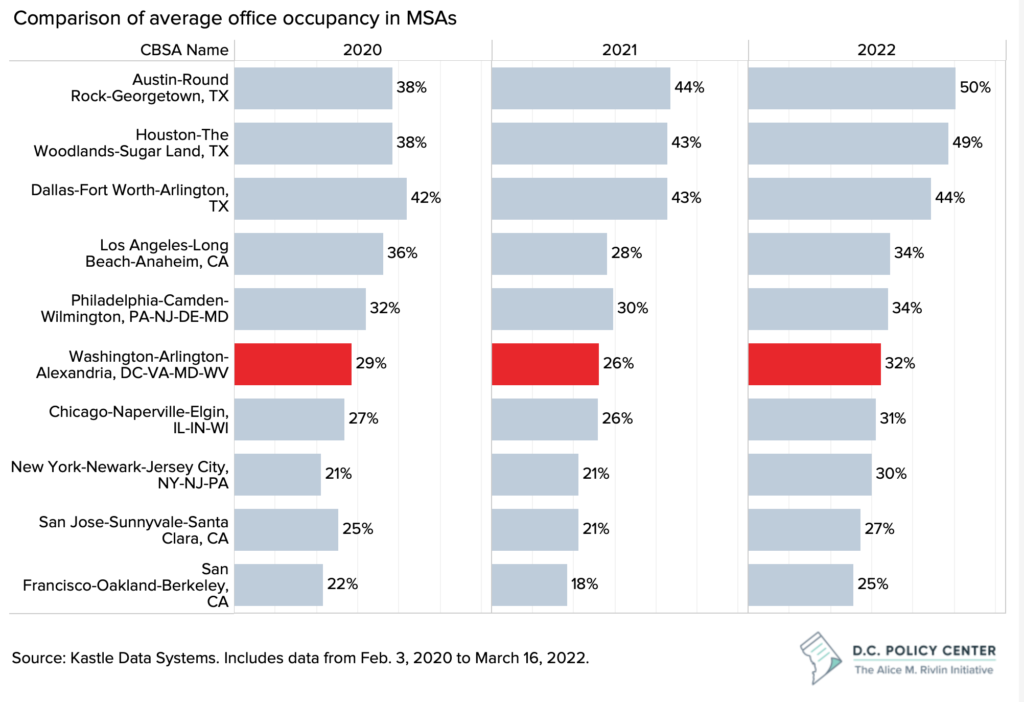
Office occupancy has been slowly climbing since the beginning of the pandemic but remains far below pre-pandemic levels.
Even with more widespread vaccine availability and the elimination of public health mandates, D.C. workers are not returning to the office. There could be many explanations for this: continued health concerns, lack of childcare options, service interruptions and declines in public transportation, or simply personal preferences. Regardless of the reasons, the trend points to a growing preference for remote work.
Kastle data, which track office worker presence by recording key card swipes, show that in April 2020, office occupancy hit a low of 11 percent across the entire city. Pre-pandemic, buildings were often fully occupied, and occupancy did not drop below 85 percent in February 2020. Once the vaccine became widely available and public health restrictions were lifted, worker presence in the city’s office buildings began to slowly rise. However, even before the Omicron variant began to spread, occupancy never rose far past 30 percent. Importantly, occupancy has flatlined in recent months, hovering at 37 percent across the entire city and 35 percent downtown.23 Behavior over the next few months, assuming there are no new variants, will reveal how close this is to the new normal.
Other data sources also show a growing preference for remote work. The results of a survey conducted by Pew Research Center suggest that as of January 2022, 71 percent of workers with jobs that can be done from home are still teleworking most of the time and another 12 percent are teleworking some of the time. Of these workers, 61 percent are doing so by choice, despite their workplace being open.24 Gallup’s State of the Workforce Study conducted in June 2021 found that 91 percent of workers who are currently working at least some of their hours remotely are hoping that remote work continues after the pandemic.25 And some workers are even willing to search for new jobs if remote work does not continue: as of mid-2021, 36 percent of workers who work remotely indicated that if they were forced to go back to the office, they would quit.26
The strong preference for remote work is also evident by the high worker turnover and historically-high share of jobs that are going unfilled.27 This gives workers more bargaining power, which further highlights the likelihood of a more permanent shift to remote work: if workers prefer this added flexibility, many employers will offer it to stay competitive.
Among the office workers who are returning to the office, preferences for hybrid work arrangements are emerging.
Kastle data also show that mid-week days have higher office occupancy rates than Monday and Friday. Tuesday and Wednesday are particularly popular days for workers to commute to the office, with occupancy rates reaching an average of 44 percent in April 2022. Meanwhile, occupancy on Monday has remained low at 34 percent of workers, and Friday has even lower occupancy rates with less than a third of workers showing up.28
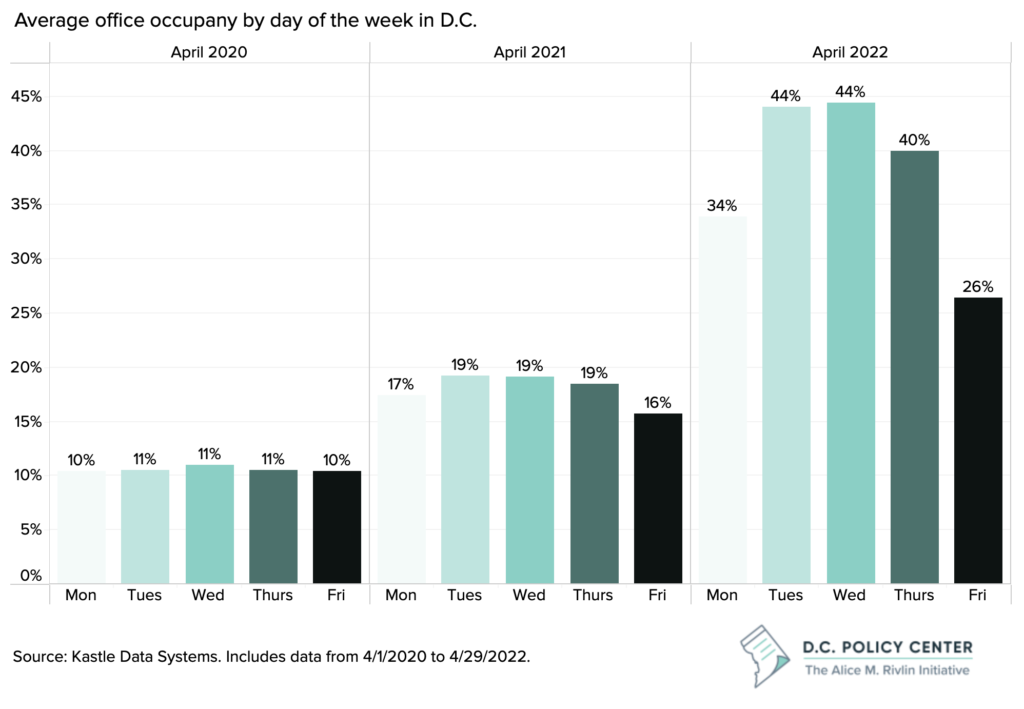
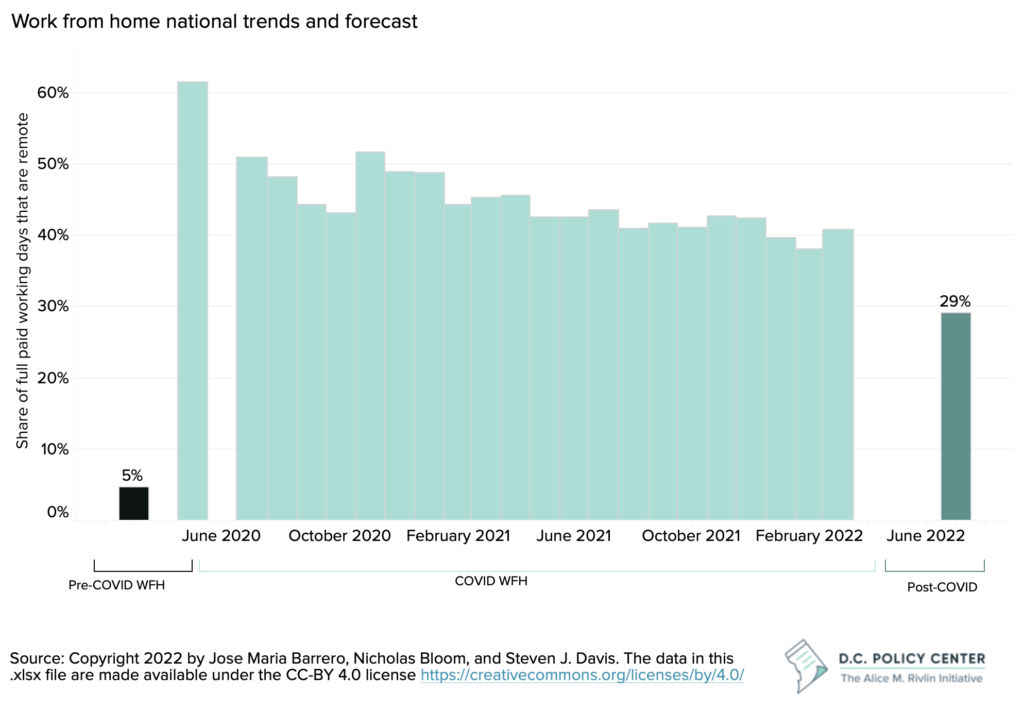
This suggests that rather that visiting the office five days per week as was common pre-pandemic, workers now prefer a hybrid schedule in which they work from home two to three days a week and commute to the office on the remaining days. The Survey of Working Arrangements and Attitudes (SWAA), which collects monthly data from between 2,500 and 5,000 workers across the U.S., confirms these trends. The survey’s research team forecasts that 29 percent of workdays will be worked from home post-pandemic, whereas only 5 percent of workdays were worked from home pre-pandemic.[note]Copyright 2022 by Jose Maria Barrero, Nicholas Bloom, and Steven J. Davis. The data in this .xlsx file are made available under the CC-BY 4.0 license https://creativecommons.org/licenses/by/4.0/[/note]
However, employers and workers diverge on their preferred number of in-office workdays. The SWAA also finds that as of March 2022, on average, those who can work from home prefer to have nearly three remote days per week post-pandemic. Meanwhile, the employers of these workers prefer to offer two remote days per week post-pandemic.29
This trend is not unique to the D.C. region. Nationwide, workers are interested in flexible work arrangements, particularly in traditionally Democratic-leaning regions.
The data show that other major metropolitan areas have similar trends. This matters because as employers compete for top talent, they will likely offer flexible work arrangements as a benefit, and there will be more jobs on the market with a remote option. There were almost triple the number of remote job postings in January through May of 2021 relative to the same time frame in 2019.30 And a job posting across the country could now be filled by a D.C. resident or worker.
The national scale of these trends underscores that the need for the city to adapt to shifting preferences and to understand the economic impact of these preferences— particularly given the Democratic political leanings of the city. The SWAA finds that the desired number of full days of work from home varies with political party affiliation, and is higher for Democrats (2.6) than to Independents (2.3) or Republicans (2.0).31 The District not only has a high share of workers and residents in remote-eligible jobs, but also has a large population within the demographic that is favoring work from home.
For D.C. to remain vibrant and competitive in this new environment, the city will need to adapt to workers’ shifting preferences.
The trends that are now shaping the post-pandemic normal is changing the District of Columbia. With remote work taking hold, the downtown employment districts, which have historically been a significant source of economic activity and tax revenue for the District of Columbia, are struggling.
Our research shows that in this new normal, the worker footprint in the District could decline if the 155,00 commuters who have jobs that can be worked from home remain away from their offices. Current hybrid work trends suggest that peak commuter activity will be limited to two to three days per week, reducing the demand for restaurants, coffee shops and other stores commuters frequented prior to the pandemic. And if the 110,000 D.C. residents32 who have jobs that can be worked from home switch to remote work, economic activity will increasingly shift to mixed-use or residential neighborhoods.
The transition to remote work will ultimately hit the city’s tax base and tax revenue in three of the District’s most important revenue sources: income tax (if population declines continue and reduce the number of taxpaying households), commercial property tax (if leasing activity remains anemic), and sales taxes (if activity high tax rate bases such as hotels and restaurants does not bounce back.)
Recognizing these trends early can allow the District to 1) adapt to how demand for the city’s space is changing and 2) adopt policies that can grow its economy and maintain its strong fiscal position under changing conditions.
In 2003, Alice M. Rivlin continued to make a case for 100,000 more residents in D.C. Nearly 20 years later, the need to grow the population remains key to the District’s future. But two other observations she made remain particularly relevant.
First, Dr. Rivlin observed that “cities never arrive at a fixed point,” but rather, are “always changing, which is one reason why they are exciting places to live.”33 In this case, the impacts of the pandemic have made it clear that we need to rethink the identity of downtown and its use of space. Downtowns and neighborhoods that have multiple uses are more resilient to economic downturns as they do not rely heavily on one use-type, such as office space. When employment is down, versatile places can still attract residents, shoppers, or other visitors. The District’s ability to evolve to become more resilient may take time, but in the immediate term, incremental changes, such as placemaking or establishing a new identity for downtown beyond an office district, can help to increase foot traffic.
Dr. Rivlin’s second relevant point is that growing the District’s tax base, “means increasing the incomes, spending and wealth of the existing population and enlarging that population.” Attracting new residents and retaining existing residents is even more important as the District loses some of its commuter population. This growth is necessary to maintain the economic activity and strengthen other features of the District that support all of District’s residents, including public services, schools, and infrastructure.
In order to chart the course for economic growth in the city, we need to understand how the District’s tax bases are shifting due to remote work. In part two, we will use the information from the data presented above to estimate the economic and fiscal impacts of remote work.
Data and methodology
All data points and maps related to the geography of remote work in the region were calculated by matching data on the share of jobs that can be done from home by industry to U.S. Census Bureau LEHD Origin-Destination Employment Statistics (LODES) data. The Residence Area Characteristics (RAC) and Workplace Area Characteristics (WAC) data files from LODES were used in this instance because while it does not distinguish between inter-jurisdiction commuters vs. intra-jurisdiction commuters, it allows for more details on jobs by industry. The data on the share of jobs that can be done from home by industry was accessed here: https://github.com/jdingel/DingelNeiman-workathome/. These data are also presented in the following table.
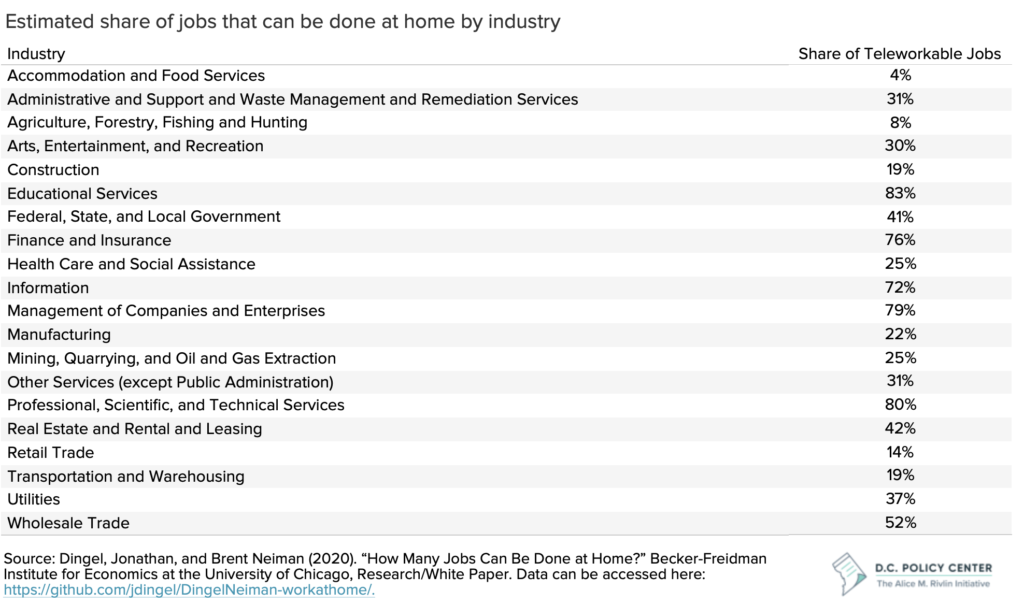
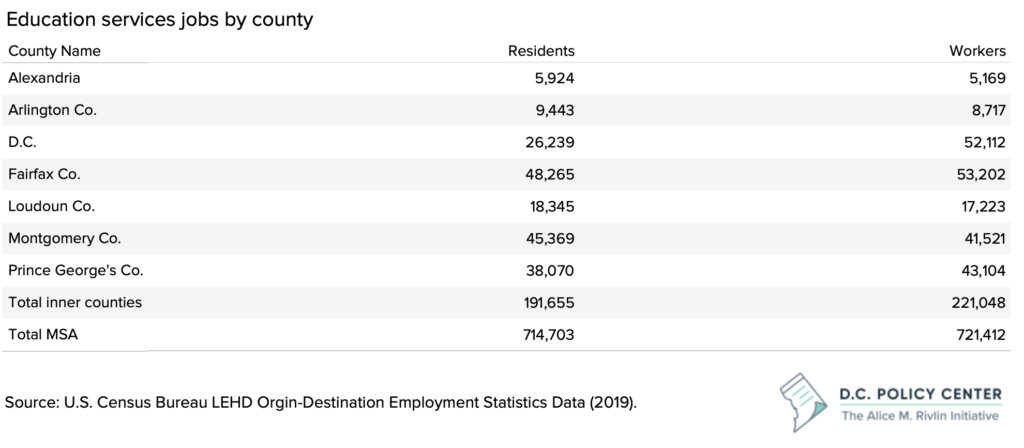
Education jobs were removed from the calculations and maps because the data suggest that 83 percent of jobs in education services can be done from home. While this may have been true when many schools were running virtually, it is not likely an accurate estimate in the long-term. For simplification and because we do not have survey data to recalculate the number, we excluded these jobs for now. For reference, the number of education jobs by county are presented in the following table:
To calculate the number of workers in D.C. that 1) held a remote eligible job, and 2) lived elsewhere, we used a slightly different process than we used to identify the region’s geography of work.
- Using the Origin-Destination (OD) data files from LEHD Origin-Destination Employment Statistics, we calculated the number of workers that held primary jobs in D.C. but lived in either Maryland or Virginia. We excluded any workers that held a primary job in D.C. but lived further away than Maryland or Virginia, assuming these workers did not commute regularly prior to the pandemic. We then excluded 5 percent of workers, accounting for those who were fully remote prior to the pandemic. This initial calculation includes all primary jobs across all industries, finding that there were 401,481 commuters to D.C. pre-pandemic. The OD data file is useful for this calculation because while it does not have detailed industry information on jobs, it distinguishes between inter-jurisdiction commuters and intra-jurisdiction commuters.
- To incorporate more detailed information on worker industries, and thus identify how many commuters were in remote eligible jobs, we used the same data on the share of jobs that can be done from home by industry as estimated by the University of Chicago, but instead matched it to U.S. Census ACS 1-year PUMS data. The PUMS dataset included those with a place of work in D.C. and residence in Virginia or Maryland, by industry. We used this matched dataset to calculated the share of D.C.’s total commuters who are able to do their jobs from home (198,309/512,009). PUMS data are useful for obtaining an estimate of the share of workers who are in commuter eligible jobs, but can have high margin of errors, which is why we avoid using the raw numbers from PUMS.
- Instead, we applied the share of commuters who can do their jobs from home as estimated by PUMS data to the total number of commuters as estimated by LODES data: (198,309/512,009) * 401,481 = 155,500.
More information on U.S. Census Bureau LEHD Origin-Destination Employment Statistics data:
- All maps and calculations were created using the Residence Area Characteristics (RAC) and Workplace Area Characteristics (WAC) data files from LEHD Origin-Destination Employment Statistics (LODES). These data allow for more details on jobs by industry, but does not distinguish between inter-jurisdiction commuters vs. intra-jurisdiction commuters. In the upcoming brief, we also look at the Origin-Destination (OD) data file from LODES, which does not have detailed industry information, but distinguishes between inter-jurisdiction commuters vs. intra-jurisdiction commuters.
- LODES data tend to undercount jobs compared to Bureau of Labor Statistics and administrative data sources. The values calculated throughout this report are likely an undercount and should not be interpreted as exact estimates.
Endnotes
- Sayin Taylor, Yesim (2015). Residents move into the city for jobs, move out for housing, District Measured.
- According to the OCFO, total employment in the District of Columbia was 808,300 in January of 2020 (for details, see Economic and Revenue Trends: January 2020 Table 1). The estimated number of commuters is based on the share of DC workers who live in Maryland or Virginia, calculated by using ACS 1-Year PUMS data for 2019. Note: This data will not match the values in the rest of the report. We use LEHD Origin-Destination Employment Statistics throughout the rest of the report due to its detail on commuting patterns; however, it is likely an undercount of total jobs in the District.
- Jose Maria Barrero, Nicholas Bloom & Steven J. Davis (2021). Why Working from Home Will Stick, NBER Working Paper 28731, DOI 10.3386/w28731, available at https://www.nber.org/papers/w28731.
- Survey of Working Arrangements and Attitudes, April 2022 update.
- Jonathan I. Dingel and Brent Neiman (2020). How Many Jobs Can Be Done at Home? NBER Working Paper 26948 https://www.nber.org/papers/w26948.
- Mendici, Andy (2022). The hybrid shift is ‘moving at hyper speed,’ especially for high-paying roles. Washington Business Journal, available at https://www.bizjournals.com/bizjournals/news/2022/02/16/remote-hybrid-jobs-salary-pay-ladders-covid-19
- Ethan Oldham (2021). Future of Remote Work in a Post-COVID Emsi, available at https://www.economicmodeling.com/2021/07/27/future-of-remote-work/
- Cutter & Dill (2021), Remote Work is the New Signing Bonus, Wall Street Journal. Available at https://www.wsj.com/articles/remote-work-is-the-new-signing-bonus-11624680029?mod=business_minor_pos2
- Stephan Whitaker (2021, 2022, various updates), Did the COVID-19 Pandemic Cause an Urban Exodus? Data Updates for Tables and Figures, Federal Reserve Bank of Cleveland, available at https://www.clevelandfed.org/newsroom-and-events/publications/cfed-district-data-briefs/cfddb-20210301-covid-19-pandemic-urban-exodus-updates
- Kathpalia, Sunaina (2022). “Charts of the week: A pandemic-induced exodus has broken the District’s population boom.” D.C. Policy Center, available at: https://www.dcpolicycenter.org/publications/census-shows-pandemic-exodus-has-broken-dc-population-growth/
- Moored, Ginger (2022). “Pandemic led to DC population loss, but data suggests population rebound last summer.” District, Measured, available at: https://districtmeasured.com/2022/02/10/pandemic-led-to-dc-population-loss-but-data-suggests-population-rebound-last-summer/
- Haslag & Weagley (2021), From L.A. to Boise: How Migration Has Changed During the COVID-19 Pandemic, available at https://papers.ssrn.com/sol3/papers.cfm?abstract_id=3808326
- Note: To avoid double counting workers, this calculation only includes primary jobs. Source: U.S. Census Bureau LEHD Origin-Destination Employment Statistics Data (2019), accessed on March 10, 2022 at https://lehd.ces.census.gov/data/#lodes. LODES 7.5 [version].
- Dingel, Jonathan, and Brent Neiman (2020). “How Many Jobs Can Be Done at Home?,” Becker-Freidman Institute for Economics at the University of Chicago, Research/White Paper.
- In the D.C. metropolitan area, 51 percent of the population aged 25 years or older held a bachelor’s degree or higher as of 2019. This compares to 32 percent of the same population nationwide. Source: U.S. Census American Community Survey (ACS), 5-Year Estimates (2019).
- Note: See the methodology section for more details. All maps and information about the geography of remote eligible jobs include all primary jobs, excluding those in the education services industry. Source: Dingel, Jonathan, and Brent Neiman (2020). “How Many Jobs Can Be Done at Home?” Becker-Freidman Institute for Economics at the University of Chicago, Research/White Paper; U.S. Census Bureau LEHD Origin-Destination Employment Statistics Data (2019), accessed on March 10, 2022 at https://lehd.ces.census.gov/data/#lodes. LODES 7.5 [version]. Data on the share of jobs that can be done from home by industry can be accessed here: https://github.com/jdingel/DingelNeiman-workathome/.
- The region’s core counties include: D.C., Arlington, Fairfax, and Loudoun Counties in Virginia, Alexandria city in Virginia, and Montgomery and Prince George’s Counties in Maryland.
- Note: See the methodology section for more details. Source: Dingel, Jonathan, and Brent Neiman (2020). “How Many Jobs Can Be Done at Home?” Becker-Freidman Institute for Economics at the University of Chicago, Research/White Paper; U.S. Census Bureau LEHD Origin-Destination Employment Statistics Data (2019), accessed on March 10, 2022 at https://lehd.ces.census.gov/data/#lodes. LODES 7.5 [version].
- Note: The percentage change is 2021:Q1 through 2021:Q4 compared to the equivalent migration flows from 2017:Q2 to 2020:Q1. Whitaker, Stephan (2021, 2022, various updates). “Migrants from High-Cost, Large Metro Areas during the COVID-19 Pandemic, Their Destinations, and How Many Could Follow.” Federal Reserve Bank of Cleveland.
- See methodology section for more details. Source: U.S. Census Bureau LEHD Origin-Destination Employment Statistics Data (2019), accessed on March 10, 2022 at https://lehd.ces.census.gov/data/#lodes. LODES 7.5 [version]; Dingel, Jonathan, and Brent Neiman (2020). “How Many Jobs Can Be Done at Home?” Becker-Freidman Institute for Economics at the University of Chicago, Research/White Paper; U.S. Census Bureau ACS, 1-year PUMS data (2019).
- Note: Includes only primary jobs and excludes education jobs. See methodology section for more details. Source: U.S. Census Bureau LEHD Origin-Destination Employment Statistics Data (2019), accessed on March 10, 2022 at https://lehd.ces.census.gov/data/#lodes. LODES 7.5 [version]; Dingel, Jonathan, and Brent Neiman (2020). “How Many Jobs Can Be Done at Home?” Becker-Freidman Institute for Economics at the University of Chicago, Research/White Paper; U.S. Census Bureau ACS, 1-year PUMS data (2019).
- Note: Includes only primary jobs and includes education jobs. Source: U.S. Census Bureau LEHD Origin-Destination Employment Statistics Data (2019), accessed on March 10, 2022 at https://lehd.ces.census.gov/data/ – lodes. LODES 7.5 [version]; Dingel, Jonathan, and Brent Neiman (2020). “How Many Jobs Can Be Done at Home?” Becker-Freidman Institute for Economics at the University of Chicago, Research/White Paper; U.S. Census Bureau ACS, 1-year PUMS data (2019).
- Note: Kastle data only tracks a portion of all office buildings, so the data should be interpreted with caution. Source: Kastle Data Systems.
- Kim Parker, Juliana Menasce Horowitz, and Rachel Minkin (2022). “COVID-19 Pandemic Continues to Reshape Work in America.” Pew Research Center.
- Saad, Lydia and Wigert, Ben (2021). “Remote Work Persisting and Trending Permanent.” Gallup.
- Barrero, Jose Maria, Nicholas Bloom, and Steven J. Davis, 2021. “Why working from home will stick,” National Bureau of Economic Research Working Paper 28731, via Work from Home Research.
- Sayin, Yesim and McConnell, Bailey (2022). “Chart of the week: The tepid monthly employment numbers in D.C. hide the great churn.” D.C. Policy Center.
- Kastle Data Systems.
- Barrero, Jose Maria, Nicholas Bloom, and Steven J. Davis, 2021. “Why working from home will stick,” National Bureau of Economic Research Working Paper 28731, via Work from Home Research.
- Oldham, Ethan (2021). “Future of Remote Work in a Post-COVID World.” Emsi.
- Barrero, Jose Maria, Nicholas Bloom, and Steven J. Davis, 2021. “Why working from home will stick,” National Bureau of Economic Research Working Paper 28731, via Work from Home Research SWAA March 2022 Update, available here: WFHResearch_updates_March2022.pdf.
- 110,000 D.C. residents have jobs that can be done from home, regardless of where they work
- “100,000 More DC Residents—Who Benefits?”, Presentation to the Washington Regional Network by Alice M. Rivlin on Tuesday, September 30, 2003, accessed via The Brookings Institution.