

This report is the second in a two-part series focused on building a better understanding of how remote work will impact the District’s future. The first report identified 1) How the geography of work might shift if remote eligible workers continue to work from home; 2) How often workers will continue to work from home post-pandemic; and 3) How many of the region’s workers are eligible to do so.
In this second part, we use the information from part 1 to 1) Estimate how the shift to remote work might impact the city’s tax base, and 2) Propose next steps to ensuring the District has an upward economic growth trajectory as the city recovers from the pandemic.
This report is a publication of the D.C. Policy Center’s Alice M. Rivlin Initiative for Economic Policy & Competitiveness, which provides an in-depth and objective look at the factors that influence the District of Columbia’s attractiveness and competitive position in the region and the nation.
We wish to thank the Kimsey Foundation, Monumental Sports & Entertainment, Quadrangle Development, Tishman Speyer, and Ruben Companies for their support of the Rivlin Initiative’s work.
Introduction
The District of Columbia is accustomed to planning for growth. From the Revitalization Act in 1997 through 2019, the city’s population grew by 33 percent,1 private sector jobs grew by 45 percent2, and the number of business establishments grew by 23 percent.3 Between its low in the 2008-2009 school year and the 2019-2020 school, public school enrollment grew by 33 percent.4 And, real personal incomes grew by 20 percent between 2000 and 2021.5 This growth has been the basis of the District’s tremendous fiscal strength and robust revenue. In fact, the District’s gross tax revenue doubled between 1997 and 2021 in real terms,6 allowing the city to grow its budget year after year.
However, the pandemic has created a new normal, and this type of growth, both in demographic and economic fundamentals, and in revenue, is not guaranteed in the future. Across the country, the pandemic has changed the way people interact with cities. Remote work is breaking the relationship between where people live and where people work, causing economic activity to shift away from employment centers. This presents significant headwinds for many cities, but the District faces unique challenges given its position within a relatively small, open economy and its inability to tax the earned income of non-residents.
Prior to the pandemic, the District’s robust revenue growth stemmed from both its resident population and its commuter population.7 While the city cannot tax the income of non-residents, commuters were an important part of the city’s tax base, as they once filled offices and spent money in the city while at work. As a result, the city and the region grew in tandem. However, as workers continue to stay at home, jurisdiction lines increasingly matter and the District is at risk of losing both its commuters and residents.
While many in-person activities have resumed,8 workers continue to prefer permanent remote or hybrid work arrangements over a five-day in-person schedule. Since part-one of this series was published, office occupancy remained stagnant between April and May 2022 with an average of 36 percent of office workers commuting to their workplaces in May, a one percentage point increase over April. So far, weekly average occupancy has hovered between 38 and 39 percent in June, suggesting a very minimal change. And workers who can do their jobs from home continue to prefer remote work: through May 2022, the Survey of Working Arrangements and Attitudes (SWAA) found that on average, employers have settled on plans that allow those who can work from home an average of 2.3 remote days. The majority of employees (80 percent) report that they generally abide with employer plans, but they have also observed that there is little consequence to not following employer plans.9 These data continue to suggest a preference for flexibly and hybrid work arrangements.
To remain vibrant and competitive in this new environment, the city will need to understand how these behavioral shifts may impact the tax base, and thus, the city’s ability to collect revenue and serve its residents. In this report, we use the information presented in part-one of the series to begin to estimate how the shift to remote work could impact three of city’s key tax bases (sales, property, and income tax), and thus, future fiscal health.
There remains much uncertainty about the future of work; however, our analyses show that unless there is a complete return to pre-pandemic behaviors and preferences, a very different future performance awaits the District’s key tax revenues. This kind of large, permanent shock to existing systems will require innovative policy solutions.
Given the scale of potential loss in revenue, we find that the best way for the city to maintain and grow its tax base in this new post-pandemic environment is to double down on retaining existing and attracting new residents. But, to do so, the city will have to address existing challenges and take advantage of new opportunities, including:
- Diversify downtown,
- Build more housing,
- Simplify business formation,
- Support public transit,
- Invest in public safety,
- Focus on forward-thinking policy, and
- Play to the city’s existing competitive advantages.
General sales tax revenue
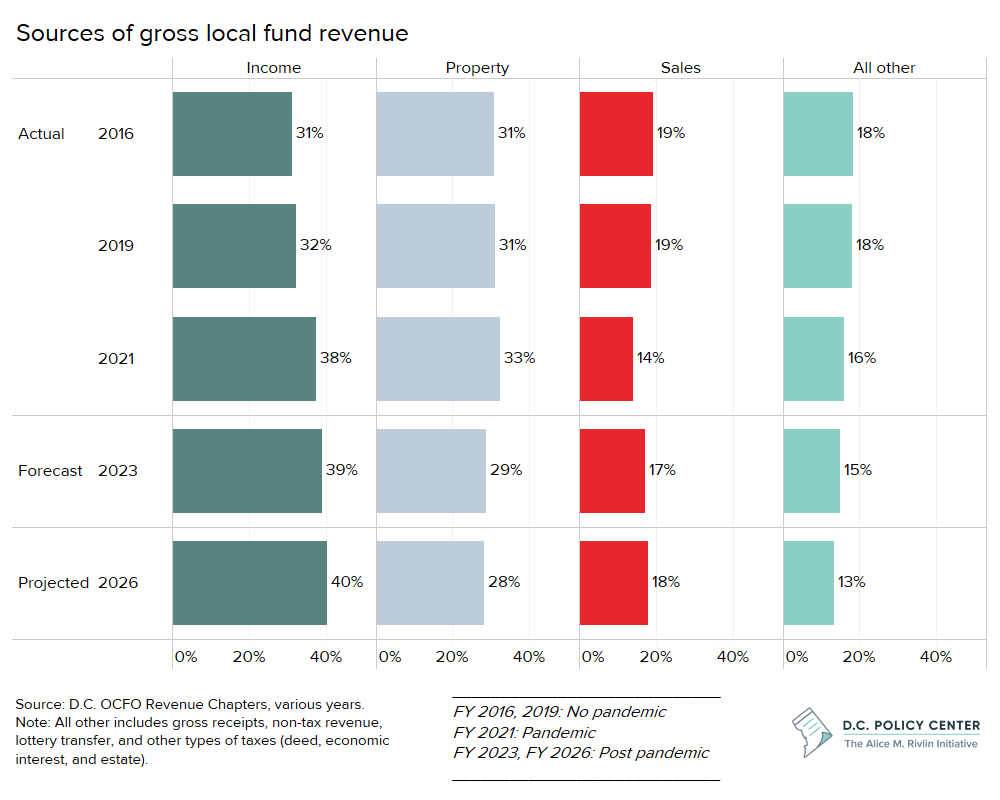
The District taxes the sales of all tangible property, including retail sales (6 percent), restaurant sales (10 percent), alcohol bought at stores (10.25 percent), hotel rooms (14.95 percent), parking (18 percent), car rentals (10.25 percent), medical marijuana (6 percent), and even sugary soda (8 percent).10 Pre-pandemic, sales tax revenue accounted for 12 percent of the city’s gross local fund revenue and 19 percent of net revenue (after all transfers), making it the third largest source of revenue in the city.11
With fewer commuters and tourists, there has been downward pressure on relatively high-tax sales activity, and upward pressure on lower-tax sales activity.
The shift to remote work has led to fewer restaurant visits, fewer hotel bookings for work travel, and fewer people parking. This has depressed spending in the city’s sales tax bases with the highest tax rates. Even as spending increased in the city’s low-tax bases, such as general retail, the decline of spending in the city’s special sales tax base (restaurants, hotels, parking) has an outsized impact on revenue due to its higher tax rates.
At the end of FY2021, sales tax revenue was down 24.7 percent relative to FY2019, going from $1.6 billion to $1.2 billion.12 However, different categories within the general sales tax base were impacted differently. Throughout the pandemic, retail, liquor, rental car, and medical marijuana sales tax collections have increased. Meanwhile, collections from restaurants, parking, and hotels have declined precipitously.
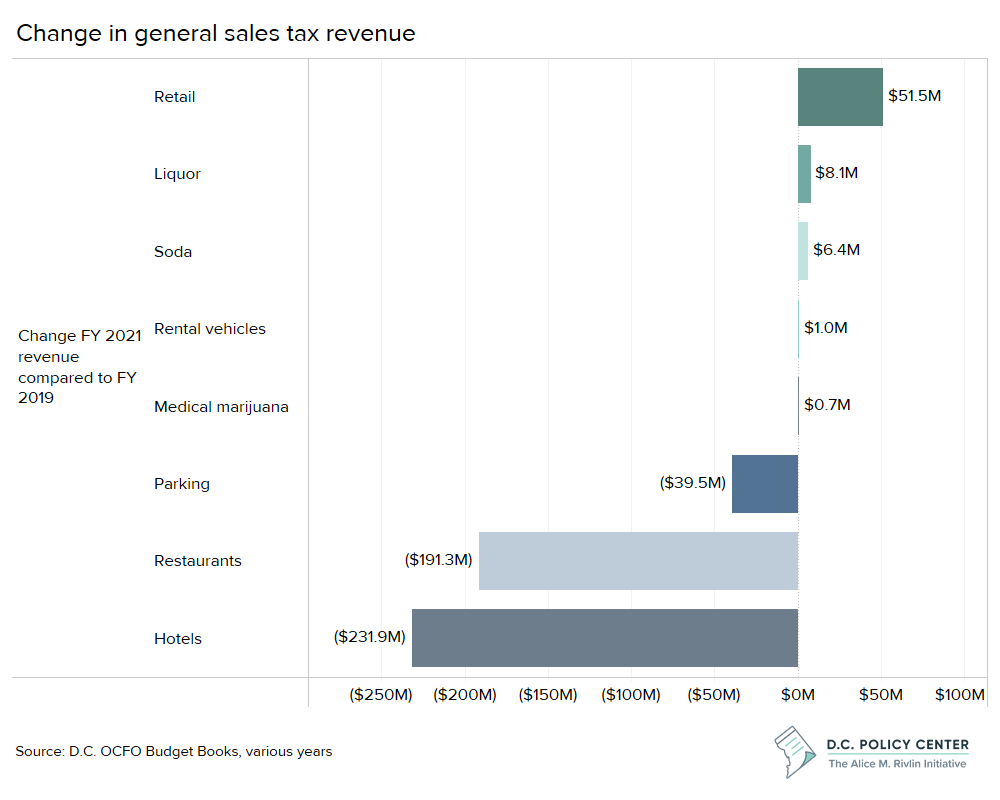
These shifts make sense in the context of the pandemic and tell a story about how spending behavior has changed due the public health restrictions that were placed on many businesses throughout the pandemic. These shifts also reflect that more people are spending time near their homes. By the end of FY 2021, the retail sales tax base, which includes grocery stores,13 was up 7.4 percent relative to pre-pandemic collections. Meanwhile, sales tax collections from restaurant, which include not just formal restaurants, but any food prepared outside the home, such as items sold at local coffee shops, are down 42.8 percent.14 Rather than spending money outside the home, such as at restaurants nearby workplaces downtown, people are spending money on household items and food that can be prepared at home.
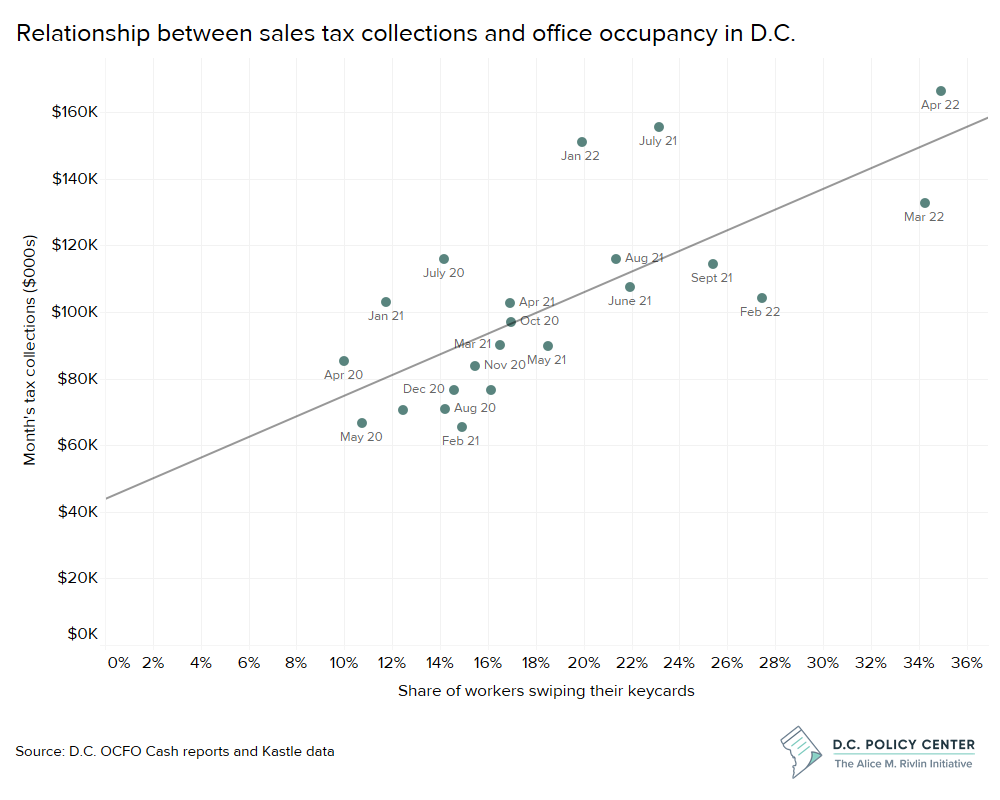
There is a strong relationship between office occupancy and general sales tax collections.
The share of workers who show up to their offices each month explains 54 percent of the variation in the city’s monthly tax collections. This means that office occupancy is one predictor of sales tax revenue.15 If fewer workers show up to their workplaces, D.C.’s general sales tax revenue will decline.
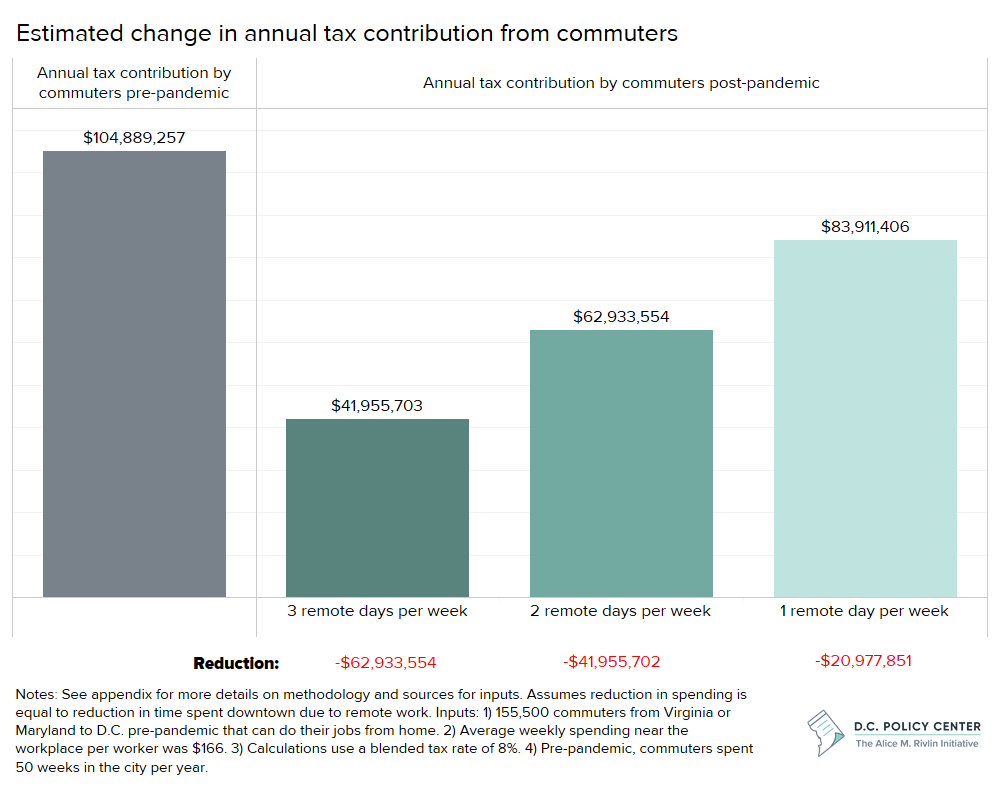
If D.C.’s 155,500 commuters continue to work from home three days per week after the pandemic, the city could lose up to $62.9 million in sales tax revenue.
As shown in part one of this series, a permanent shift to remote or hybrid work can result in the loss of 155,500 full-time commuters. If this happens, the city also loses out on the economic activity those commuters brought to downtown.16 In 2012, the International Council of Shopping Centers (ICSC) estimated that nationally, the average office worker spent $115.60 per week in urban areas, excluding spending on transportation and online purchases.17 After adjusting for D.C.’s higher cost of living and to 2021 dollars, this suggests that in D.C., office workers in-office five days per week spend about $167 per week near their workplaces. While this study is a decade old, it is one of the few that estimate office worker expenses in detail.
Using this data, we estimate that if D.C.’s commuters work from home three days per week, which is the current average in D.C. according to Kastle data and the preference of the average worker who holds a remote eligible job according to survey data18, spending in the District may decline by $5,009 per commuter over a year, which amounts to $779.1 million across the city.19 This estimate aligns with data released by other researchers. In the Survey of Working Arrangements and Attitude’s April 2022 update, researchers Jose Maria Barrero, Nicholas Bloom, and Steven J. Davis estimate a 46 percent reduction in days spent on business premises by workers that can work from home and a reduction in spending of $5,003 per worker per year.20

This reduction in spending would have the greatest impact on the local businesses that support office workers in downtown D.C., such as fast casual restaurants, personal services, and other convenience retail stores. Moreover, this estimate does not account for the shift in spending by workers in remote eligible jobs who both live and work in the District. It is difficult to estimate how these workers will impact the city’s overall sales tax revenue because while they may spend less time (and money) near their workplaces, they may spend more near their homes, assuming they choose to continue living in the District. And, as indicated by recent shifts in the sales tax bases, their spending will be less concentrated in high-tax activities compared to pre-pandemic.
If commuter spending declines by $779 million (commuters settling into a two-day in-person work week), revenue will also take a hit. Assuming the reduction in spending detailed above holds true, we estimate that the tax contribution from the District’s commuters will decline by as much as $62.9 million per year. The losses will be lower if more people work more days in person. For example, a one-day work-from-home policy could reduce sales tax revenue by $20.9 million per year.21 This loss is not a significant share of the city’s total revenue, but if this loss occurs yearly in the long-term, the city will need to find a way to replace this portion of its revenue.
Office property and commercial property tax revenue
Property tax collections account for about a third of the city’s gross local fund revenue, and nearly 40 percent of the city’s property tax collections come from large office buildings.22 As workers continue to work from home, increased vacancy in the District’s office buildings will result in declining assessment valuations, with repercussions for local public finances.
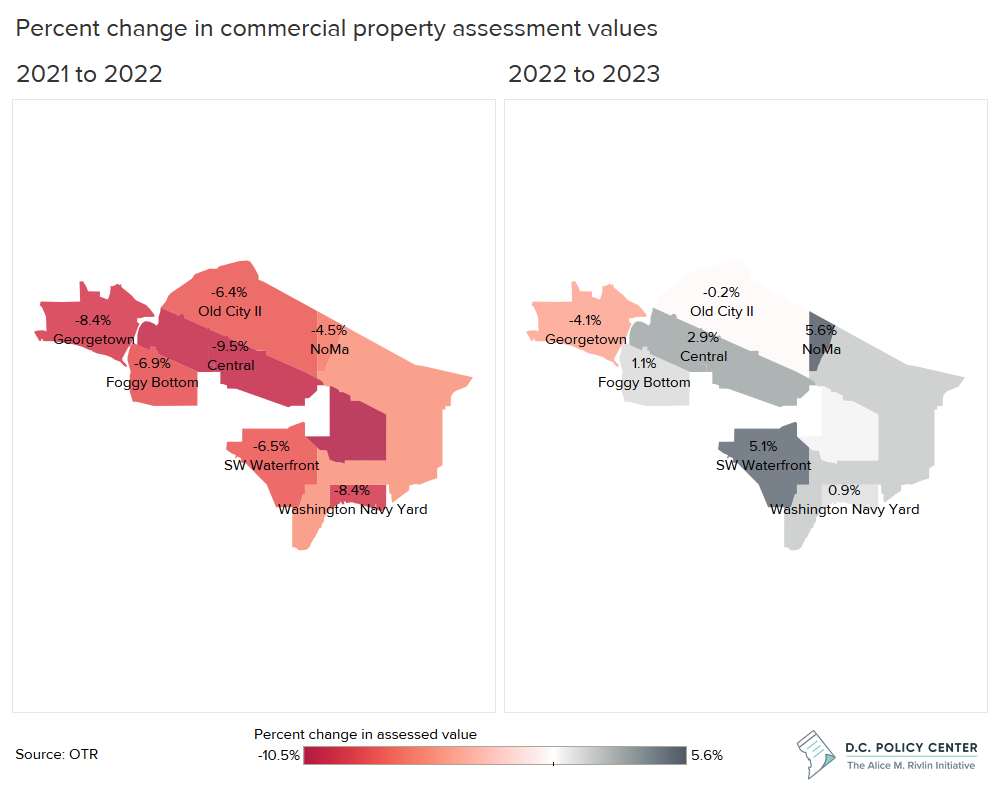
Between tax years 2021 and 2022, the Office of Tax and Revenue (OTR) reported a 7.73 percent decline in commercial property assessment values.23 That year, the District’s downtown office buildings lost $5 billion in value, reducing tax revenue by over $140 million. All of this loss is tied to weakened officed demand and higher vacancy rates.
And this decline is likely to continue. Recent research on the office market in New York City suggests that the impacts of remote work will continue to erode commercial office value. The authors show that lower current and expected future cash flow, combined with higher risks, could eventually destroy $500 billion in value in NYC’s commercial office market—a 28 percent decline.24 That is a much greater loss than the District experienced, and while NYC is a different market with its own unique challenges, the research suggests that city office markets will likely continue to lose value. This section focuses on how remote work might impact the city’s property tax revenue with an emphasis on large office spaces.
This section focuses on how continued remote work might impact the city’s property tax revenue with an emphasis on large office buildings, which is the property type most directly impacted by the shift to remote work.25
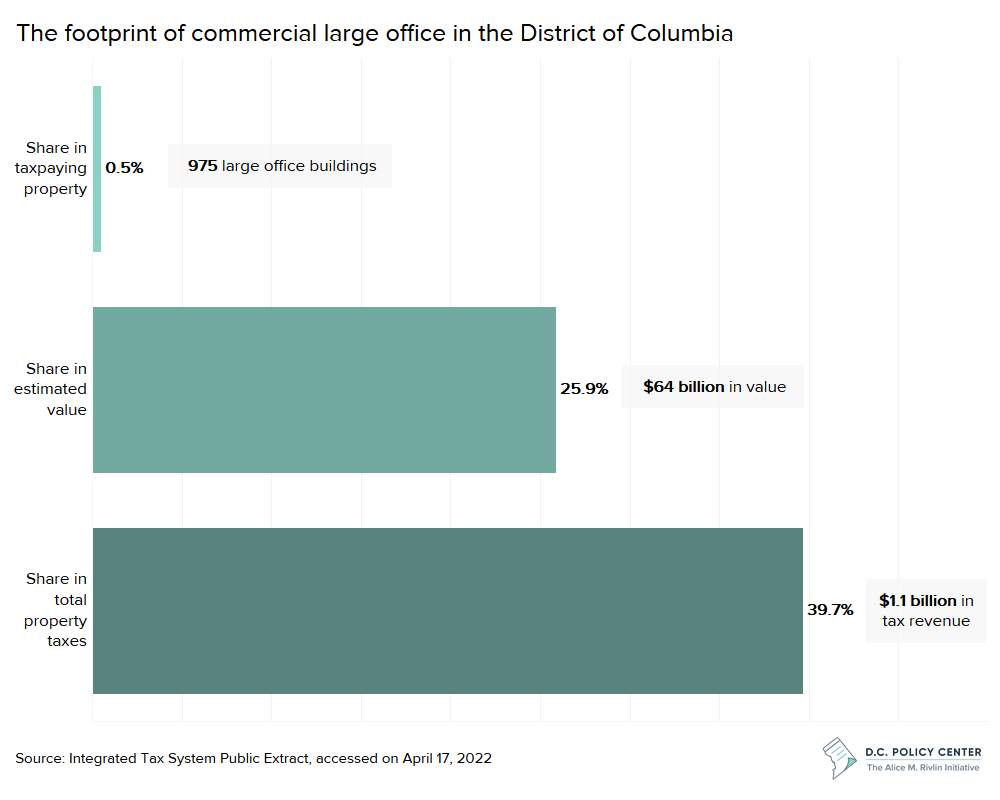
Large commercial office properties contribute to over a third of the city’s total property taxes, despite accounting for less than one percent of the city’s total taxpaying properties.
The impact of remote work on the city’s office market is particularly important to understand because property taxes account for approximately one third of the District’s tax revenue, and within this tax base, value is concentrated in downtown areas. Publicly available property tax rolls show that there are 975 large office buildings in D.C.26, and these buildings are only half a percent of all taxable property, but they collectively account for a quarter of all property values (including residential) and nearly 40 percent of all property taxes. This amounts to $1.1 billion in tax revenue for the city.27
The shift to remote work threatens this tax base because as office vacancy rates rise, the city’s office properties will generate lower rent revenue. This lowers the net operating incomes of office buildings, which directly impacts the assessment valuations, thus decreasing real property tax revenue.28
As noted, between tax years 2021 and 2022, the Office of Tax and Revenue (OTR) reported a 7.73 percent decline in commercial property assessment values. In the city’s key office neighborhoods, assessment values declined by as much as 10.5 percent—a value loss of $5 billion.29 Meanwhile, between tax years 2022 and 2023, the valuation for all commercial properties in the city increased by nearly $2.2 billion, a 2.2 percent increase.30
Nearly all of the reported increase in the valuation came from assessment increases of large office buildings in the city’s downtown areas. This is puzzling. In many of the city’s key office markets, the vacancy continued to rise in 2021. For instance, in the Central Business District, the city’s most office heavy neighborhood, the vacancy rate continued to rise from 12 percent at the onset of the pandemic and hit 17.3 as of late May 2022. Even in the city’s more mixed-use neighborhoods, such as NoMa and Capitol Riverfront, vacancy is not showing signs of slowing down.31
Thus, the recovery of the city’s office market does not align with OTR’s most recent assessment valuations and there will likely be appeals as office properties, particularly those in downtown, continue to struggle.
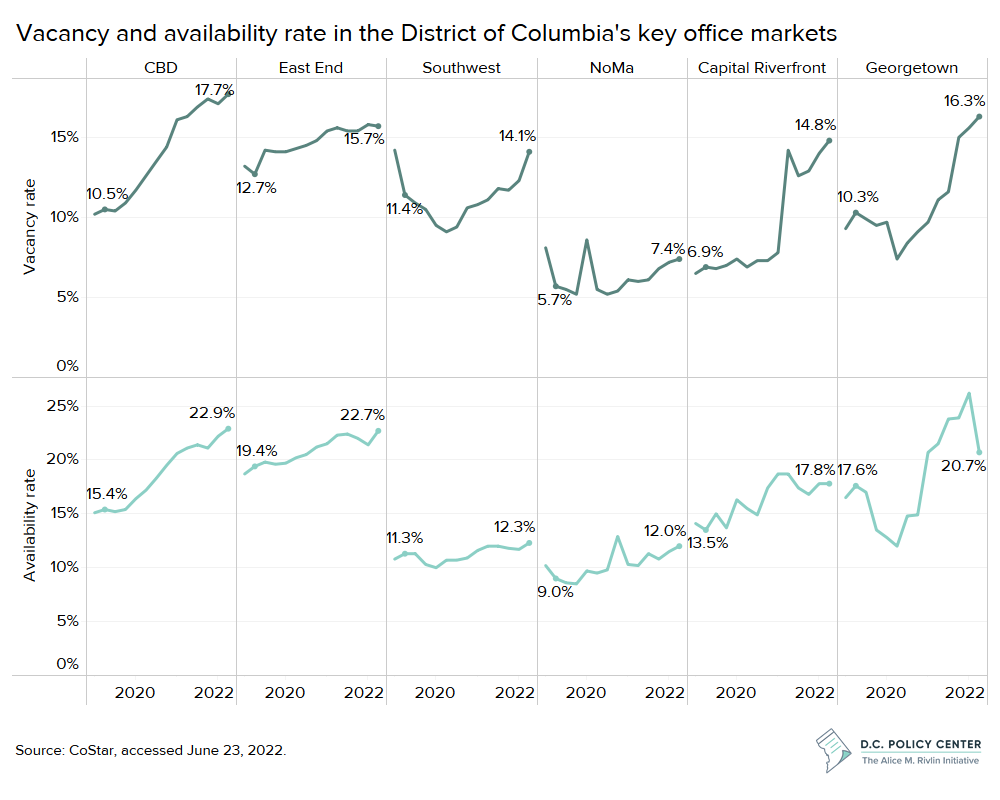
As we enter the pandemic’s third year, there is no reduction in sight in vacancy or availability in the city’s key office markets.
The city’s office vacancy rate is an indicator of how the market is currently performing, while availability rate—space that is vacant plus space with an expiring lease that will soon become vacant—can be used as a benchmark for where the market might be headed if leasing activity does not pick up.
It is normal to have some level of availability as the timing of lease expirations, and new leases do not always perfectly match up. In high-demand markets, however, availability is tight. This is no longer the case in D.C.: In the last two years, as leasing activity came to a slow crawl, the availability rate also continued to rise and has reached above 23 percent in the District’s most office-heavy neighborhoods. Compared to Q1 2019, at the end of Q1 2022, leasing activity, measured by total square feet leased, was down by 43 percent among large office properties (100,000 or more square feet) and down 25 percent among small office properties (50,000 square feet or less). It is estimated that across the entire city, it takes about 15 months to find a lease for vacant office space, so unless leasing activity does not pick up, the city’s available space will likely become vacant space.32
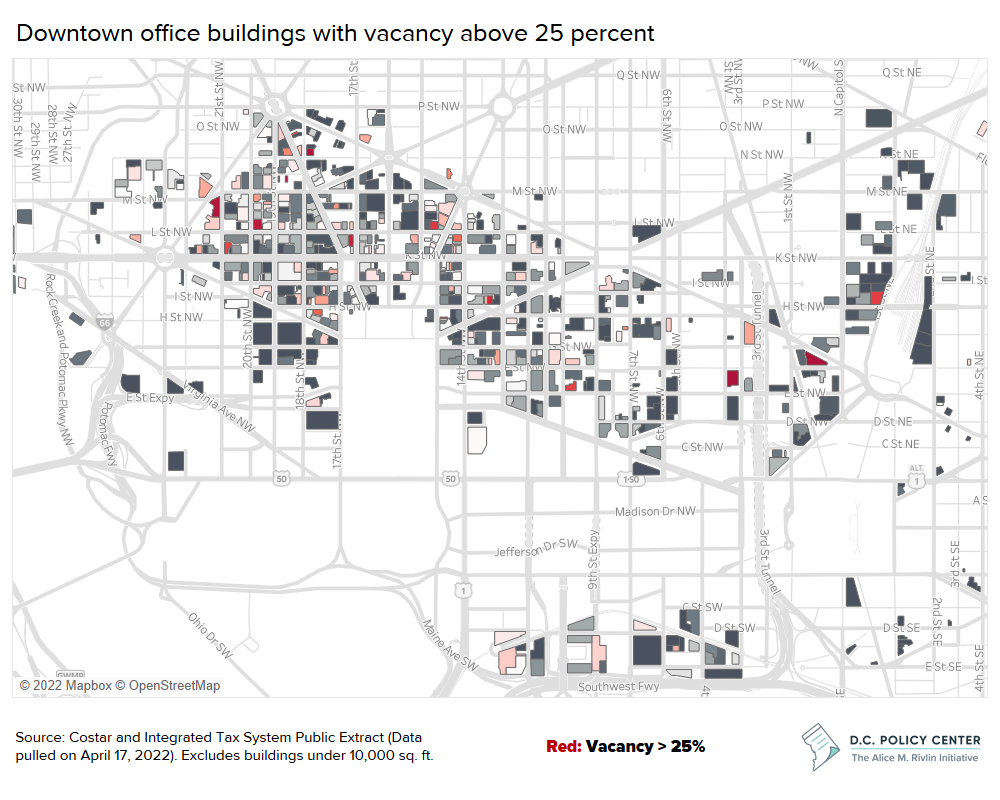
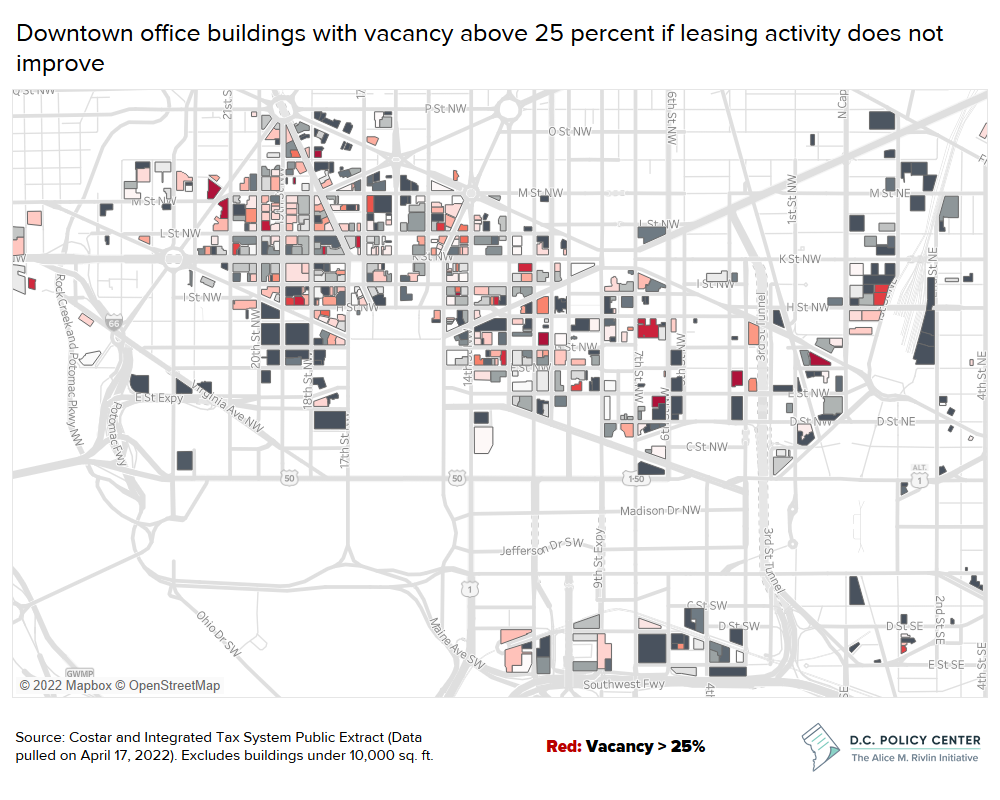
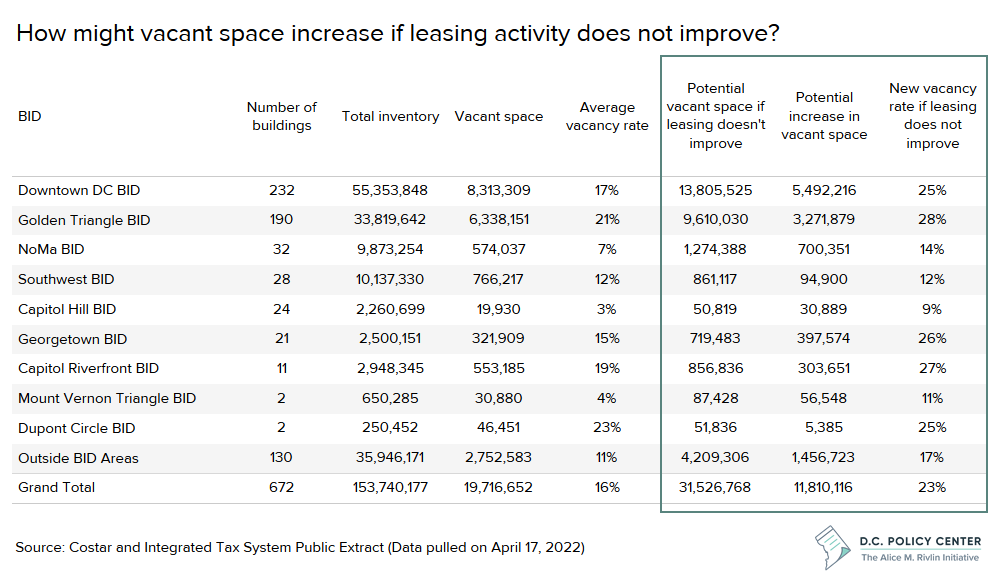
If leasing activity does not improve, vacant office space could increase by up to 60 percent, which would result in up to $128 million lost in tax revenue. In the District’s downtown area, 137 of the 733 large office buildings, or 19 percent, have vacancy rates above 25 percent. If leasing activity does not improve, the city could have as many as 238 large office buildings with a vacancy rate above 25 percent, which amounts to over a third of D.C.’s large office buildings.33
Citywide, the average vacancy rate as of late April 2022 stood at 16 percent. If leasing activity does not improve and available space becomes vacant, we estimate that this rate could increase to 23 percent and vacant space office space could increase by 11.8 million square feet, bringing total vacancy to over 30 million square feet.
And these impacts are not proportionally spread throughout the city: Downtown will be hit particularly hard with a potential vacancy rate as high as 25 percent in the DowntownDC BID and 28 percent in the Golden Triangle BID areas.34 This would translate into an additional 8.6 million square feet vacant space in these two areas.
Concentrated and persistently high vacancy means more empty office buildings, less economic activity, fewer jobs in the local service economy, and importantly, lower building values and further losses in property tax revenue. If rental income declines proportional to vacancy increases, D.C. could lose up to $128 million in property tax revenue, or more than double the expected sales tax revenue loss.35 Because approximately 40 percent of D.C.’s property tax revenue comes from large office properties, it will be difficult to shift this revenue loss to another tax base without significant economic disruptions.
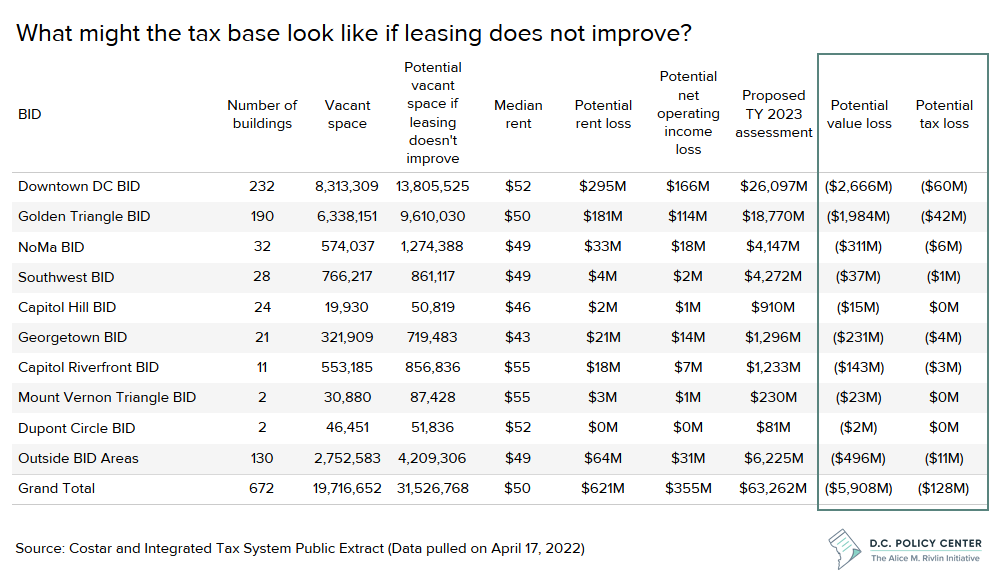
This estimate assumes that rents remain the same. Weaker demand will lead to lower rents, which can incentivize more leases, particularly among businesses that were priced out of the District before. But some value would still be lost because net operating incomes would decline. Additionally, some empty buildings could be converted to residential use, but even when this could preserve value, the contribution to property tax collections will be constrained given the much lower tax rate for residential buildings.36
Income tax revenue
So far, income tax revenue—especially individual income tax revenue—performance has been strong, but there are signs of significant risk. These include loss of higher income taxpayers and inflation, which is leading to asset price adjustments, lowering capital gains. On the positive side, withholding taxes—taxes employees withhold from paychecks, which show the strength of wage and salary incomes earned by D.C. residents—are much above pre-pandemic levels, and have been growing even when resident employment has not yet fully recovered. This suggests a shift from low-wage jobs to high-wage jobs among D.C. residents.
It is difficult to estimate what might happen to income tax collections because there is a lot we do not know. This section describes the population and taxpayer observations, and risks associated with these observations.
In recent years, the District has become more reliant on income taxes.
In 2021, income taxes accounted for 38 percent of D.C.’s gross local fund revenue. This is a 6-percentage point increase from 2019.37 This is, in part, due to strong stock market performance throughout the pandemic’s first two years and growing withholding taxes paired with declines in sales tax collections.
Net out-migration from D.C. is on the rise, but the lack of reliable population estimates makes it difficult to predict future population trends.
Prior to the pandemic, D.C. was experiencing decelerating population growth.38 While the District continued to add new residents, this growth slowed down beginning in 2012 and came primarily from natural growth (births minus deaths) and international in-migration, rather than domestic in-migration. 39 The pandemic accelerated these trends: the District lost 20,043 residents between July 1, 2020, and July 1, 2021, largely due to domestic out-migration.40
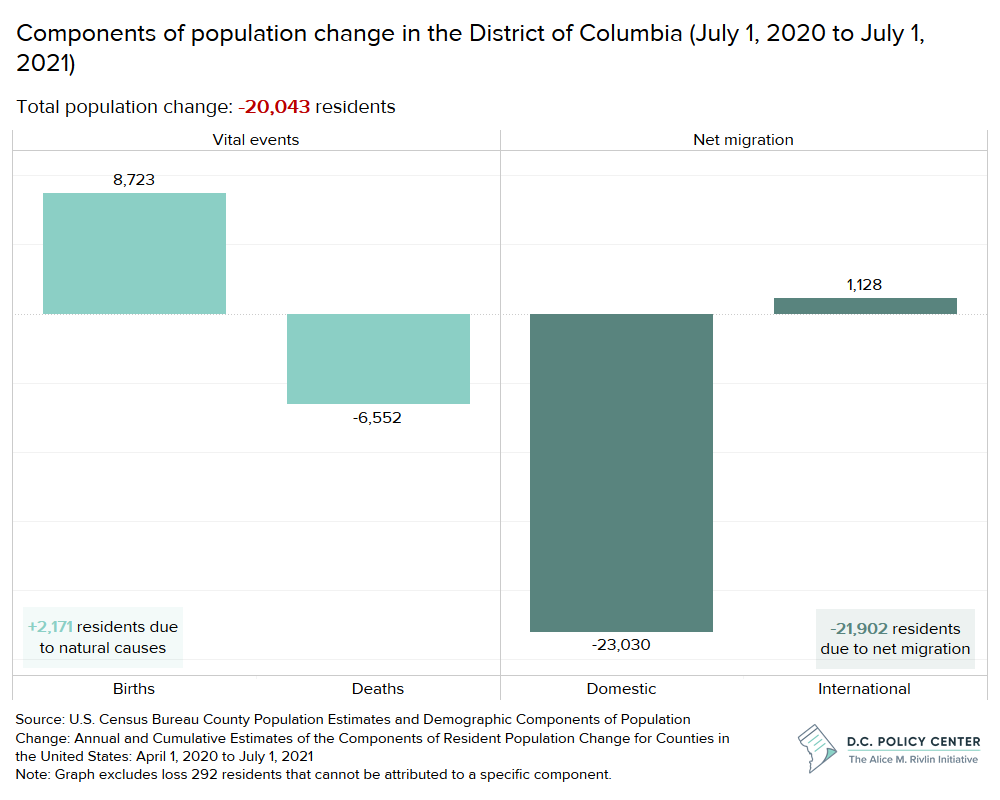
Census data suggest that in 2020, the bulk of out-migrations from the District were well-educated adults aged 24 to 35: 71 percent of those who moved out of the District held a bachelor’s degree or higher, and 61 percent of those in this group were also aged 25 to 35.41 And, this group is also more likely to be eligible to work from home. Researchers have found that among firms with a high number of educated workers, 64 percent had some workers shift to remote work. In contrast, among firms that have workers with lower levels of educational attainment, only 36 percent had workers shift to remote work.42 The out-migration of this group is potentially damaging to the city’s income tax revenue because as the District loses young, educated workers, the value of their income growth as they advance in their careers will be realized elsewhere.
However, population estimates can be unreliable, especially in the most recent Census, which had a higher undercount than a typical Census year. Similarly, the 2020 American Community Survey, which the U.S. Census Bureau relies on for annual population estimates, had such low response rates that the U.S. Census Bureau released the data as an experimental product.43
It is also possible the pre-2020 annual population estimates, which put the District’s population to 708,523 for 2019,44 were erroneous. One researcher estimates the difference between the 2019 estimate (708,523) and the 2020 decennial count (689,545) to be entirely model error. Thus, the decrease shown between 2020 and 2021 (about 20,000 residents) is a correction to previously overestimated population growth. In other words, the population loss in D.C. was not as dire as these numbers suggest, because the population was not as high to begin with
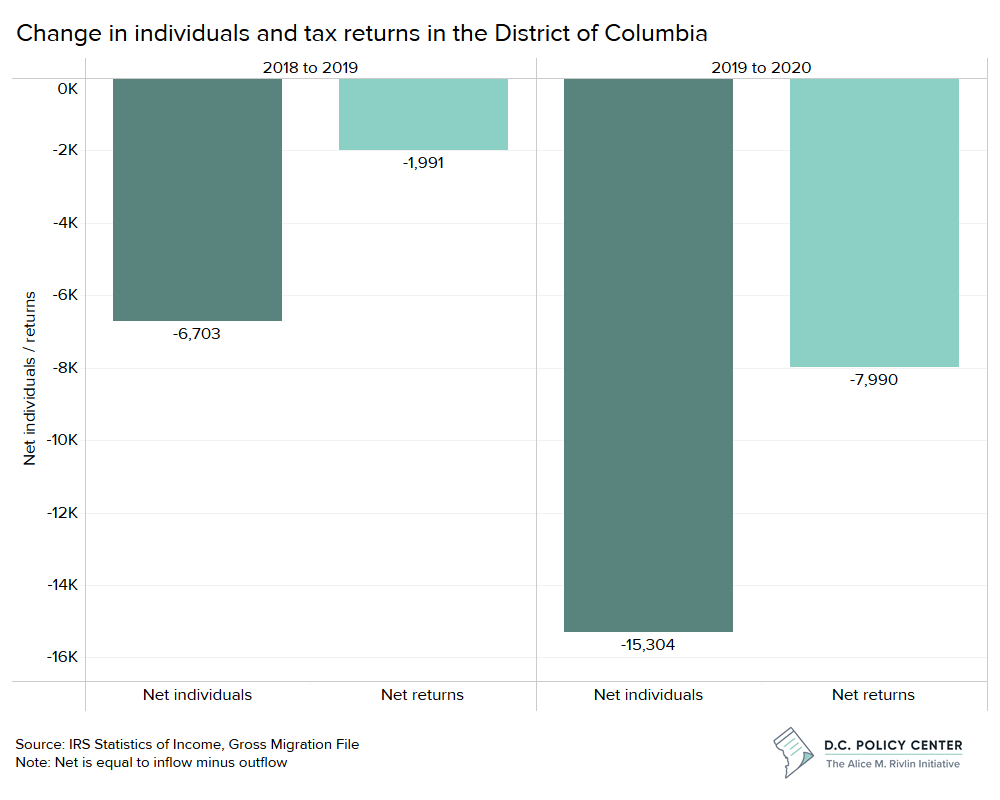
As a result, we don’t know how many residents D.C. actually lost, or how many residents will move as the pandemic continues to change the relationship between where people live and work. However, there are two other sources of data that show that residents are leaving the city. Recent Internal Revenue Service (IRS) migration data indicate the District lost 15,304 residents between 2019 and 2020.45 United States Postal Office address change filings suggest a similar loss to IRS numbers.46
The unreliability of current population estimates also suggest that there could be another shoe still to drop. Some D.C. residents likely moved elsewhere during the pandemic, intended for their move to be temporary, and therefore kept D.C. as their domicile and continued withholding taxes in D.C. If these residents return, income tax collections would not be impacted, and economic activity could increase. But, if they decided to permanently move from the District, there might be another hit to the District’s tax base.
Population estimates at the city level are already difficult. As workers continue to shift to permanent or hybrid remote working arrangements, it will be even more difficult to predict how D.C.’s population will change. This also makes estimating how remote work will impact income tax collections in the long-term difficult and current models for estimating income tax may have to be revised.
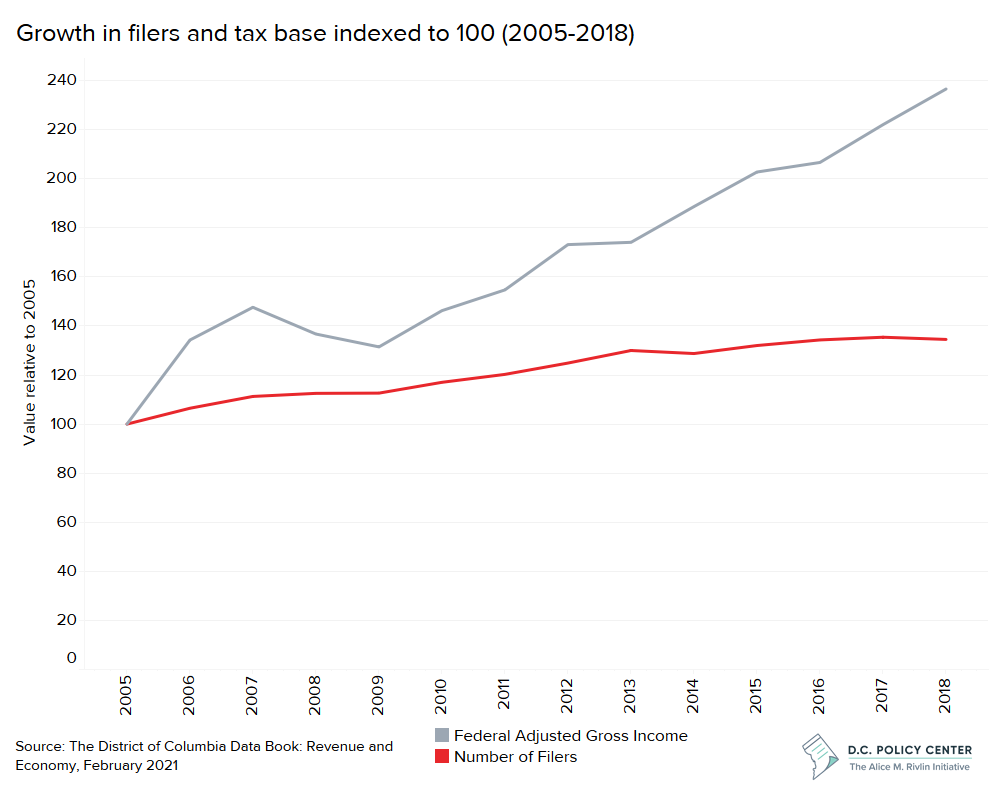
Due to these shifts in the District’s components of population change, the growth in the city’s tax base has been driven by income growth rather than an increase in the number of households filing for taxes.
Since 2013, the growth in the tax base has been driven by income growth. This suggests that prior to the pandemic, the District’s households, on net, were becoming more affluent and staying in the city. However, because population growth is primarily being driven by natural growth, the number of tax filers has become stagnant.47
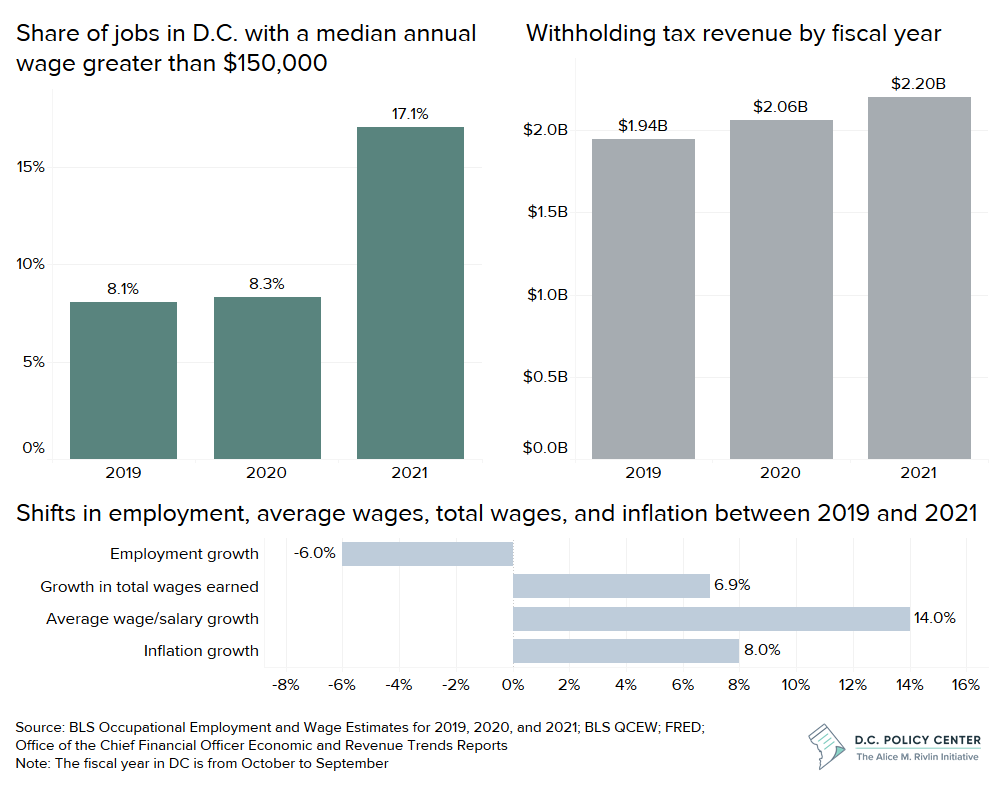
As discussed, this trend has continued throughout the pandemic and has become more puzzling. There were 7,990 fewer tax filers in D.C. in 2020 but withholding tax collections have continued to increase.48 This means that the wage and salary incomes of District residents are growing despite the loss of jobs and people.49
Recent data confirms this, showing that the share of jobs in D.C. with a median annual wage greater than $150,000 has increased from 8.1 percent tin 2019 to 17.1 percent in 2010.50 This is despite a 6 percent decline in employment between 2019 and 2021. As a result, total wages grew by 7 percent in the same period and withholding tax collections have continued to increase.51 This is in part due to the disproportionate impact the pandemic has had on service-based industries while office-based industries have been able to easily adapt by shifting to remote work.52
These data reveal another risk associated with increasingly relying on income taxes: in the pandemic economy, the robust income tax revenue growth, which is driven by the increase in high-wage earners who are taxed at higher rates, obscures the impact the pandemic has had on residents in low- and middle-wage jobs. While their earnings have relatively smaller contributions to the tax revenue (by the design of a progressive tax code), loss of this income is detrimental to these households, thus increasing the need for social spending. This trend also points to an increasing lack of income diversity, which may change the direction of policy needs, and have implications for the city’s ability to attract and retain new residents. The District is increasingly relying on a smaller group of high-wage earners. If those workers leave, the city will experience a revenue loss making it difficult to support its remaining residents.
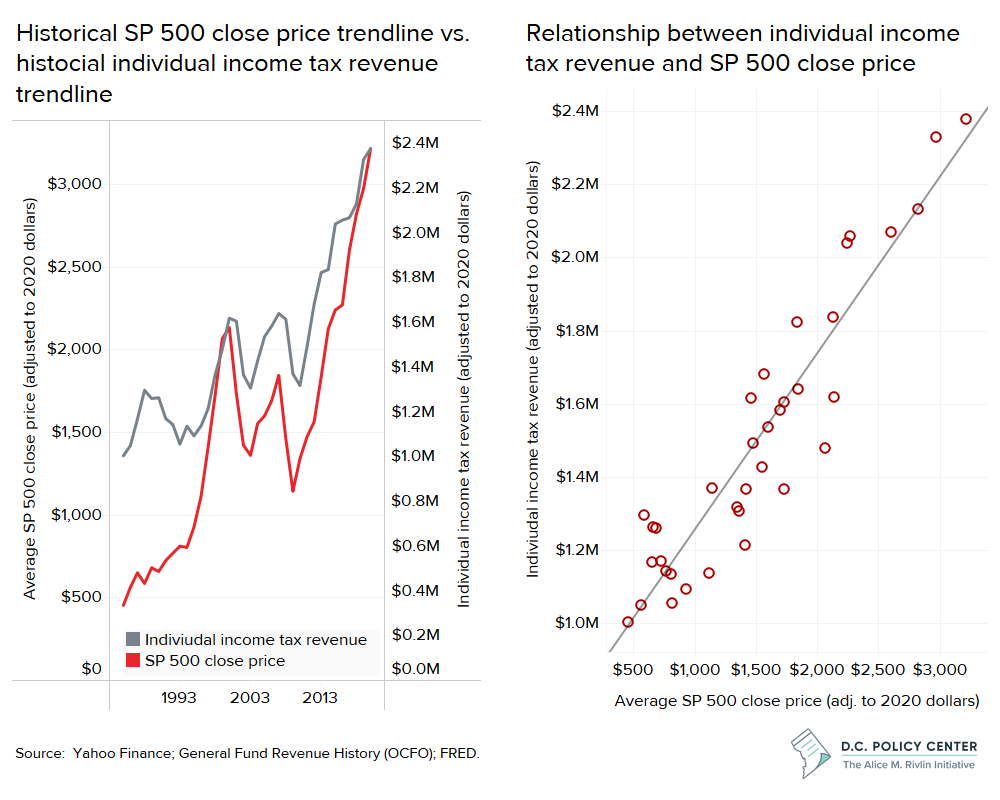
Income tax can also be volatile, in part, because it is correlated with stock market performance.
The greater reliance on income taxes is concerning not only because of the uncertainty of future migration trends, but also because income tax can be volatile. There is a strong correlation between stock market performance and income tax collections.53 When the stock market is down, particularly for long periods of time, the District’s individual income tax revenue trendline is also likely to be down. Importantly, the declines in sales and property tax collections have, to some extent, been hidden by robust income tax revenue growth. However, if and when the stock market turns (as it currently is), loss in revenue due to pandemic impacts will become apparent. This exhibits the volatility of income taxes when there is an economic downturn. If the city relies heavily on income tax returns, then revenue will be unpredictable in economic downturns.
Estimating how remote work will impact income tax collections in the long-term is difficult because there is a lot we don’t know, but data indicates it is risky to have an increasing reliance on income taxes.
We know that current population estimates can be unreliable, and that income tax revenue is volatile in economic recessions. Now, the rise of remote work makes it easier for residents and workers to move from one jurisdiction to another without having to worry about commute times. We don’t yet know to what extent this will alter the region’s population. If hybrid work arrangements become the norm, people will likely need to live in the region if they hold regional jobs, but the question is where in the region they will choose to live. The weight of these unknown variables makes it difficult to estimate how remote work will impact income tax collections.
However, there are still ways the city can mitigate some of the potential risks, such as working to make sure D.C. is an attractive place to live. Retaining existing residents and attracting new residents is particularly critical to maintaining the health of the city’s income tax revenue base, particularly given the long-standing challenge of the District’s inability to tax the income earned by non-residents.
How can we address these future challenges?
In total, we are predicting a $190 million loss in tax revenue if the city’s commuters continue to work from home. And, this is likely an underestimate, as it does not account for indirect impacts, such as an eventual shift in service jobs to where residents are located rather than near office spaces, or losses in income tax revenue, which are difficult to predict. Despite some of the positives associated with remote work, such as an increase in quality of life from the perspective of many workers, this loss in revenue is a real challenge to the future of the District’s fiscal health. For the city to continue down a path of economic growth and to be able to continue offering services to its residents, policymakers will need to figure out how to make up for this lost revenue.
The best way for the city to maintain and grow its tax base in this new post-pandemic environment is to double down on retaining existing and attracting new residents. To do so, city leaders will have to implement innovative policy solutions, focused on addressing pre-pandemic challenges that have since been exacerbated:
Recommendation 1: Diversify downtown
While in the past, D.C. has been thought of as ‘recession proof’ due to the strong presence of federal workers, downtown is not resilient to the current economic crisis or future economic downturns. In the long-term, downtown D.C. needs to have a greater mix of uses to guarantee attraction of residents, workers, and visitors regardless of economic trends. Office space (and its dedicated parking space) is no longer being used efficiently and the demand for space is shifting.
The city needs to encourage a greater mix of uses and allow for a more creative use of vacant space downtown. This can be done by creating more flexible zoning, such as through an adaptive reuse ordinance. Such policies can be further enhanced by pairing with the option to remove of barriers to development, such as expediated review or less stringent building code.
In the near-term, the District needs to bring people downtown. This can be done through innovative uses of space (such as communal artist space), an expansion of the open streets program to downtown, or incentivizing new tenants to locate downtown (such as through an expansion of local graduate programs from university campuses to downtown locations).
Recommendation 2: Build more housing
Addressing housing shortages and affordability is a critical step to attracting new and retaining existing residents. It has become easier for residents in remote eligible jobs to live in a nearby jurisdiction that offers more space and affordability. Researchers have found that remote workers are more likely to demand more space.54 In D.C., where the cost of living is already high, this may incentivize people to move to more affordable jurisdictions as the importance of commute times declines.55 One survey of workers found that 42 percent of remote workers plan to move in the next year, whereas only 26 percent of on-site workers plan to move. And, 35 percent of the remote workers that are planning to move responded that they are looking at more affordable markets.56
Increasing the city’s housing supply, even its market rate housing supply, will help mitigate some of the upward pressure on pricing57 and offer more options to those that might be looking for more space. As the city builds more housing, policymakers should be thoughtful to address changes in demand for certain types of spaces, whether that be homes at a certain affordability level or that offer a certain amount of space.
Recommendation 3: Simplify the process of business formation
To start and operate a business in the District, business owners have to navigate a complicated system that does not offer any discernible public benefits.A key draw to the District is the urban amenities and density of jobs offered compared to other jurisdictions. To bring in new residents, the city also needs to be able to attract, create, and retain the businesses that offer these amenities and jobs.
As it stands, it is difficult to both obtain and renew business licenses in the city. Legislation that eases business licensing requirements, such as Bill 24-301, the “Business and Entrepreneurship Support to Thrive (BEST) Amendment Act of 2021,” is particularly important in the context of post-pandemic recovery because businesses thrive in the absence of regulatory thicket.58
In fact, there are several barriers to business formation and retention that the city can improve upon, including a temporary one-year basic business license that is automatically issued when someone registers a business, an increase in the limit for the Clean Hands test from $100 to a much higher level, increased information infrastructure investments, support to turn online businesses into brick-and-mortar businesses, and removal of the requirement to register for an entirely new business license following an address change.
These changes would not only serve to fill empty vacant space with new businesses, but address burdens that more heavily impact low-income residents and residents of color.59
Recommendation 4: Support public transit
The future of the region’s public transit system is at risk, as it is no longer serving residents across all demographics at the capacity needed to support its operations.Average daily Metro entries continue to be about 70 percent below pre-pandemic levels, and average daily bus boardings remain 57 percent below pre-pandemic levels, even with public health restrictions lifted.60
Prior to the pandemic, the region’s public transit system supported workers and residents across all income and demographic groups. However, when office workers shifted to remote work arrangements, the region’s transit system primarily served essential workers and those in service-based industries, often low-income and Black or Hispanic residents.61
Sustaining the region’s transit system, which is essential to many residents, requires support by all residents. This support will dwindle as there continue to be delays and safety concerns, especially among those that already rely on transit less due to remote work. And, given the relatively large amount dedicated to WMATA within D.C.’s budget, the loss of ridership and support could also impact the District’s fiscal health.
Public transportation is still a critical need to many and the region’s system will need to adapt to current and future trends to maintain support. For instance, as the geography of work changes, the areas in which there is greater demand for transit may shift.This is particularly important when thinking about late night transit that often supports service workers. A more robust transit system specific to the District, such as the Circulator, may help fill in some of these demand areas and have the opportunity to build positive public reception.
Recommendation 5: Invest in public safety
Public safety and perception of public safety has become increasingly important to attracting new and retaining existing residents. As of mid-June 2022, total crime has increased by 4 percent year-over-year. Violent crime increased by 15 percent and property crime has increased by 2 percent.62 This trend is not unique to D.C.63; however, importantly, the perception of crime has also increased. Public safety is important aspect of a high quality of life and addressing these challenges will also build a positive perception for the city among existing residents and potential residents.
Recommendation 6: Focus on new, forward-thinking policy
In addition to addressing existing barriers that have been exacerbated by the pandemic, the city also needs new policies that directly address the shift to remote work. Incentivizing people to return to the office is backward looking and will likely not drive more people into the city, but there is an opportunity to offer incentives to businesses that employ workers that live in the District.
For example, the Virginia Economic Development Partnership adopted new statutory language for their incentive programs so that telework positions held by Virginia residents are rewarded the same as an in-person jobs.64 This strategy relinks the relationship between where people live and work, and in D.C., where there is a high density of job, it may be particularly effective in attracting new and retaining existing residents. However, with a high cost of living, equity concerns should be considered when implementing a similar strategy, such as only requiring a certain share of employees to be located in the District for a business to qualify.
Recommendation 7: Play to the District’s core competitive advantages
As many scholars have pointed out, cities generally bounce back after experiencing pandemics, riots, fires, and other catastrophic events.65 The agglomeration and density in cities allow for opportunities that cannot exist in the suburbs. People locate to cities not just to live and work, but because there are jobs, amenities, and networks. The District should continue to attract and retain these features and do so in a way that makes the city a great place to work remotely. This could include offering enhanced quality of life though active public spaces or enhanced municipal WiFi. This might also serve to boost tourism, which will also help replace some of the lost economic activity from commuters.
And, as neighborhoods benefit from remote work (compared to downtown), there is the opportunity for the city to benefit from this enhanced economic activity. Finally, as the city strives to attract and retain residents, it should also work to maintain its position as a job hub of the region. Even if new workers do not locate in D.C., it will be beneficial to boost the number of commuters coming to the city. With hybrid work arrangements, each commuter adds less to D.C.’s economy compared to pre-pandemic; however, increasing the number of jobs and commuters might serve to replace at least some of this loss.
As the city enters a period where the economy and population growth are no longer outpacing the nation, the future of D.C.’s tax base becomes more dependent on things outside the realm of fiscal policy and the attractiveness of D.C. in private sector and household decisions is particularly important. Understanding and adapting to emerging trends is critical to being able to boost the city’s attractiveness. This paper outlines the estimated impacts of remote work as they stand today, but the D.C. Policy Center will continue to monitor trends as the city continues to move towards a new long-term equilibrium.
Data and methodology
Sales tax
The following inputs and sources were used to calculate our estimate of remote work’s impact on sales tax revenue:
- Pre-pandemic number of weeks in the city: We assumed workers spent an average of 50 weeks in the city prior to the pandemic to account for two weeks of time off. This aligns with the assumption used by other researchers that have also attempted to calculate a change in spending due to remote work.
Using the above assumptions, we calculated the annual spending contribution of commuters pre-pandemic and the resulting sales tax collection, and then calculate how this changes under the various work from home scenarios. This is not meant to be an exact estimate, but illustrative of the impacts remote work will likely have on the city’s sales tax base.
Property tax
Using data from CoStar and the Integrated Tax System Public Extract, we assessed current vacant and available space in the city’s office market. Vacant space is space that is currently available for lease. Available space is space the amount of space that is currently being marketed as available for lease or sale in a given time period, including space that is not currently vacant but is up for a lease renewal soon. We assume that if leasing activity does not pick up, the city’s available space will become vacant space (rather than be renewed or leased to new tenants). We then calculated the decline in assessment values, a thus, property tax revenue, based on the assumption that vacant space results in a decline in net operating income, which directly impacts assessment values.
Acknowledgements
The authors are grateful to Kartik Athreya, Richard Auxier, Joe Cortright, Tracy Hadden Loh, and Santiago Pinto for providing useful comments. Their review in no way indicates an endorsement of this report, and all errors are the responsibility of the D.C. Policy Center authors.
The authors would also like to thank The Kimsey Foundation, Monumental Sports & Entertainment, Quadrangle Development, Tishman Speyer, and Ruben Companies for their support to make this work possible. The views expressed in this paper are those of the authors and should not be attributed to funders or reviewers.
Endnotes
- The District’s population in 1997 was 528,752 and grew to 704,147 as of 2019. U.S. Census Bureau, Resident Population in the District of Columbia [DCPOP], retrieved from FRED, Federal Reserve Bank of St. Louis, July 1, 2021
- Between 1997 and 2019, the city added about 175,000 private sector jobs. The source should be updated: U.S. Bureau of Labor Statistics and Federal Reserve Bank of St. Louis, All Employees: Total Private in District of Columbia [SMS11000000500000001], retrieved from FRED, Federal Reserve Bank of St. Louis; https://fred.stlouisfed.org/series/ SMS11000000500000001, March 2, 2022.
- The city added 4,439 new business establishments. County Business Patterns, 1997 and 2019.
- Office of the Deputy Mayor for Education (2022) Edscape – Public School Enrollment Over Time. Retrieved on June 20, 2022.
- Data from Bureau of Economic Analysis, State Annual Personal Income: Table SA51 fo3 2021 and historic tables for 1999/2000.
- General fund history data obtained from the Office of Revenue Analysis.
- Tourism and tourist spending are also key contributing elements to the District’s fiscal health. While tourism industry took a major hit due to the pandemic, we do not cover the future impacts in the scope of this report as this is likely a temporary shock and less directly impacted by the shift to remote work. For more information on the impact of tourism on the city’s economy, see Destination DC’s Washington, DC Visitor Research. For more information on how the pandemic has impacted tourism in the District, see: Hopkins, Paige (2022). “D.C. tourism returns.” Axios Washington, DC.
- According to Google mobility data, by June 17, 2022, time spent in retail establishments, restaurants, museums, shopping centers, and movie theatres had recovered to about 70 percent of pre-pandemic levels. Time spent in groceries and pharmacies had recovered to about 80 percent. People spent 8 percent more time at home. For details, please see: https://www.gstatic.com/covid19/mobility/2022-06-17_US_District_of_Columbia_Mobility_Report_en.pdf
- Survey of Working Arrangements and Attitudes, June 2022 update.
- D.C. Office of the Chief Financial Officer (2022), Washington DC’s Tax System—A visual guide, page 33. Certain items such as groceries, medicine and medical devices, diapers, feminine hygiene products are exempted. Also certain services such as internet access, valet parking, professional services, like tax help, and personal services like yoga studios are also exempt.
- D.C. Office of the Chief Financial Officer Revenue Chapters, various years.
- D.C. Office of the Chief Financial Officer Quarterly Revenue Estimates, various years.
- Note: Groceries are not taxed in D.C.
- D.C. Office of the Chief Financial Officer Revenue Chapters and Quarterly Revenue Estimates, various years.
- There are many other predictors as well that are not considered in this analysis, including tourism or consumer confidence.
- McConnell, Bailey and Sayin, Yesim (2022). “Remote work and the future of D.C.: How is remote work changing the geography of work in the District of Columbia?” D.C. Policy Center, Washington D.C.
- Niemira Michael P. and Connolly John (2012). “Office-Worker Retail Spending in a Digital Age.” International Council of Shopping Centers.
- McConnell, Bailey and Sayin, Yesim (2022). “Remote work and the future of D.C.: How is remote work changing the geography of work in the District of Columbia?” D.C. Policy Center, Washington D.C.
- Estimate calculated by the D.C. Policy Center. See the data and methodology section for more details on assumptions and methods.
- Survey of Working Arrangements and Attitudes, April 2022 update.
- Estimate calculated by the D.C. Policy Center. See the data and methodology section for more details on assumptions and methods.
- D.C. Office of the Chief Financial Officer Revenue Chapters, various years; D.C. Open Data Integrated Tax System Public Extract, accessed on April 17, 2022.
- D.C. Office of Tax and Revenue, March 2021 release of annual assessments of all real properties for Tax Year 2022, available here: https://otr.cfo.dc.gov/release/district-columbia-tax-assessments-indicate-real-estate-market-decline
- Authors also find that higher quality office buildings were somewhat buffered against these trends due to a flight to quality, while lower quality office buildings see much more dramatic swings. Gupta, Arpit and Mittal, Vrinda and Van Nieuwerburgh, Stijn, Work From Home and the Office Real Estate Apocalypse (May 31, 2022).
- The city’s property tax collections have also been impacted by the rapid increase in housing prices that occurred throughout the pandemic, especially single-family home prices. However, given the tax rate differences between commercial and residential properties, the benefits stemming from single-family property value increases do not make up for the loss in value stemming from rising office vacancy. Residential property, including multifamily, are taxed a $0.85 per $100. Commercial and industrial real property, including hotels and motels, are taxed between $1.65 and $1.89 per $100 depending on the assessed value. See: DC Office of Tax and Revenue Real Property Tax Rates
- We define this as buildings with leasable space of 100,000 sq. ft. or more.
- D.C. Open Data Integrated Tax System Public Extract, accessed on April 17, 2022.
- This is because the District assesses the taxable value of income generating buildings like large office buildings by estimating the present value of future income that can be earned through lease or rental revenue (minus the cost of maintaining and managing the building, and all other costs, such as taxes and insurance). The assessors (with some modifications) do this by dividing the net operating income reported by property owners by the cap rate that is most appropriate for that building, There is a two year lag between the period for which the income is reported and the period in which the taxes are paid. For example, TY 2023 tax bills will depend on the assessments calculated in 2022, based on net operating incomes reported for calendar year 2021.
- D.C. Office of Tax and Revenue, March 2021 release of annual assessments of all real properties for Tax Year 2022, available here: https://otr.cfo.dc.gov/release/district-columbia-tax-assessments-indicate-real-estate-market-decline
- D.C. Office of Tax and Revenue, March 2022 release of annual assessments of all real properties for Tax Year 2023, available here: https://otr.cfo.dc.gov/release/district-columbia-tax-assessments-shows-signs-real-estate-market-recovery
- Obtained from CoStar.
- Obtained from CoStar.
- CoStar and D.C. Open Data Integrated Tax System Public Extract (data pulled on April 17, 2022). Note: Excludes buildings under 10,000 square feet.
- CoStar and D.C. Open Data Integrated Tax System Public Extract (data pulled on April 17, 2022). Note: Excludes buildings under 10,000 square feet. Estimates calculated by the D.C. Policy Center. See the data and methodology section for more details on assumptions and methods.
- CoStar and D.C. Open Data Integrated Tax System Public Extract (data pulled on April 17, 2022). Note: Excludes buildings under 10,000 square feet. Estimates calculated by the D.C. Policy Center. See the data and methodology section for more details on assumptions and methods.
- Kathpalia, Sunaina and Yesim Sayin (2021). “Examining office to residential conversions in the District.” D.C. Policy Center, Washington, D.C.
- D.C. Office of the Chief Financial Officer Revenue Chapters, various years.
- McConnell, Bailey and Sayin, Yesim (2022). “A new regional playing field: How can D.C. stay economically competitive with its suburban neighbors?” D.C. Policy Center, Washington D.C.
- Kathpalia, Sunaina (2021). “Births and International In-migration Maintain the District’s 15-year Population Growth.” D.C. Policy Center, Washington D.C.
- U.S. Census Bureau Population Estimates and Demographic Components of Population Change: Annual and Cumulative Estimates of the Components of Resident Population Change for Counties in the United States: April 1, 2020 to July 1, 2021.
- McConnell, Bailey (2022). “Demographic shifts in the District of Columbia following the COVID-19 pandemic.” D.C. Policy Center, Washington D.C.
- Bartik, Alexander W., et al. (2020). “What jobs are being done at home during the COVID-19 crisis? Evidence from firm-level surveys.” National Bureau of Economic Research, Working Paper 27422.
- For more information on the most recent Census, see: https://www.census.gov/newsroom/press-releases/2021/experimental-2020-acs-1-year-data.html
- U.S. Census Bureau, Resident Population in the District of Columbia [DCDIST5POP], retrieved from FRED, Federal Reserve Bank of St. Louis; https://fred.stlouisfed.org/series/DCDIST5POP, June 23, 2022.
- The IRS estimate of migrants typically varies from the U.S. Census estimate of domestic out-migration. The difference is largely due to differences in the periods covered by the two sources, but can also emanate from methodology differences. Vintage Census population estimates cover the 12-month period between July 1 and June 30th; IRS estimates, which are based on income tax returns, cover the calendar year.
- Moored, Ginger (2022). “Pandemic led to DC population loss, but data suggests population rebound last summer.” District, Measured.
- Sayin, Yesim (2021). “What is happening to the District’s personal income tax base?” D.C. Policy Center, Washington, D.C.
- D.C. Office of the Chief Financial Officer Economic and Revenue Trends Reports
- McConnell, Bailey and Sayin, Yesim (2022). “Puzzle of the week: Why are D.C.’s withholding taxes growing, if residents and tax filers are leaving?” D.C. Policy Center, Washington, D.C.
- BLS Occupational Employment and Wage Statistics (OEWS) Survey; Federal Reserve Bank of St. Louis (FRED).
- BLS Quarterly Census of Employment and Wages (QCEW); Federal Reserve Bank of St. Louis (FRED).
- The higher cost of living may also be driving out population with relatively low-wages.
- Estimated by the D.C. Policy Center using data from Yahoo Finance; D.C. Office of the Chief Financial Officer General Fund Revenue History; FRED.
- Stanton, Christopher T. and Tiwari, Pratyush (2021). “Housing consumption and the cost of remote work.” NBER Working Paper Series, Working Paper 28483
- Sayin, Yesim (2021). “The declining importance of commute times.” D.C. Policy Center, Washington, D.C.
- Salviati, Chris (2021). “How will remote work impact housing location preferences?” Apartment List.
- Cortright, Joe (2020). “Building more housing lowers rents for everyone.” City Observatory.
- Sayin, Yesim (2022). “D.C. Council testimony on Bill 24-301, the ‘Business and Entrepreneurship Support to Thrive (BEST) Amendment Act of 2021’” D.C. Policy Center, Washington, D.C.
- Zickuhr, Kathryn (2019). “Applying a racial equity lens to fines and fees in the District of Columbia”, D.C. Policy Center.
- WMATA Ridership Data Portal, accessed on June 10, 2022
- George, Justin, et al. (2021, updated 2022). “The pandemic changed the workday, but will transit riders return?” The Washington Post, Washington, D.C.
- Metropolitan Police Department, District Crime Data at a Glance, available at: https://mpdc.dc.gov/page/district-crime-data-glance
- Pintado, Amanda Perez (2022). “How the crime rate is preventing some US cities from the ‘return to normal’” USA Today.
- Virginia Economic Development Partnership
- Many have speculated that cities will recover: Wilbert, Tony (2020). “Cities Will Bounce Back From Crisis as They Always Have, ULI Honoree Predicts.” CoStar, Washington, D.C.; Jaffe, Eric (2020). “Why Richard Florida worries cities will recover too quickly from Covid.” Sidewalk Talk via Medium; McArdle, Megan (2020). “Opinion: Cities will make a comeback after the coronavirus. They almost always do.” Washington Post, Washington, D.C.