In “The Great Sort: Part I,” I documented the increasing economic segregation within the Black community in the Metropolitan Washington region. I did so by showing the degree to which poor Black residents and affluent Black residents had increasingly come to live in different neighborhoods as measured by metro-wide statistics both in Metropolitan Washington and in 11 comparable metro areas.
A finer-grained analysis better illustrates these trends. Focusing just on the Washington region, I’ve compared the income composition of census tracts for the 1980 Decennial Census to the American Community Survey 2016.
I’ve defined the “100 Poor Black” census tracts as those with the largest absolute numbers of poor Black households, and defined the “100 Affluent Black” census tracts as those with the largest absolute numbers of affluent Black households. I rely on absolute numbers rather than poverty rates or affluence rates because the Census data do not allow a clean calculation of these shares at the census tract level.[1] These census tracts are also not necessarily majority Black census tracts today, although almost all of the 100 Poor Black census tracts and most of the 100 Affluent Black census tracts were majority Black in 1980.
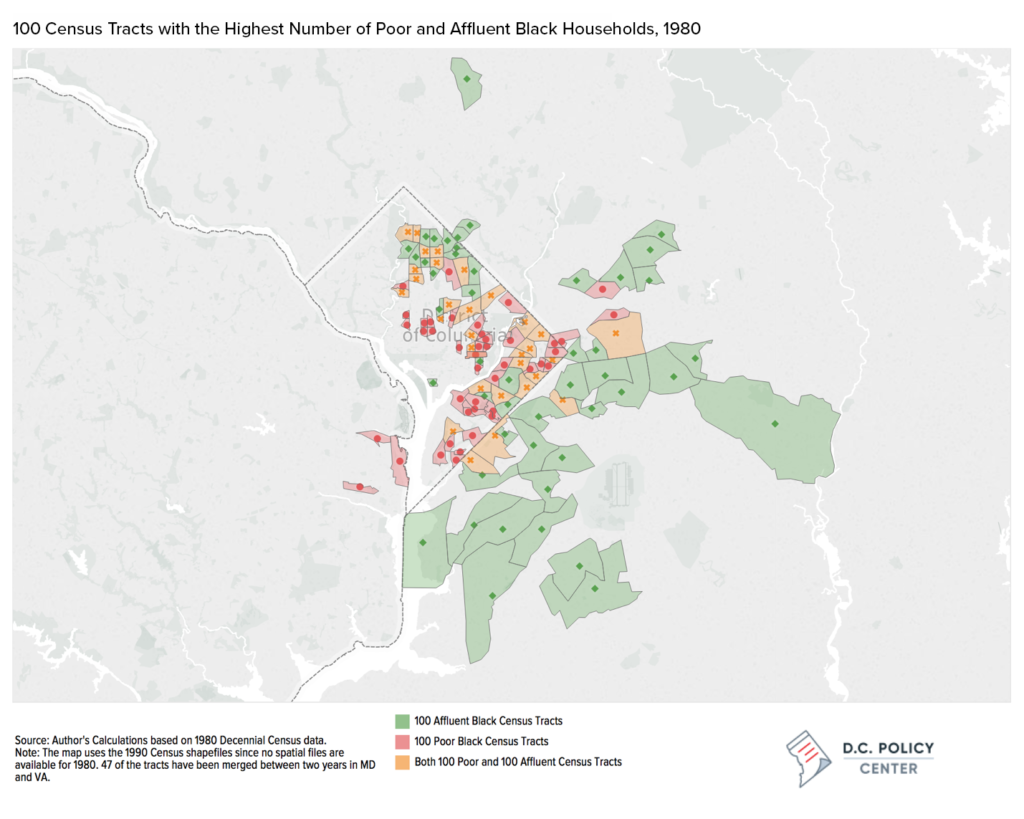
The map below depicts the locations of the 100 Poor Black census tracts (marked red), the 100 Affluent Black census tracts (marked green), and the census tracts that fall on both lists (marked orange) in 1980.
- In 1980, of the 100 poor Black census tracts, 88 were in the District of Columbia, eight in Prince George’s County, and four in Alexandria.
- By 1980, Black suburbanization, however, had already been well underway after I had left the Urban League in 1968 (and had moved to Albuquerque in 1971). In 1980, of the 100 Affluent Black census tracts 53 were in D.C., 44 in Prince George’s County, two in Montgomery County and one in Arlington County.
- In 1980, 37 census tracts overlapped – that is, they fell within both the 100 census tracts with the highest number of poor Black households and the 100 census tracts with the highest number of affluent Black households.
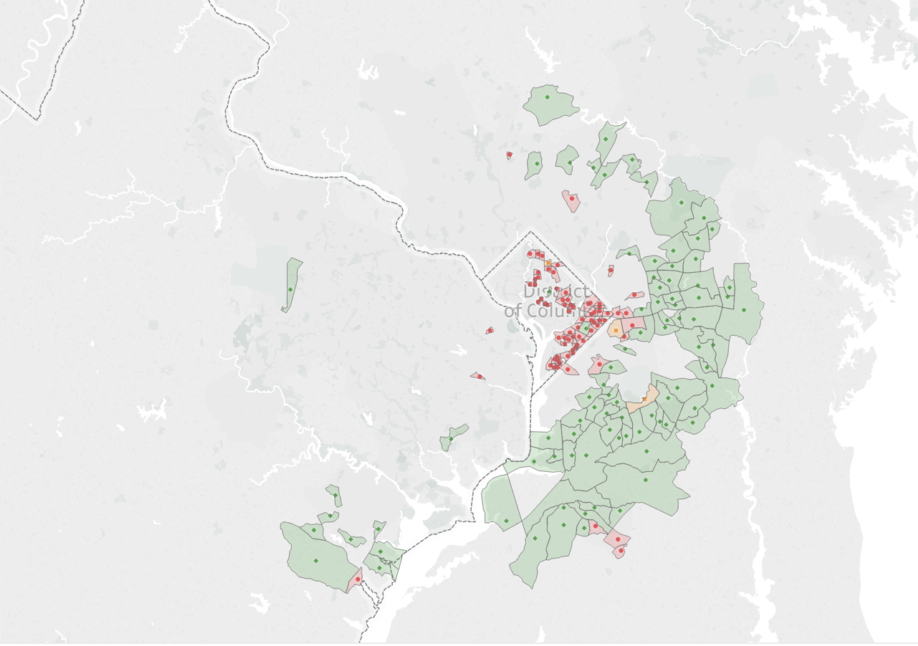
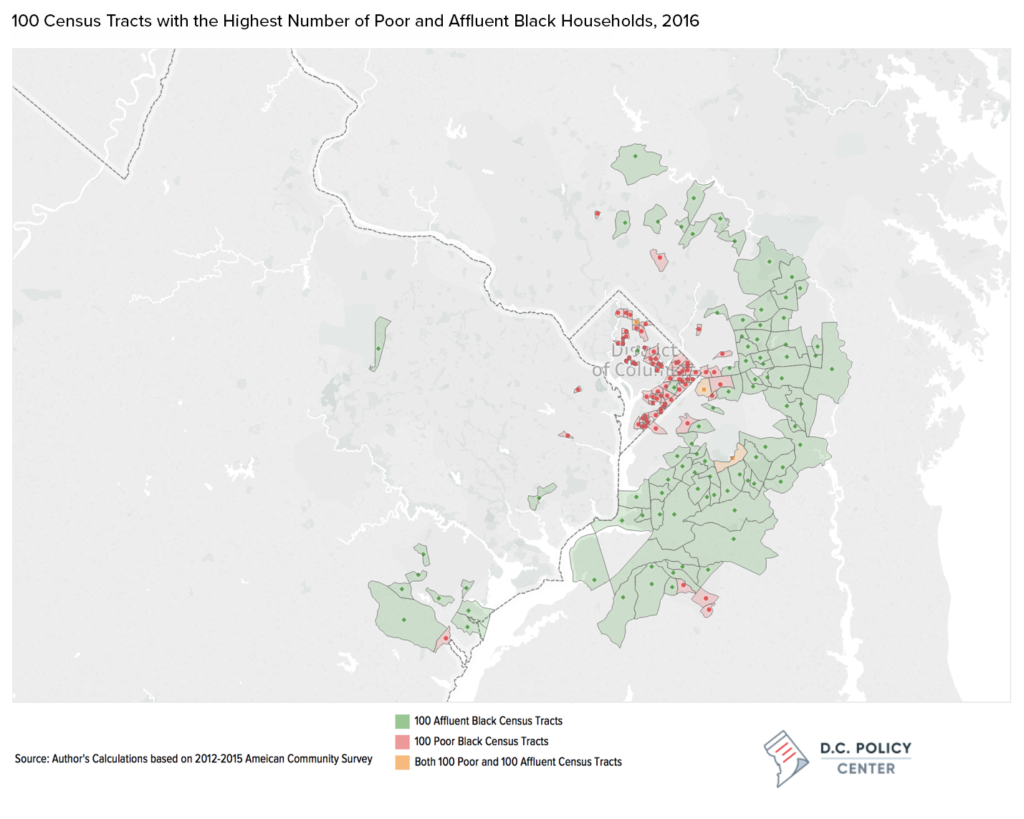
The map below depicts the changes in the residential distribution of the poor Black census tracts and affluent Black census tracts over the next almost half century.
- By 2016, of the 100 Poor Black census tracts, 75 were still located in D.C., but there were 14 now in Prince George’s County, four in Montgomery County, and one each in Arlington and Fairfax counties and Alexandria city, and three in Maryland’s second-ring suburb Charles County and one in Virginia’s second-ring suburb Prince William County.
- By 2016, of the 100 affluent Black census tracts, only six were located in D.C., while the re-concentration of affluent Black households had continued into Prince George’s County (68 tracts!). In the other older “core” suburbs there were five affluent Black tracts in Montgomery County, two in Fairfax County, and one in Arlington County. However, the suburban Black diaspora had reached well beyond the core communities, with second-ring Charles County having nine and second ring Prince William County having eight affluent Black tracts, and even more distant Manassas City having one.
- By 2016, only four of the Poor Black census tracts overlapped with the 100 Affluent Black census tracts – two each in D.C. and Prince George’s County. Thus, over 35 years there had been a great sorting apart of the Black community along income lines.
You might ask: Does focusing on just the 100 Poor Black census tracts and 100 Affluent Black census tracts fairly represent trends within the Black community throughout metro Washington? After all, within the 13 jurisdictions that defined metro Washington in 1980 there were 637 census tracts in all. Yet in 1980 my definition was comprehensive: those 100 Poor Black tracts accounted for 89 percent of all poor Black households (as I define them) and those 100 Affluent Black tracts accounted for 79 percent of all affluent Black households in the entire metro area. The 100 poor Black tracts were, on average, 86 percent Black and the 100 affluent Black tracts were, on average, 74 percent Black – levels classified as hyper-segregated.
In 2016, covering the same jurisdictions, there were 1,095 census tracts.[2] The 100 poor Black census tracts accounted for only 49 percent of all poor Black households (as I define them) and the 100 affluent Black census tracts accounted for only 44 percent of all affluent Black households. Thus, over the 35 years there had been a substantial dispersion of both poor Black households and affluent Black households throughout the metro area (as well, of course, of all the income classes between these two extremes).
These trends parallel the metro-wide reduction in the overall Black-White segregation index from 70 in 1980 (and 81 in 1970) to 61 in 2015. Yet by 2016 half of all poor Black households lived in the 100 poor Black census tracts and more than four out of ten affluent Black households lived in the 100 affluent Black census tracts. By contrast with 1980, however, they were almost never the same neighborhoods as the metro-wide economic polarization index with the Black community almost doubled from 25 to 49.
For the entire population metro Washington economic polarization index rose from 36 to 41 during the same period. To what extent was the overall increase driven by greater economic polarization within just the Black community?
That will be the topic for “The Great Sort: Part III.”
David Rusk is a Senior Fellow at the D.C. Policy Center. Rusk is a former federal Labor Department official, New Mexico legislator, and mayor of Albuquerque, the USA’s 32nd largest city. He is also the author of Cities without Suburbs. Now a consultant on urban policy, Rusk has worked in over 130 US communities in 35 states. Abroad, Rusk has lectured on urban problems in Canada, England, Germany, South Africa, and The Netherlands.
Notes
[1] I could not isolate the poorest 10 percent and the most affluent 10 percent within the Black community because of the way that the Census Bureau groups income groups for both its print reports (1980 census) and its online reports (American Community Survey 2016). However, I selected those income groups that came closest to 10 percent: for the 1980 census, Black households with less than $5,000 in household income (“poor Black households”) were 14.2 percent and Black households with more than $35,000 in household income (“affluent Black households”) were 13.4 percent of all Black households. After 35 years of inflation, in 2016, Black households with less than $20,000 in household income (“poor Black households”) were 15.0 percent and more than $150,000 in household income (“affluent Black households”) were 14.6 percent of all Black households.
[2] Many rapidly developing suburban census tracts had been subdivided into multiple tracts. Tract 8035 in Prince George’s County, for example, which was subdivided into three sub-units for the 1970 census, was six sub-units for the 1980 census and 15 sub-units by 2016.