

This publication is adopted from 2023 State of Business Report: Doing Business Under Fiscal Distress. This report was prepared for the DC Chamber of Commerce, with support received from the Office of the Deputy Mayor for Planning and Economic Development. Access the full, print-friendly PDF report, including a foreword from the Chamber of Commerce President & CEO, and the Chamber’s policy agenda, here.
Other reports in this series:
- 2022 State of Business Report: Doing Business Under the New Normal
- 2021 State of Business Report: Building Back
- 2020 State of Business Report: Pivoting from Pandemic to Recovery
- 2019 State of Business Report: Building a Competitive City
- 2018 State of Business Report: Towards a More Inclusive Economy
- 2017 State of Business in the District of Columbia: Twenty years of change since the Revitalization Act
Executive summary
The past three years have been turbulent for many businesses in the District of Columbia. The pandemic shifted regional labor dynamics and economic activity away from urban job centers, in turn weakening the District’s economic competitive position.
As people spend less time in the city and more time in the region’s suburbs and exurbs, businesses in D.C. that once served office workers five days a week must now operate under a new normal with fewer customers, especially during the workday. Some businesses have been able to adapt to these conditions by moving part of their commercial activity online or opening only on nights and weekends, while others have been forced to cut staff, move their location, or close entirely.
The immediate availability of federal support for businesses and residents, and the infusion of significant federal fiscal aid into the District’s coffers, have allowed the city to remain stable and even grow its budget. However, the path of recovery the District experienced in 2022 suggests that the city must reassess its fiscal future and adopt policies that can support its future growth. When federal fiscal aid expires in 2024, the District will face a fiscal cliff, and city leaders will have less money to pay for competing priorities. Consequently, there is limited time to adopt policies that support the District’s businesses and bring vibrancy back to downtown.
This year’s State of Business Report assesses how economic activity has shifted over the past year, how this shift has impacted business performance and labor market recovery, and what businesses need to recover in this new environment of fiscal distress.
Remote work patterns are settling
Nearly four years after the onset of the COVID-19 pandemic, office-based workers continue to work from home at least two to three days per week.
As a result, foot traffic downtown and in other office-heavy neighborhoods has declined. Through 2022, remote work patterns had stabilized across the Washington metropolitan area, at just under half pre-pandemic levels of office occupancy. Nearly 6 in 10 business establishments report that their workers are either fully remote or hybrid, and almost all these establishments foresee no significant changes in work schedules.
The region’s level of remote work is not unusual for large employment centers around the country, but it is more than twice the national average for business establishments in the United States.
The continued prevalence of remote work has had spillover effects, which also pose risks for the District’s fiscal future. The District’s population grew in 2022 for the first time since the beginning of the pandemic, but this growth has not made up for the population lost during the first two years of the pandemic. The growth has been fueled by births and international migration, rather than by domestic in-migration.
In the past, much of the population growth in D.C. was driven by job activity, but due to the popularity of remote work, that relationship between job growth and population growth has weakened. This puts income tax revenue at risk. Similarly, the prevalence of remote work has translated into higher office vacancy rates in downtown D.C., putting significant negative pressure on office valuations and commercial property tax revenue. Additionally, higher interest rates are limiting D.C. businesses’ ability to invest in capital to grow, which jeopardizes corporate income tax revenue.
Entrepreneurial activity remains strong
Despite the challenges facing the business community, D.C. continues to attract entrepreneurs and new businesses. Since the third quarter of 2020, new business applications have been high in D.C. In 2022, although new business applications were still higher than before the pandemic—up 16 percent compared to 2019—new applications slowed down compared to earlier in the pandemic.
Even still, on net, D.C. has more businesses opening than closing, resulting in new jobs and additional city revenues. But businesses are finding it harder to reach scale. While there are more establishments, employment is still below pre-pandemic levels, resulting in fewer workers employed by each establishment.
Through 2022, D.C.’s business expectations improved with a larger share of D.C. businesses reporting that they are content with their performance. The majority of them do not expect a big shift in the demand for their services. Issues that were significant concerns in the summer of 2022, especially for small businesses—including finding workers, adapting to digital technologies, and inflationary pressures—have dissipated somewhat. It is possible that businesses have adapted to the difficult conditions. It is also possible that these improvements reflect some type of filtering out as weaker establishments close and others move to locations outside of the city.
Federal and local support for businesses is coming to an end
The strength in business activity is due in part to the significant support businesses received from both the federal and District governments. The beginning of the pandemic was tremendously difficult for businesses. Demand dried up immediately with no certainty about the length of closures. At that time, many small businesses had limited cash in hand and were at risk of bankruptcy.
The first wave of support came in the form of forgivable Paycheck Protection Program (PPP) loans. In the District, 23,455 different business establishments received approval for a PPP loan through the program’s first two tranches in 2020 and 2021, collectively receiving $1.8 billion in federal fiscal support. In addition, 14,561 business establishments applied for a low-interest Economic Injury Disaster Loan (EIDL) through the U.S. Small Business Administration and qualified for a one-time advance of anywhere between $1,000 to $10,000 that did not have to be repaid. These advances received by D.C. business establishments totaled over $87 million in 2020 and 2021. Among establishments that applied for an EIDL, 7,367 were approved, collectively receiving $1.3 billion in low-interest loans that allowed them to defer payments for 30 months.
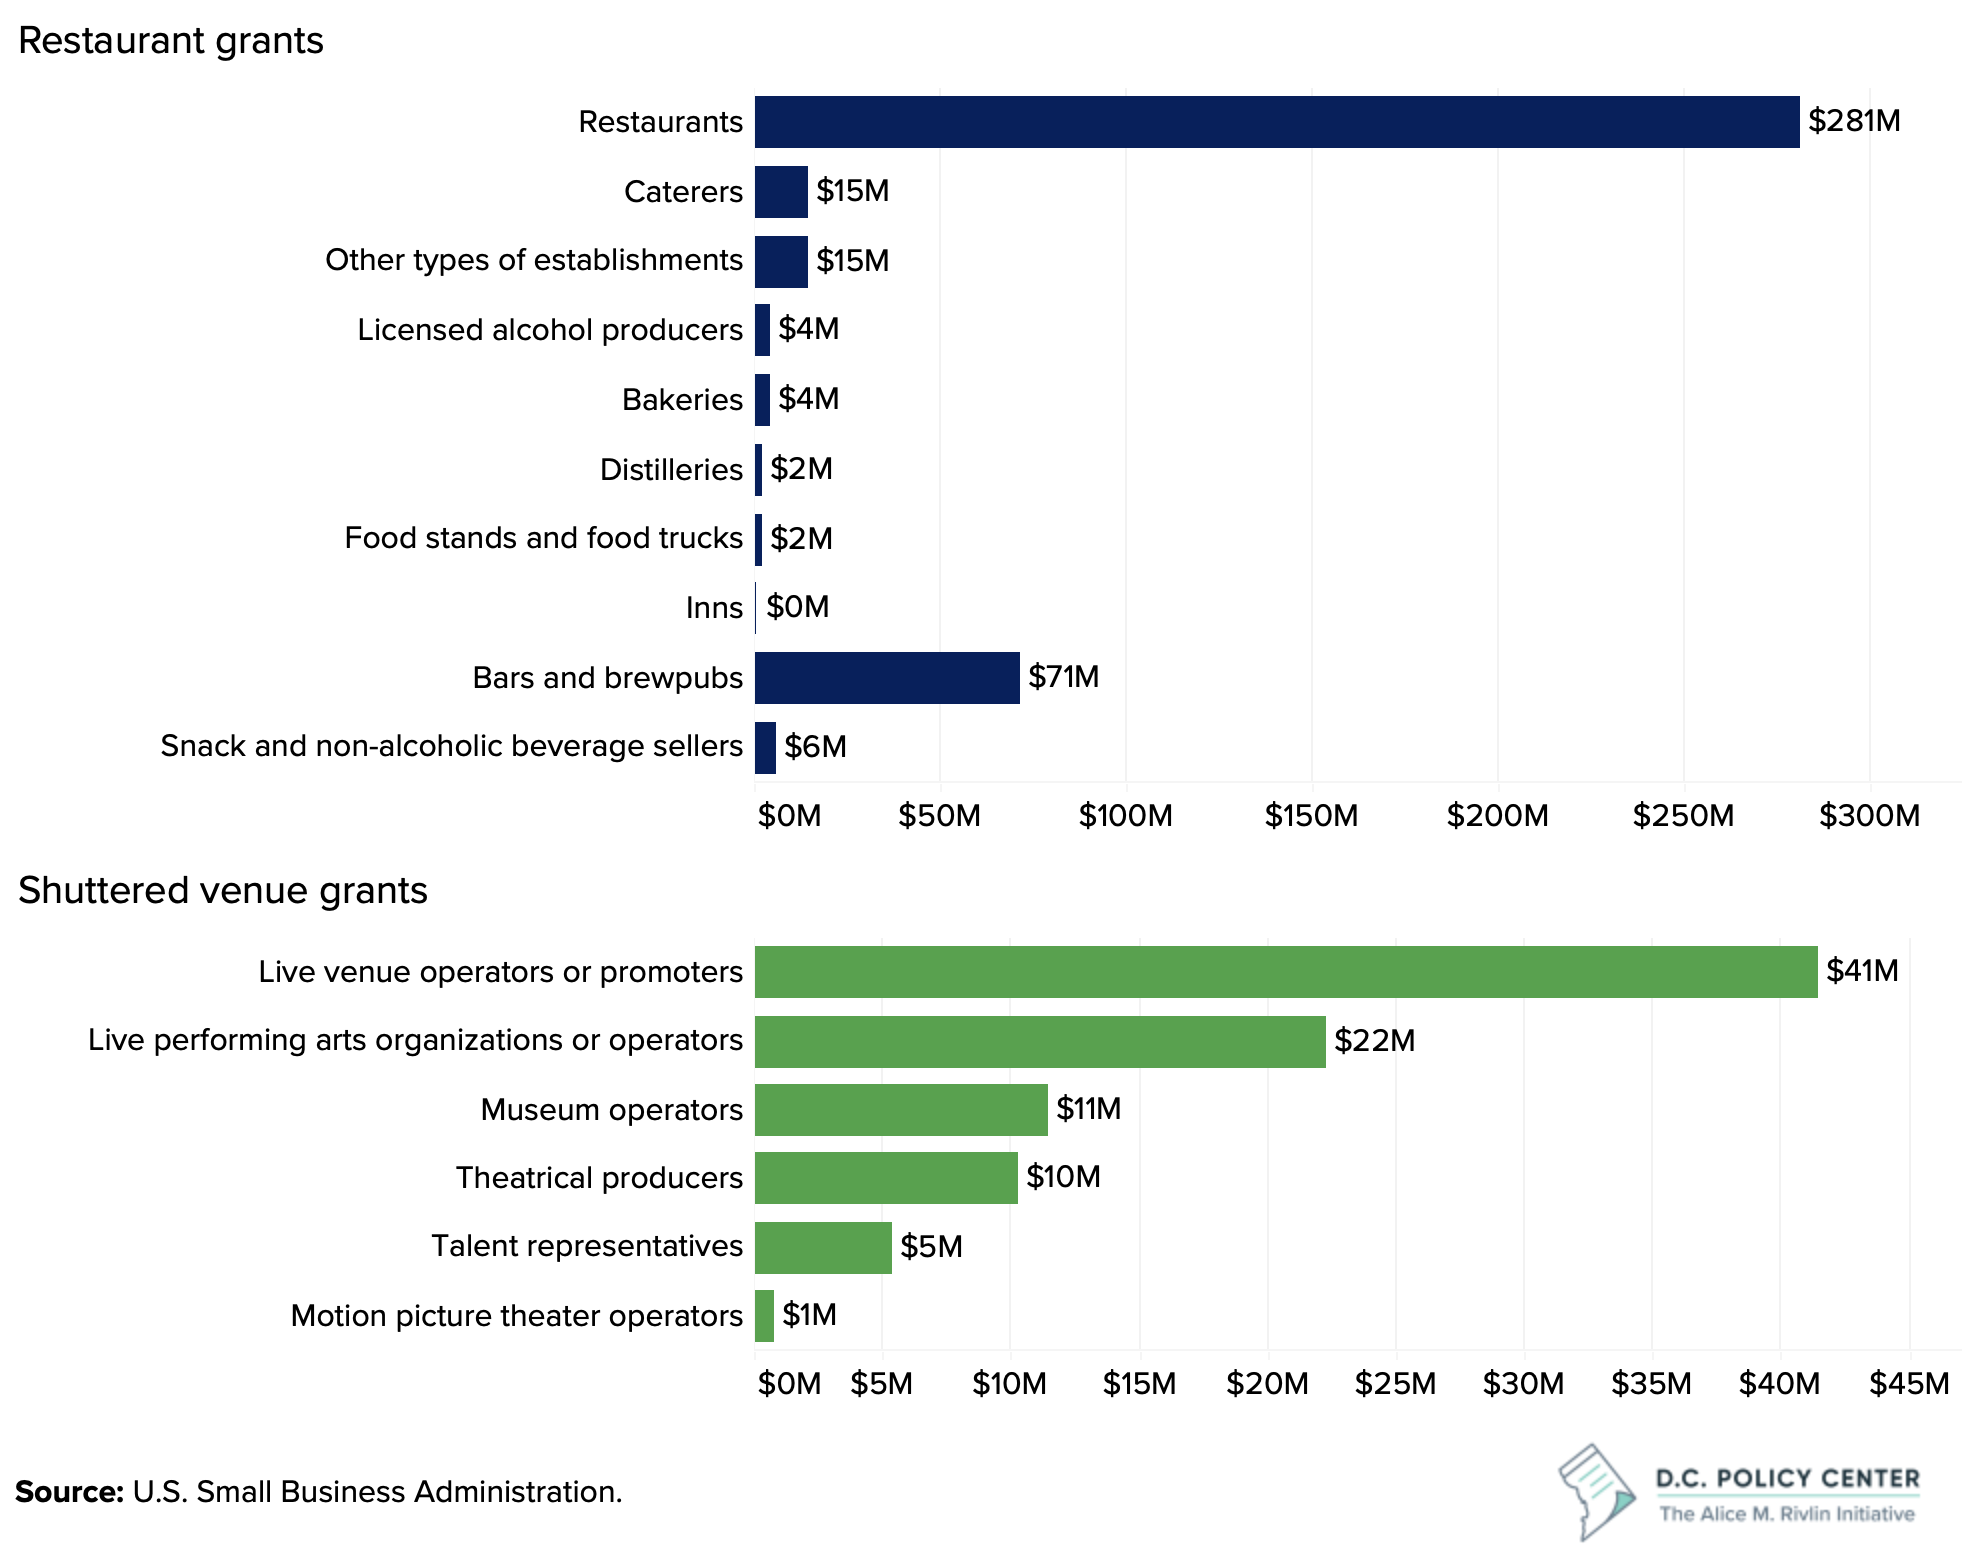
The federal government also supported 705 D.C. restaurants with $400 million in grants approved under the American Rescue Plan Act in 2021, and 78 arts and entertainment establishments with $92 million in grants that were targeting “shuttered venues” and approved under the Response and Relief Act.
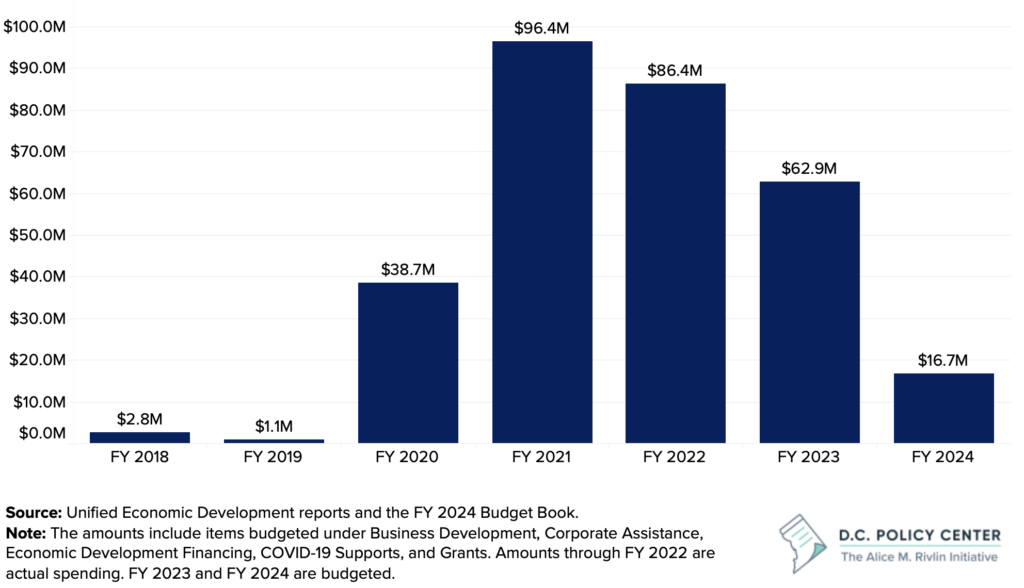
The District government also supported small businesses with expanded grants. The Office of the Deputy Mayor for Planning and Economic Development (DMPED) provided various direct and indirect grants to businesses that totaled $2.8 million in fiscal year 2018 and $1.1 million in fiscal year 2019. In 2020, this amount increased to $38.6 million; in fiscal year 2021, it was $96.4 million; and in fiscal year 2022, it was $86 million. The funding for these grants in fiscal year 2023 is $62.8 million, but this amount has declined to $16.7 million in the approved fiscal year 2024 budget.
Since the beginning of the pandemic, the District government has received $4.9 billion in direct federal fiscal aid, which has helped the city maintain and grow its budget, even amid declining revenues. These supports are now coming to an end, making for a difficult fiscal future that includes fewer resources for monetary or tax incentives for business attraction and retention.
To advance much-needed economic growth, the District government should focus on improving the business climate
In the coming years, D.C.’s businesses will have to operate in a changing economy where economic activity will be increasingly separated from jobs. Consequently, the District government will need to put renewed effort into boosting demand and retaining existing businesses. One way to do this is to focus on improving the business climate by eliminating burdensome regulations and processes to make it easier to start and grow a business in D.C. This creates a friendlier business environment and will set the District’s businesses up for success. Alongside those efforts, it will also be important to support a diverse and mixed-use community and downtown D.C. and to ensure D.C. remains an attractive place to live.
Chapter 1: Economic activity and business performance
Remote work trends continue to impact D.C.’s economy, fiscal picture, and competitive position in the Washington metropolitan region. While there is still some uncertainty about the future of central cities, we know that the pandemic has changed the way people interact with cities.
For more than two years now, vaccines have been widely available and public health restrictions have been lifted. Yet, people continue to work from home.
Remote work
The persistence and continued popularity of remote work implies the trend is here to stay. For many workers, it is beneficial to have a flexible schedule, and to save time and money by not commuting every day.1 Moving forward, many office workers will likely continue with their current hybrid schedules, working onsite two to three days per week and from home for the remaining days of the work week.
Survey data show that nationally, of those workers who are able to work from home, 46.5 percent have a hybrid working arrangement, 34.9 percent are fully on-site, and 18.6 percent work from home full-time. But working from home is most common in major cities such as D.C. In the 10 largest cities by population, approximately 35 percent of paid full days were worked remotely.
Figure 1. Average office occupancy by month
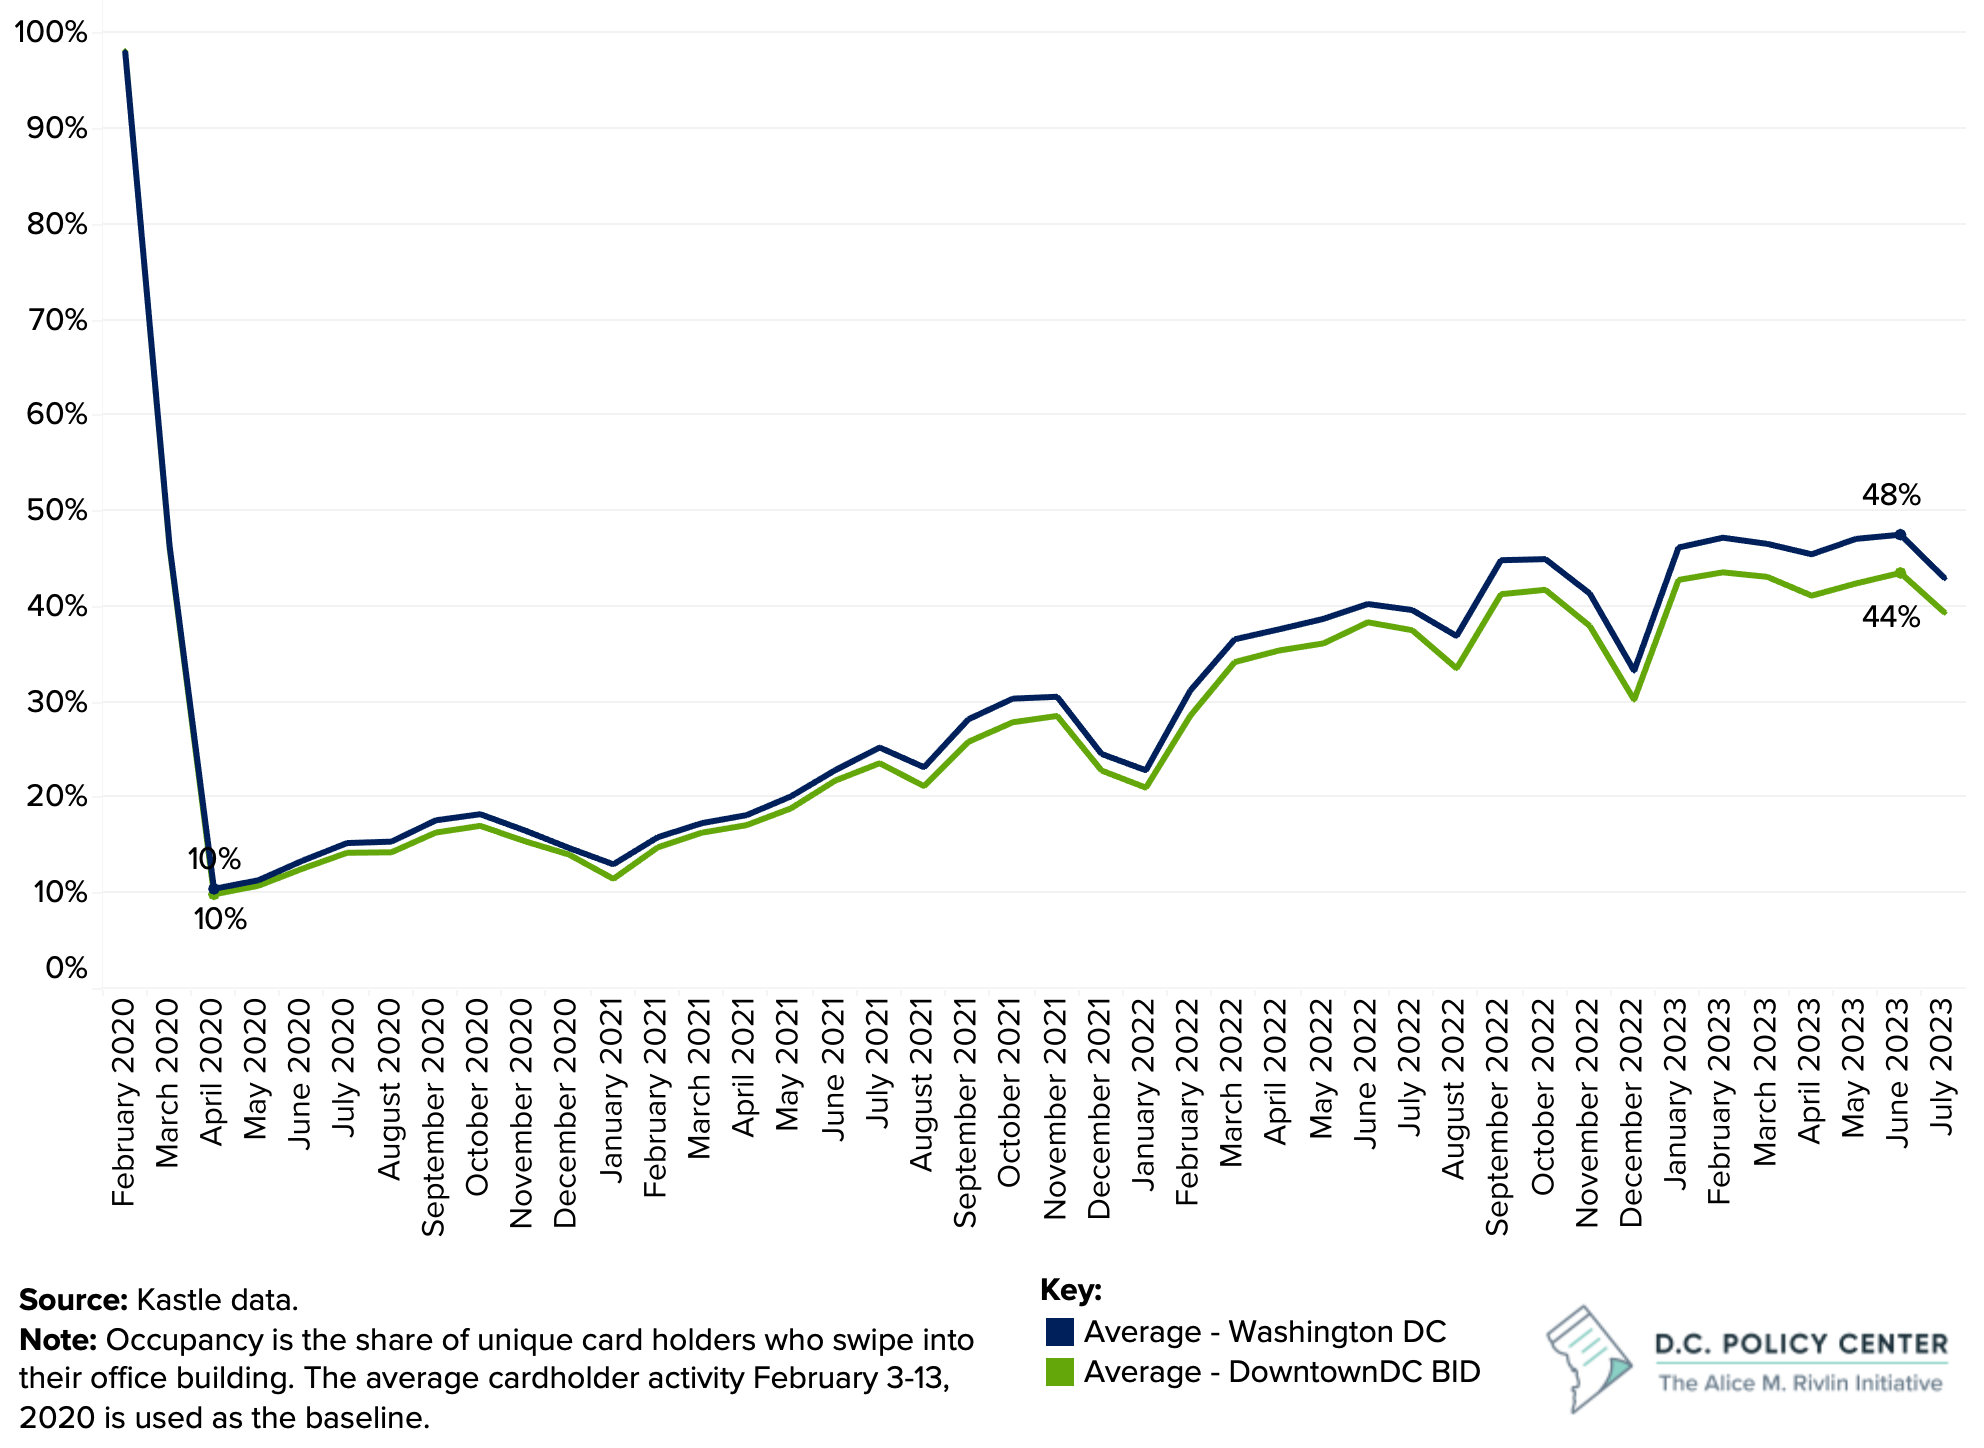
Local data confirm this. As of June 2023, an average of 48 percent of office workers commuted to workplaces in the District of Columbia. This share drops to 43 percent when focused on just downtown.2 And remote work has impacted the entire Washington metropolitan area. In 2020 and 2021, office occupancy rates were 5 to 7 percentage points higher in Northern Virginia and the Maryland suburbs than in D.C. Occupancy rates across the region have now converged at slightly under 50 percent even on best days, thus the local economy around office buildings has lost half its demand. At the same time, as leases expire, many businesses are reducing their office footprints and moving closer to their employees. [See Figure 1.] The D.C. region is not alone. Workers in other large metropolitan areas are also working from home.
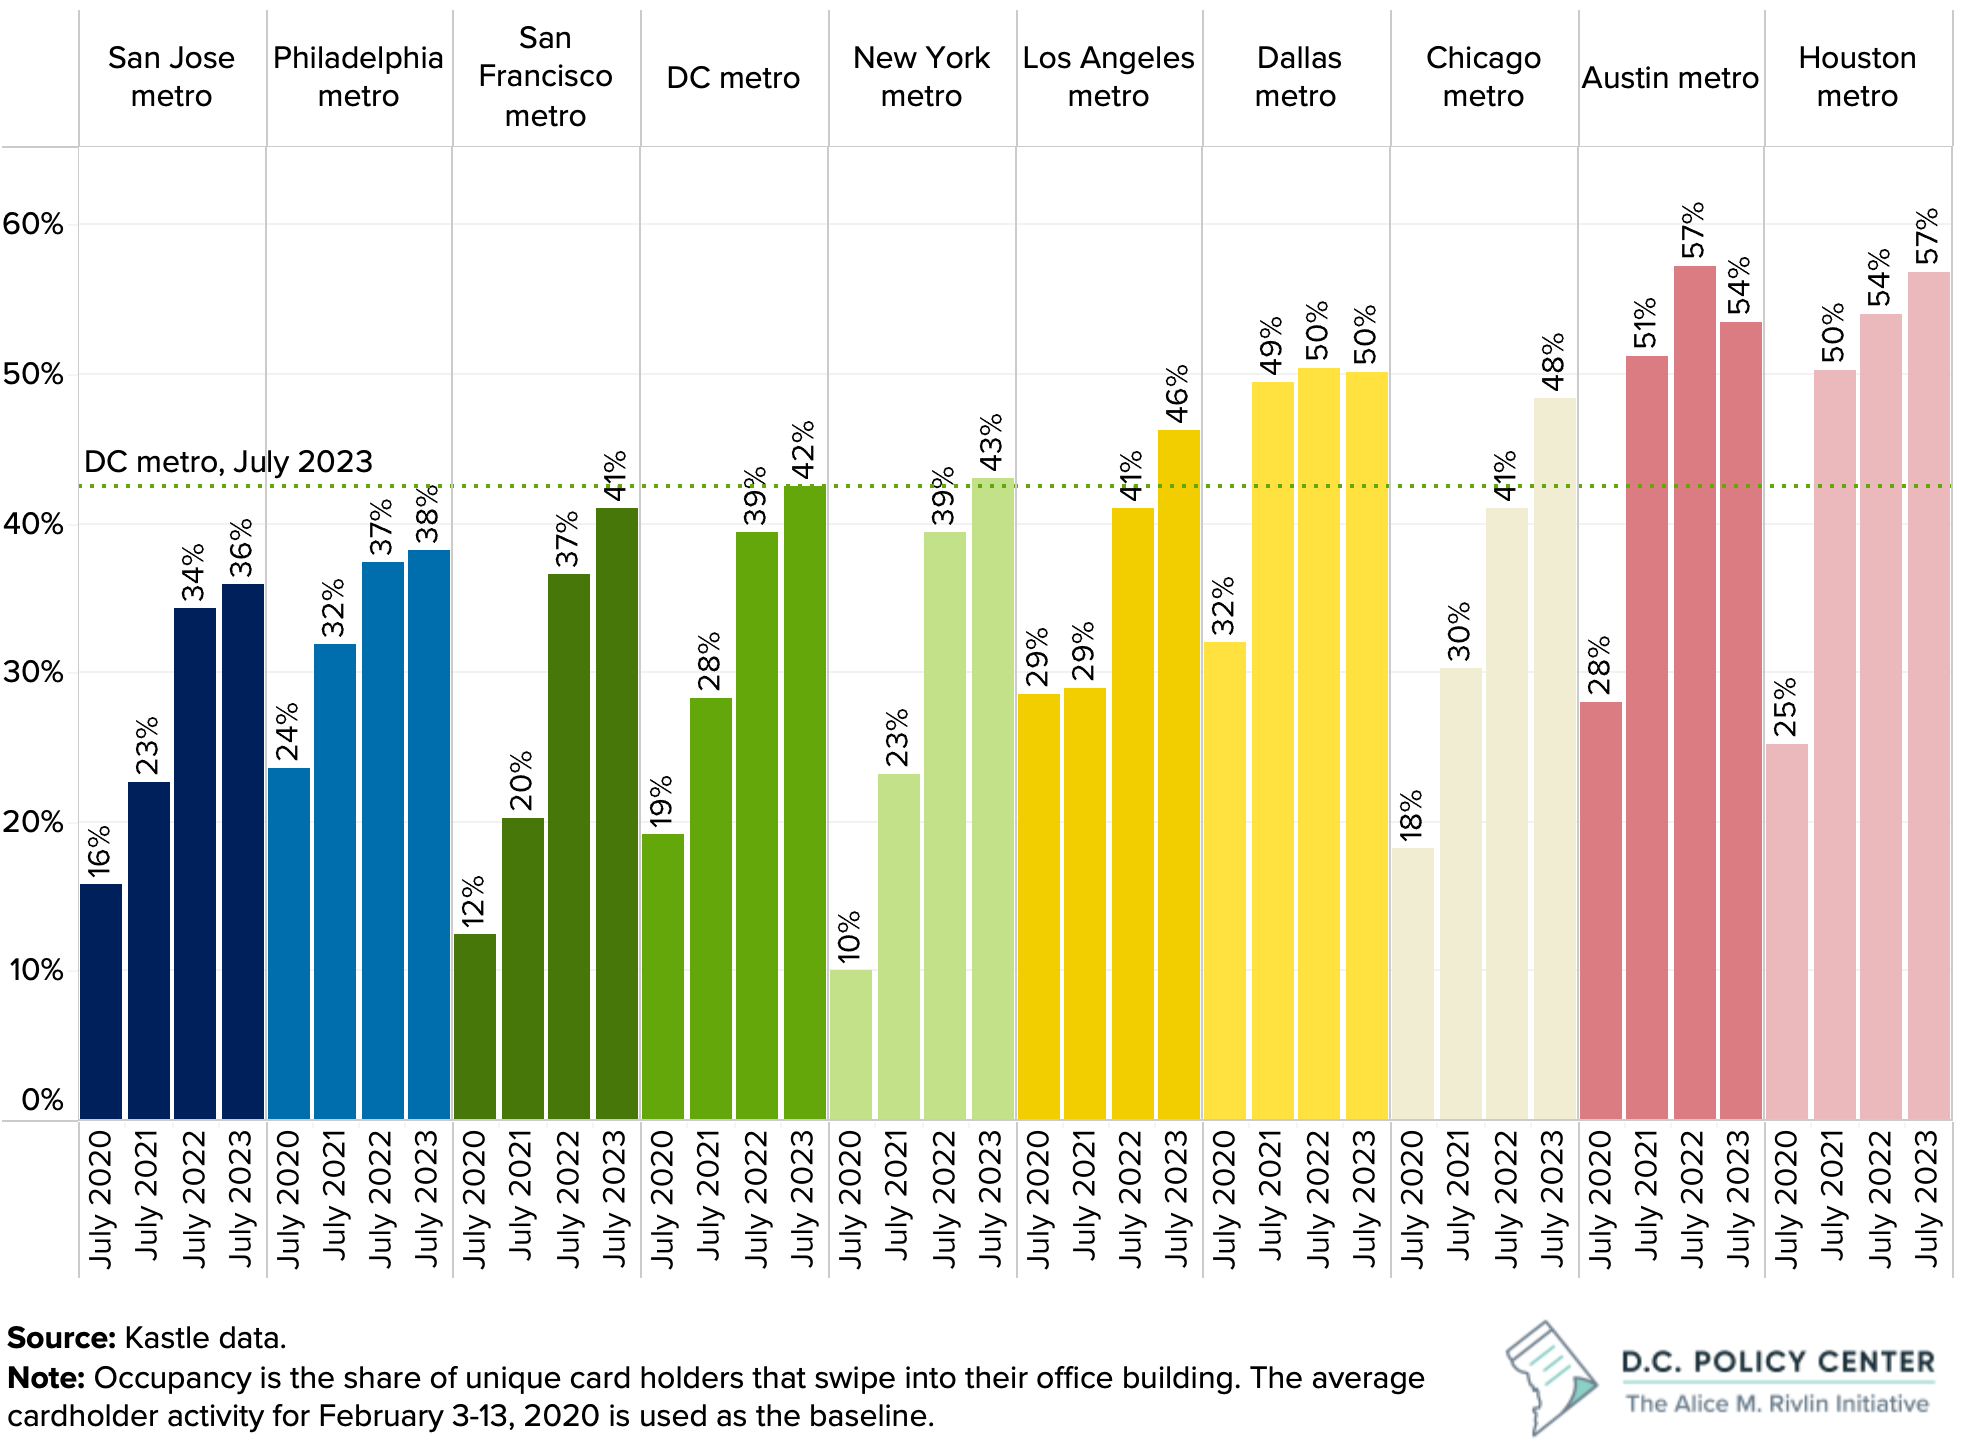
Even so, D.C. has one of the lowest office occupancy rates among these peers. [See Figure 2.] Only the San Jose, Philadelphia, and San Francisco metropolitan areas have lower occupancy rates than the Washington metropolitan area, based on Kastle data.3 This is likely due to D.C.’s highly educated workforce, which is more likely to work remotely, and the city’s relatively large share of office-based jobs.4
Figure 2. Office occupancy in the top 10 metropolitan areas
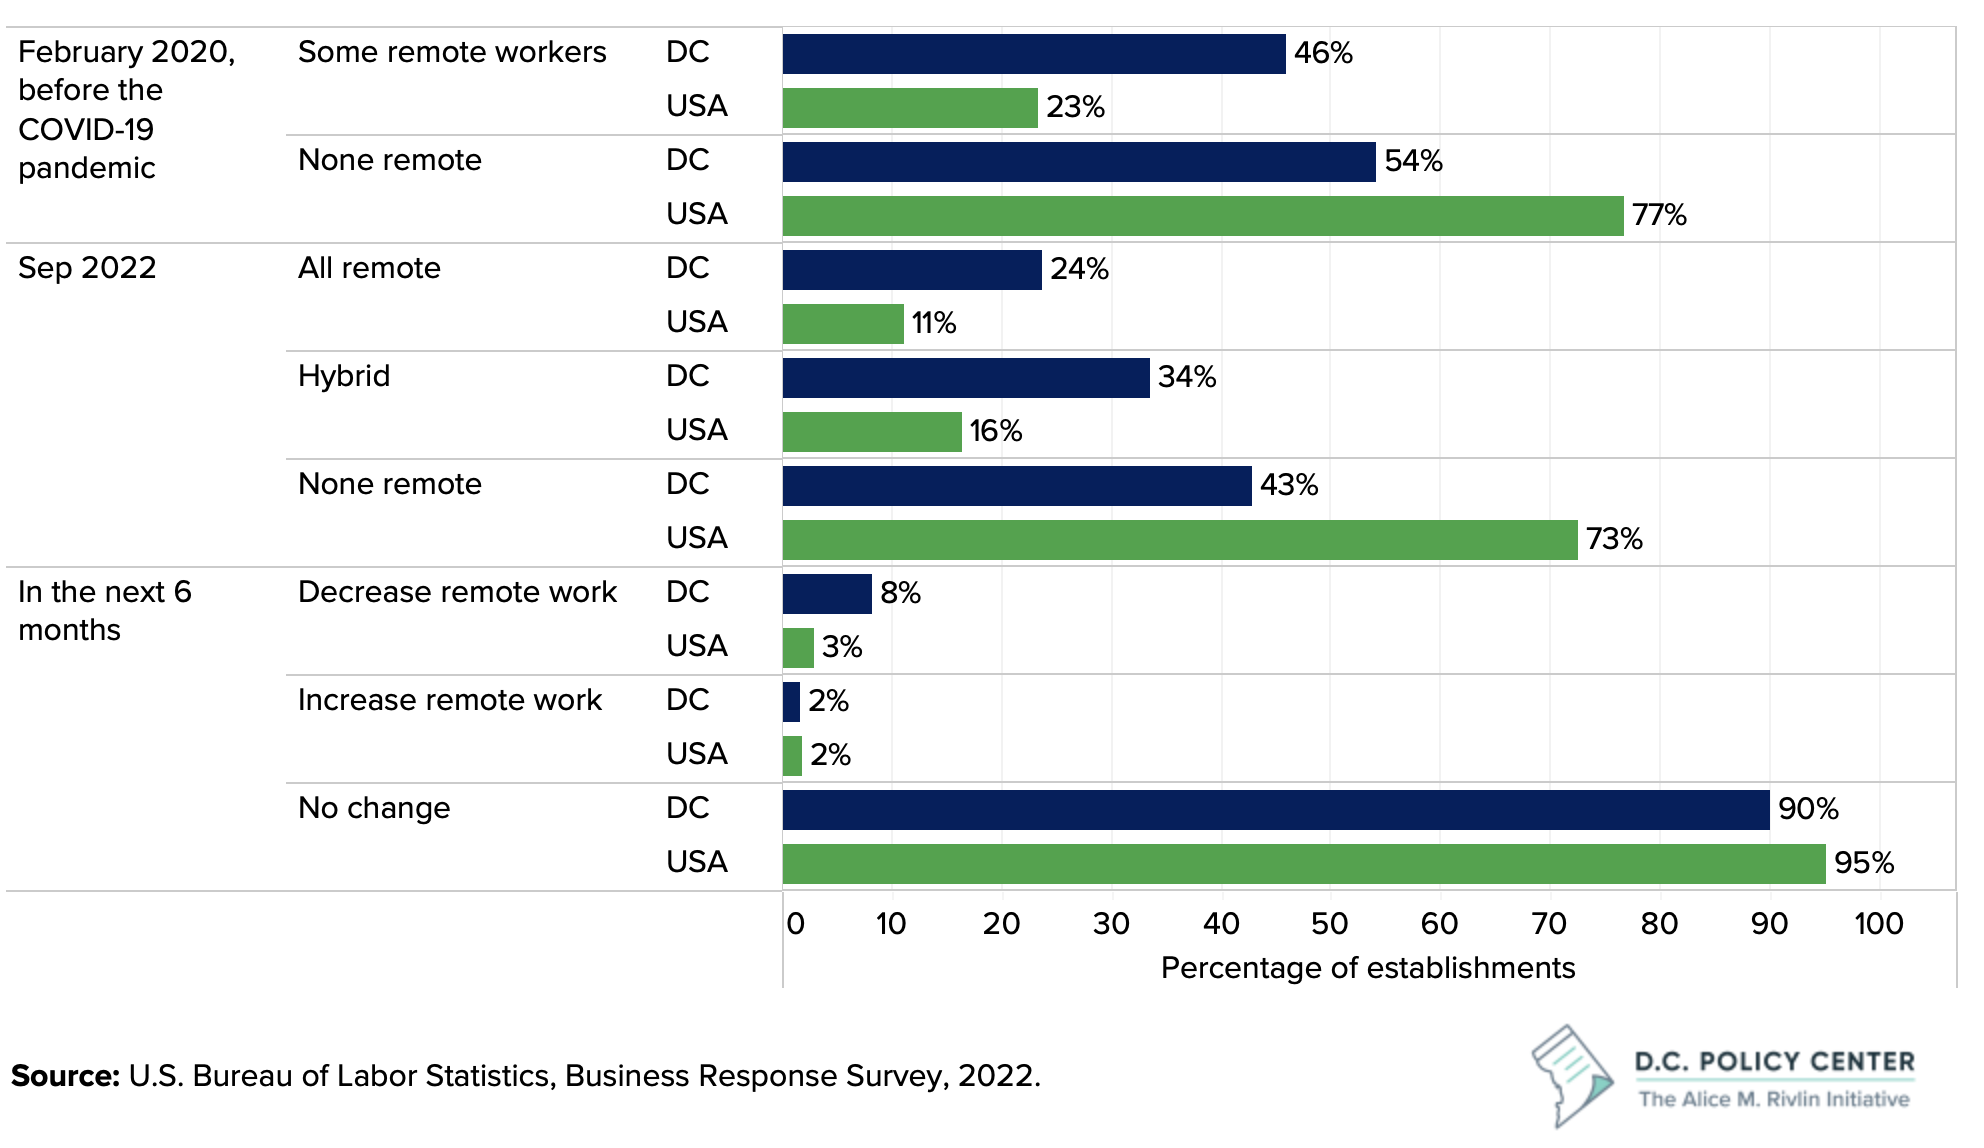
Before the pandemic, a larger share of D.C. business establishments reported some workers working remotely than did establishments elsewhere. [See Figure 3.] In D.C., 46 percent of the business establishments reported that they had some remote workers prior to the pandemic, compared to half that share across the entire country. In 2022, 58 percent of D.C.’s business establishments reported having some remote workers, compared to 27 percent across the country. Now, these trends have somewhat settled. In D.C., 90 percent of establishments report that they don’t expect to change their remote work patterns.
Figure 3. Remote work trends reported by business establishments
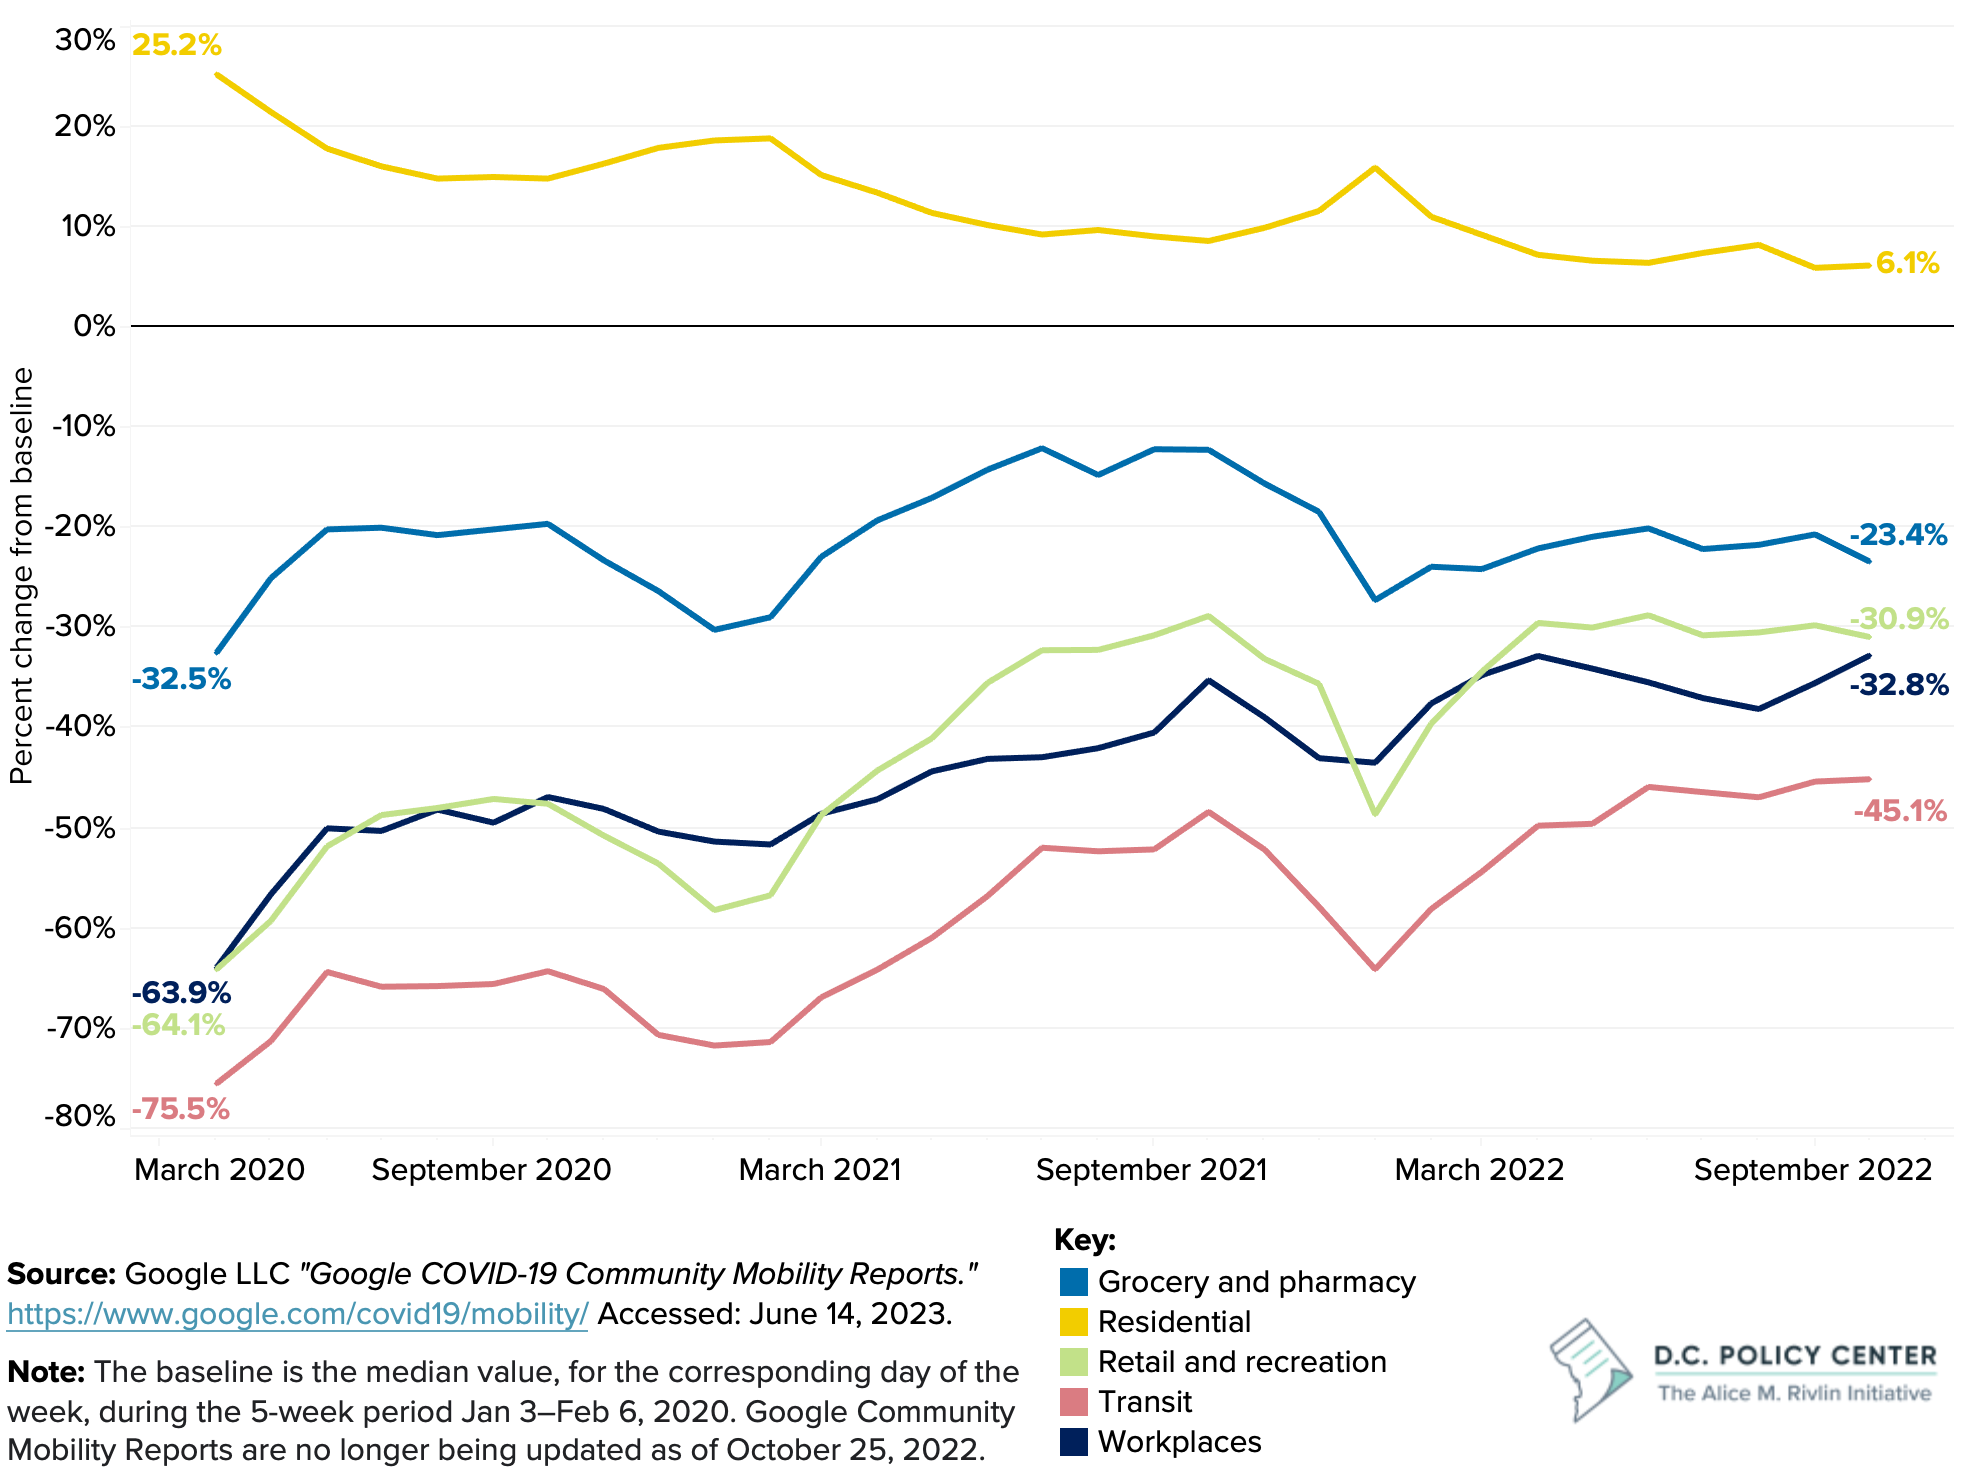
Accordingly, where people are spending their time has shifted dramatically after the pandemic, settling into a new pattern since approximately April 2022. [See Figure 4.] People in D.C. have cut their time at their workplaces by nearly a third, and their time using public transportation is down by about half. As online shopping and delivery options have expanded, time spent at grocery stores, pharmacies, and retail establishments has also declined by about 25 percent.5
These shifts have significant impacts on many businesses, particularly those that primarily serve office workers in D.C.’s downtown, including restaurants, small shops, and personal services establishments located in downtown areas. Whereas pre-pandemic, these businesses were accustomed to high foot traffic during the work week, now, these businesses see about half that activity. To survive under this new normal, many businesses have changed their services, service hours, and hiring practices to adjust to these new patterns.
Figure 4. Mobility trends in the District of Columbia (April 2020 to October 2022)
Job activity
While D.C. is administratively distinct from the rest of the metropolitan area, it draws from the region’s workforce. Within the region, shifts in activity are not working in D.C.’s favor. [See Figure 5.] In 2019, an estimated 70 percent of the District’s workers lived outside the city, and the city’s jobs attracted commuters from across the entire metropolitan area (or even beyond).6 Now, these workers are no longer commuting to D.C. five days a week, shifting their jobs and economic activity out of the District.
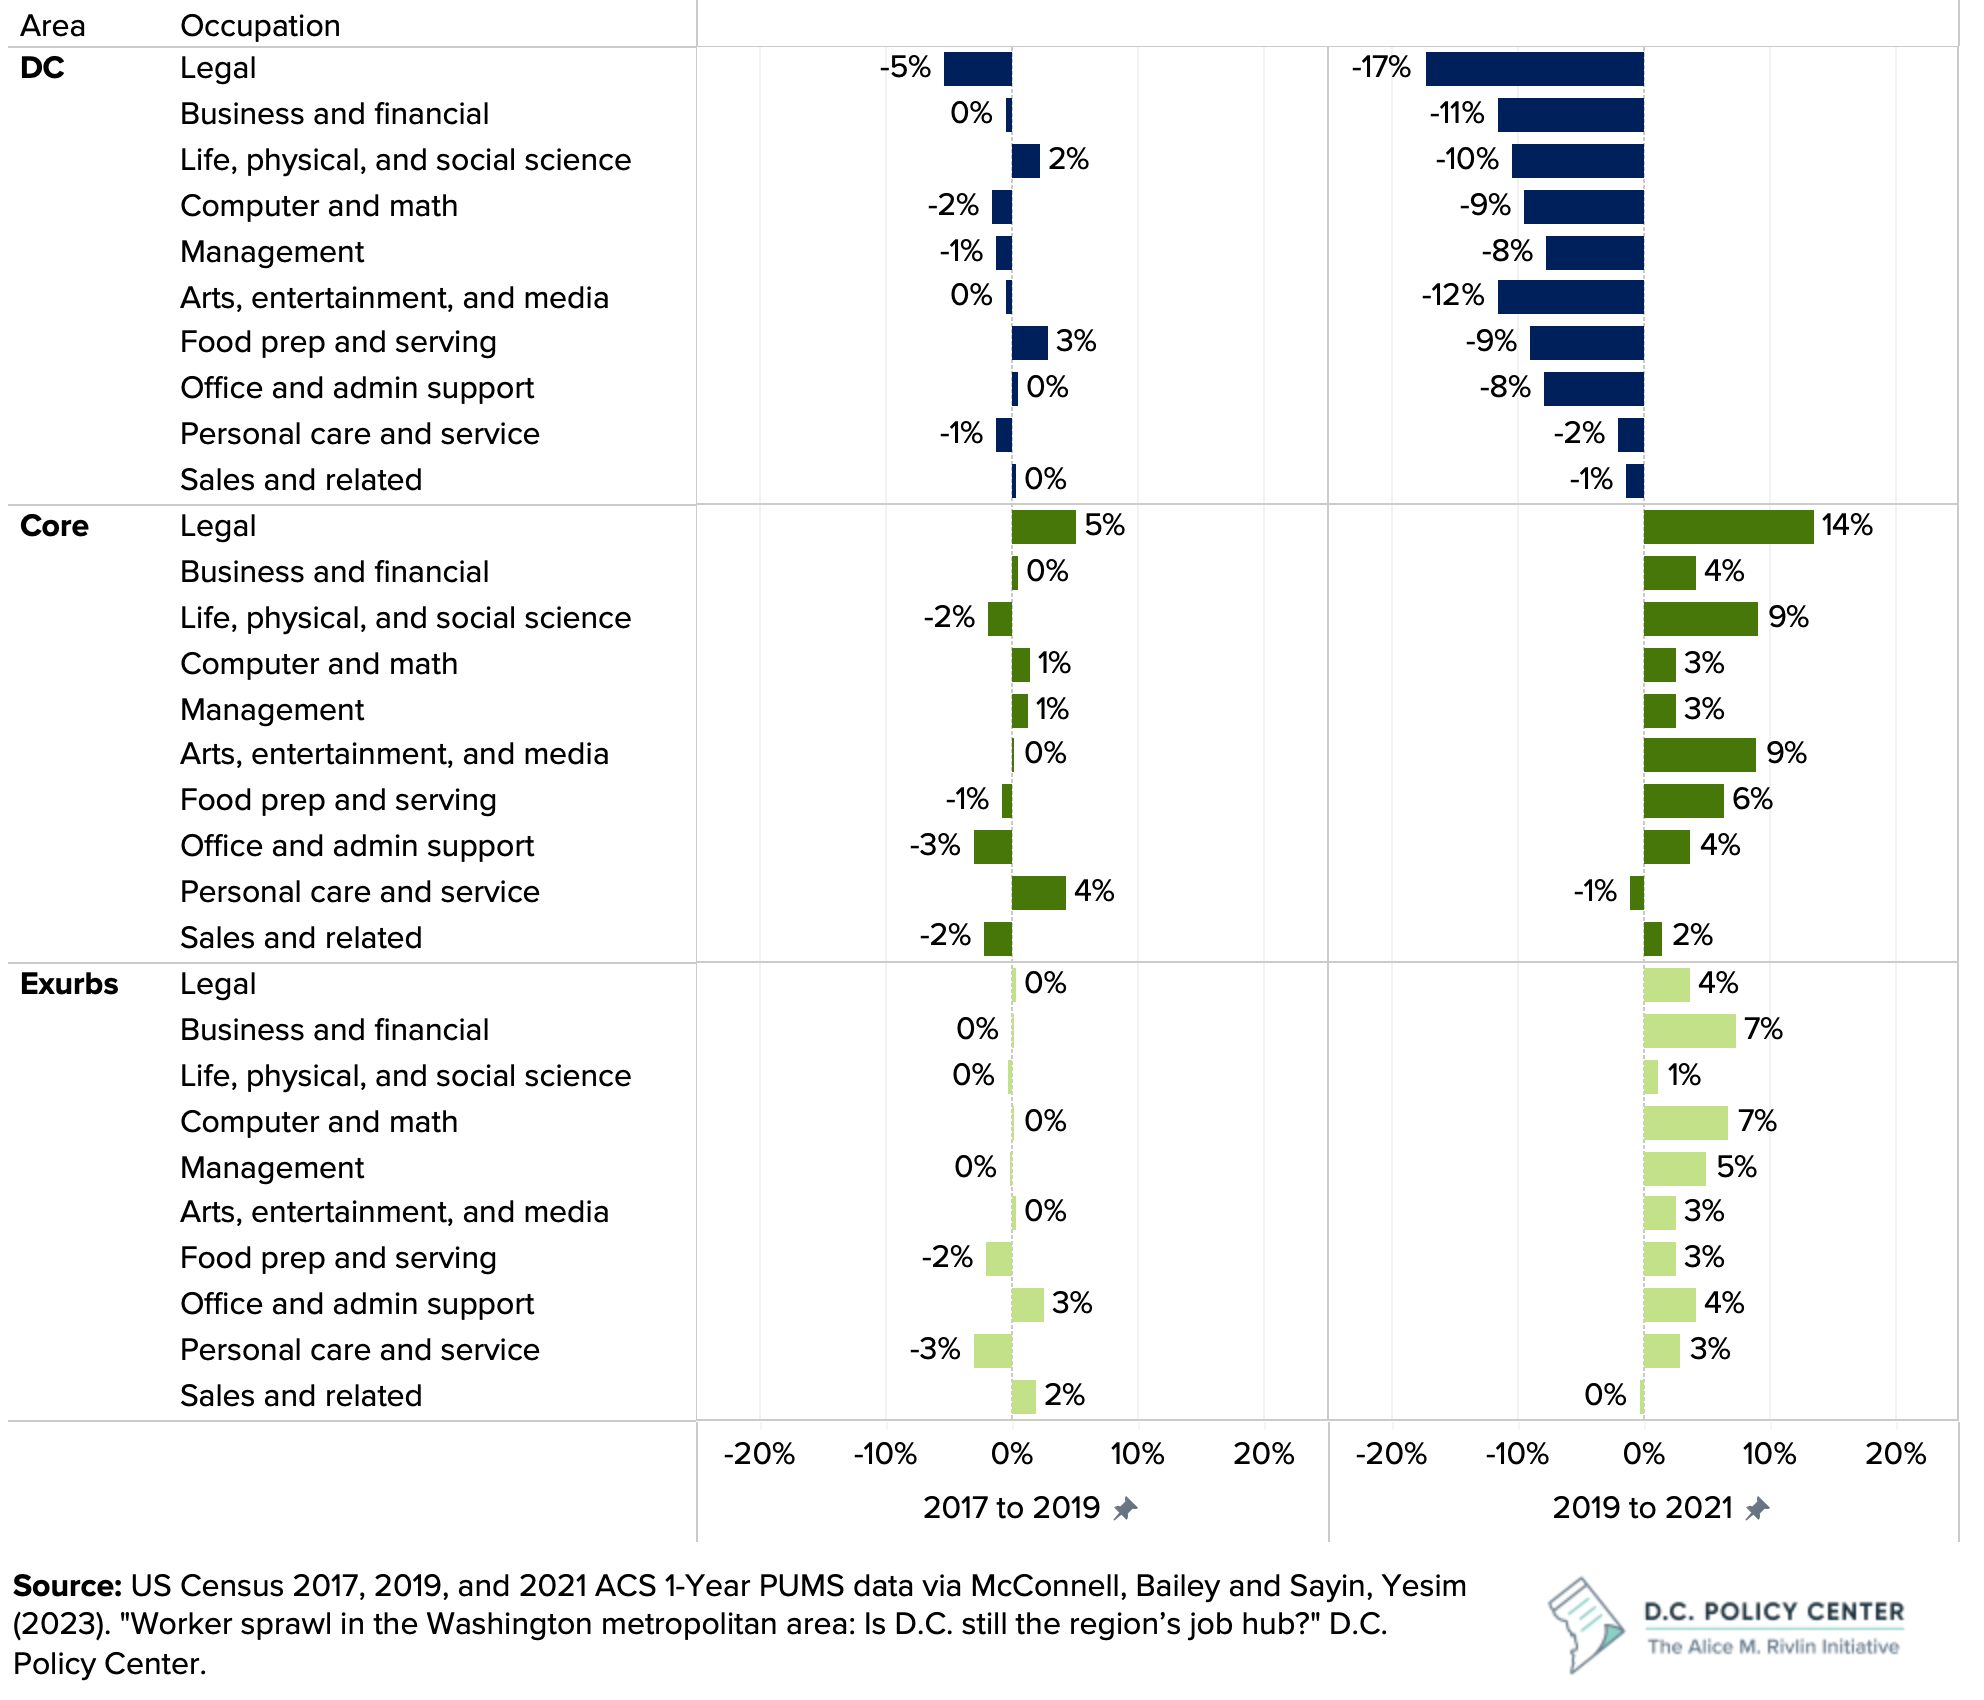
Tracking job activity—a measure of where workers are actually working—we learn that D.C. is at risk of losing its share of regional economic growth.7 In some of the region’s key occupation groups, especially those where people can work remotely, job activity is shifting from the city to the D.C.’s suburbs and exurbs. Regular employment data, which report employees by the location of their employers, do not capture these dramatic shifts across the region. But the job activity measure shows that the District is losing its competitiveness, oftentimes to the exurbs. Between 2017 and 2019, the District’s share of regional employment held steady, and generally grew at the same rate as the rest of the region. Between 2019 and 2021, the District’s share in the region’s key occupational groups declined significantly. For example, the District’s regional share in business and financial occupations declined by 11.5 percent. Most of this loss was captured by the exurbs, which saw their share of business and financial occupations increase by 7.3 percent.
Figure 5. Change in regional share of job activity, 2017 to 2019, and 2019 to 2021
The decline in job activity is not limited to remote-eligible jobs—even service sector jobs are shifting away from the city. Researchers have found that local service workers depend on the local spending of workers in office-based jobs. As such, employment centers such as D.C. face two threats:
- The loss of increasingly mobile high-skill workers, and
- The loss of local service workers.8
These trends are becoming more pronounced in D.C. The District’s share of regional job activity in the food preparation and serving occupation group (for example, chefs, line cooks, and wait staff) dropped from 21 percent in 2019 to 12 percent in 2021, and D.C.’s share of regional arts and entertainment job activity dropped from 39 percent to 28 percent.9 This is because service sector businesses are following where people are, and as the region’s workforce spends more time at their homes, in suburban and exurban locations, many small businesses are moving their operations closer to where people live as opposed to where people work. These decisions tend to be long-term, creating more permanence in the current economic activity patterns across the region.
The office market
The shift in economic and job activity has spillover effects across the economy, including on the performance of the city’s office market, which is impacted by where businesses choose to set up shop and how much space they choose to occupy. Office vacancy rates continue to rise across D.C.
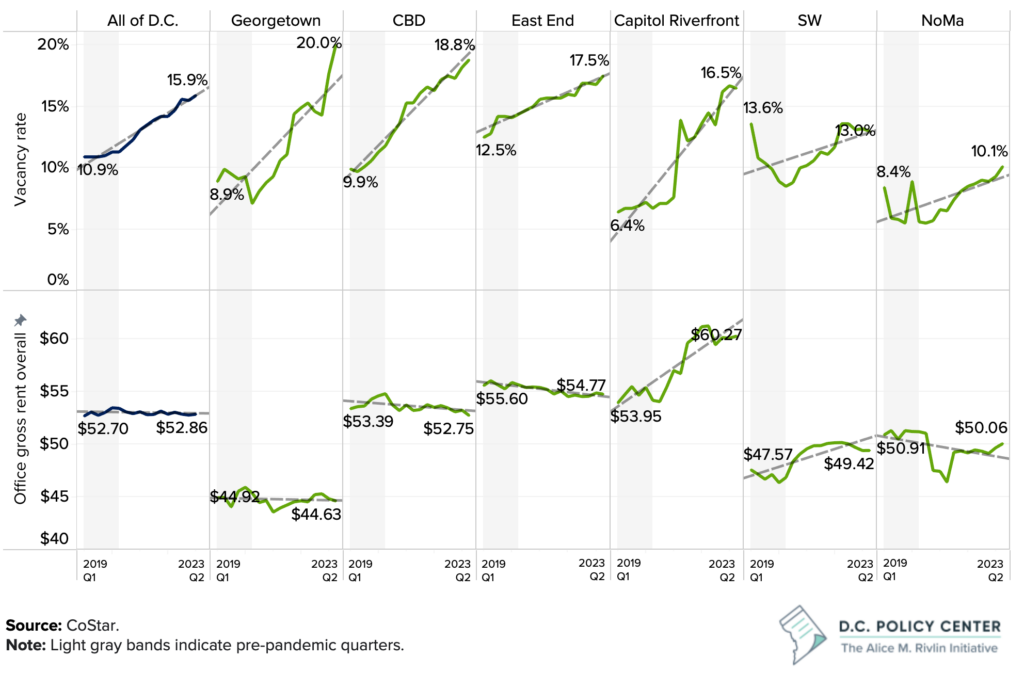
Georgetown, the Central Business District, and the East End have particularly high office vacancy rates of 20 percent, 18.8 percent, and 17.5 percent, respectively. [See Figure 6.] Much of the city’s negative net absorption is in these three areas, and office vacancies are rising despite relatively stagnant rent. This indicates that there are more leases moving out than moving in, with this increasing lack of demand putting downward pressure on asset values. For example, according to CoStar data, since the end of 2019, the District’s office inventory increased by 2.6 million square feet (1.6 percent). At the same time, the total value of office buildings declined by $6.1 billion (6.6 percent). This is the equivalent of nearly a $120 million loss in tax revenue.
Moreover, a paucity of office building sales is making it difficult to truly understand the impact of the pandemic on D.C.’s commercial office market values. In the first half of 2023, sales volume was 71 percent lower than 2019 and prices, on a square foot basis, were 9 percent lower in the Central Business District and 6 percent lower across the city.10 Research from other markets suggests that values could be dropping more. Last year, researchers from Columbia and NYU published findings that commercial buildings in NYC will likely experience a 44 percent long-term decline in value because of the pandemic and remote work.11 Values are projected to decline an additional 30 percent (on top of losses already experienced) in Seattle and San Francisco.12 A recent report on commercial office buildings in D.C. shows that the sale price per square foot now stands at $314, approximately half of what it was at the peak.13 The type of sales reflected in this price, however, are almost entirely for conversion purposes.
Figure 6. Office vacancy rate and rent trends in select submarkets (2019 Q1 to 2023 Q1)
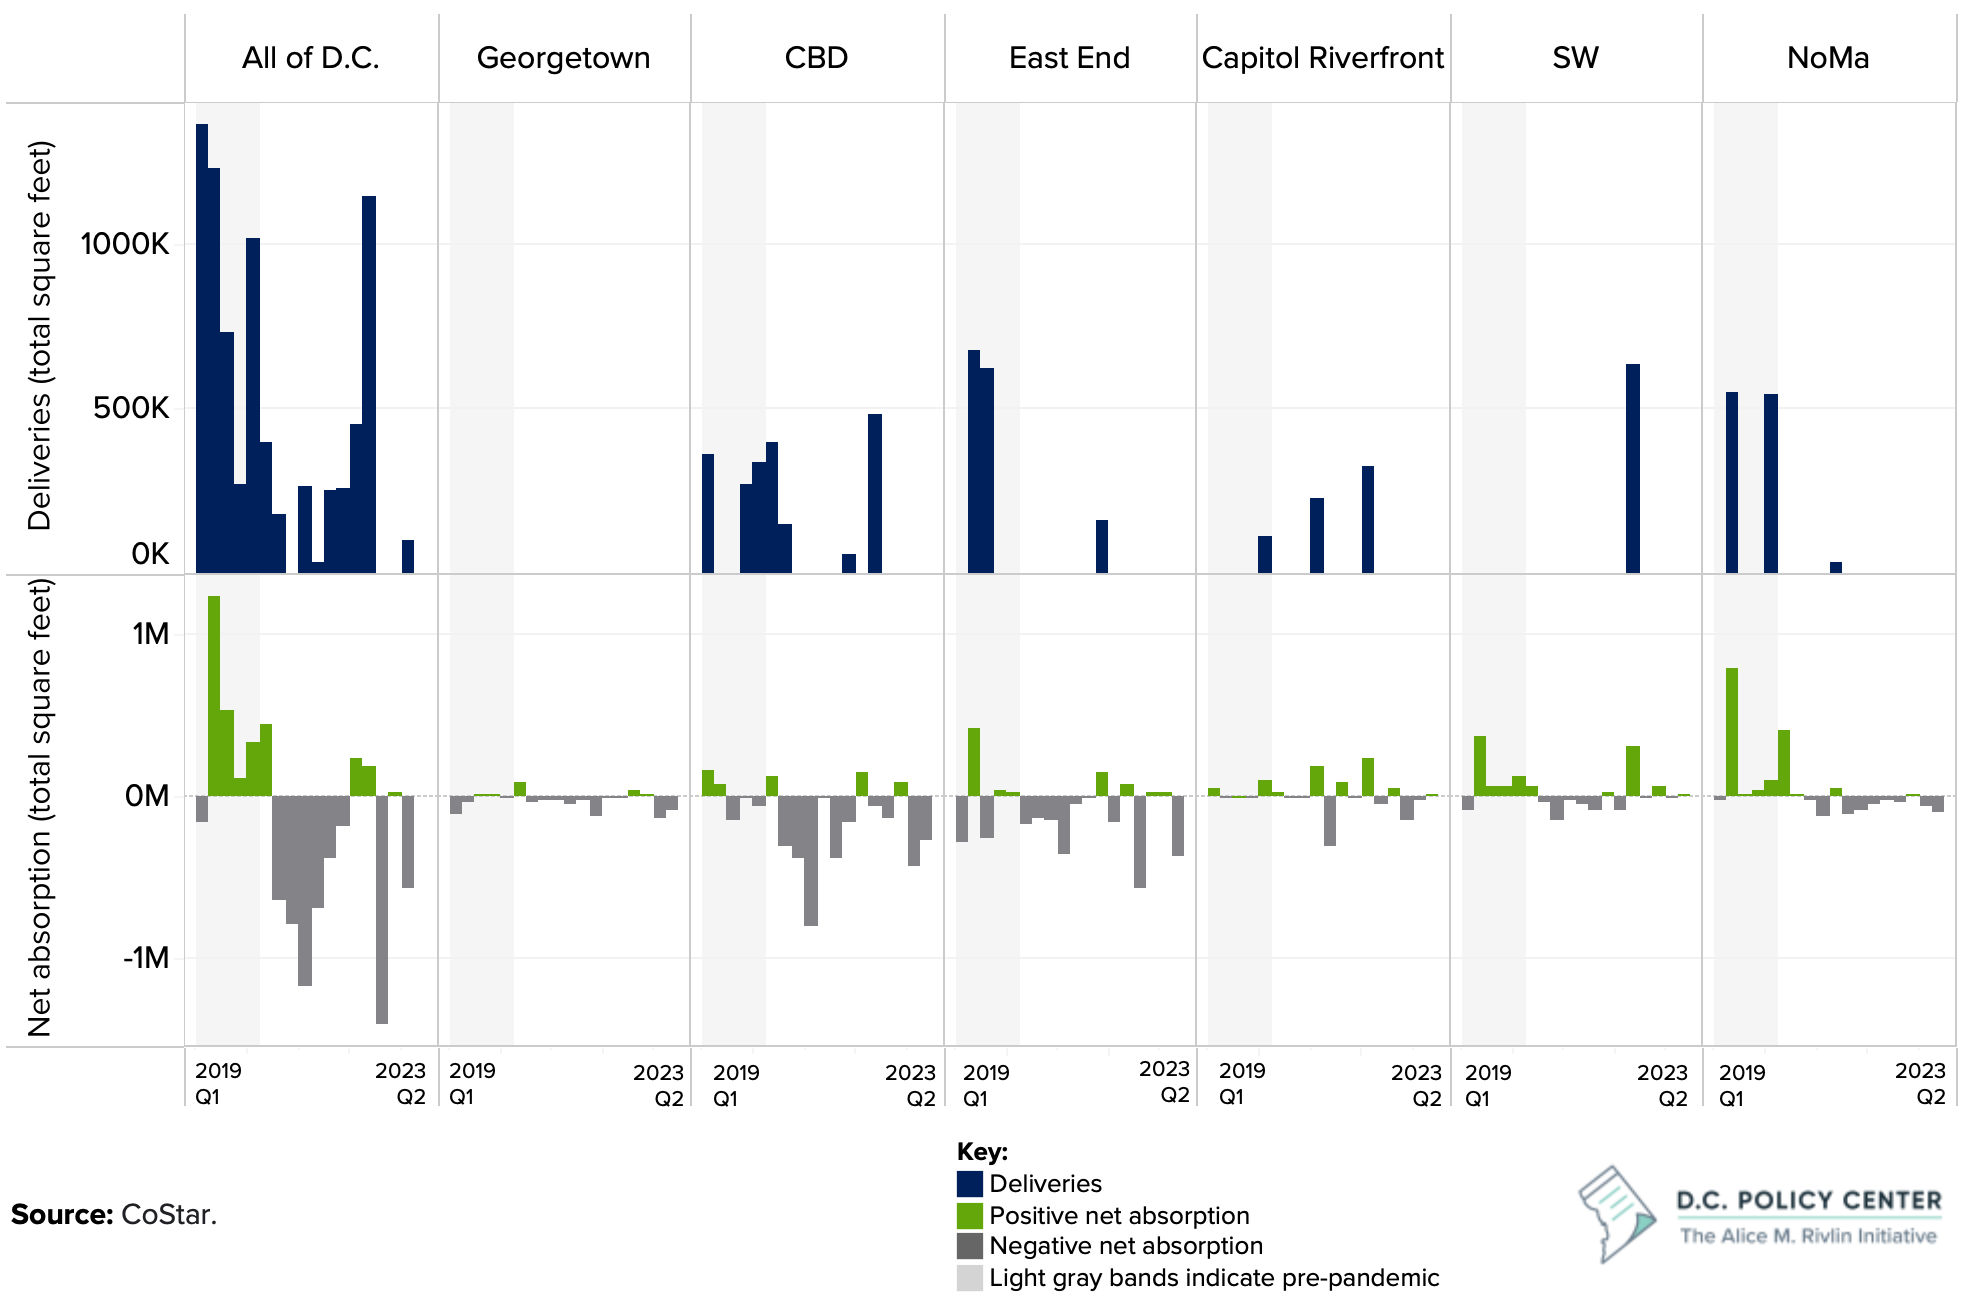
There are some bright spots in the commercial office market. Office vacancy rates are also rising in the Capitol Riverfront and Southwest markets, partly driven by growing inventory. [See Figure 7.] This increase is paired with rising rent as a response to increasing demand. Future data on net absorption will offer more insight. The commercial buildings in these more expensive neighborhoods attract office tenants because they are recently built, amenity-heavy, and located in more mixed-use neighborhoods, rather than office-heavy neighborhoods with older buildings, such as the Central Business District.
Figure 7. Office deliveries and net absorption in select submarkets (2019 Q1 to 2023 Q1)
Entrepreneurial activity
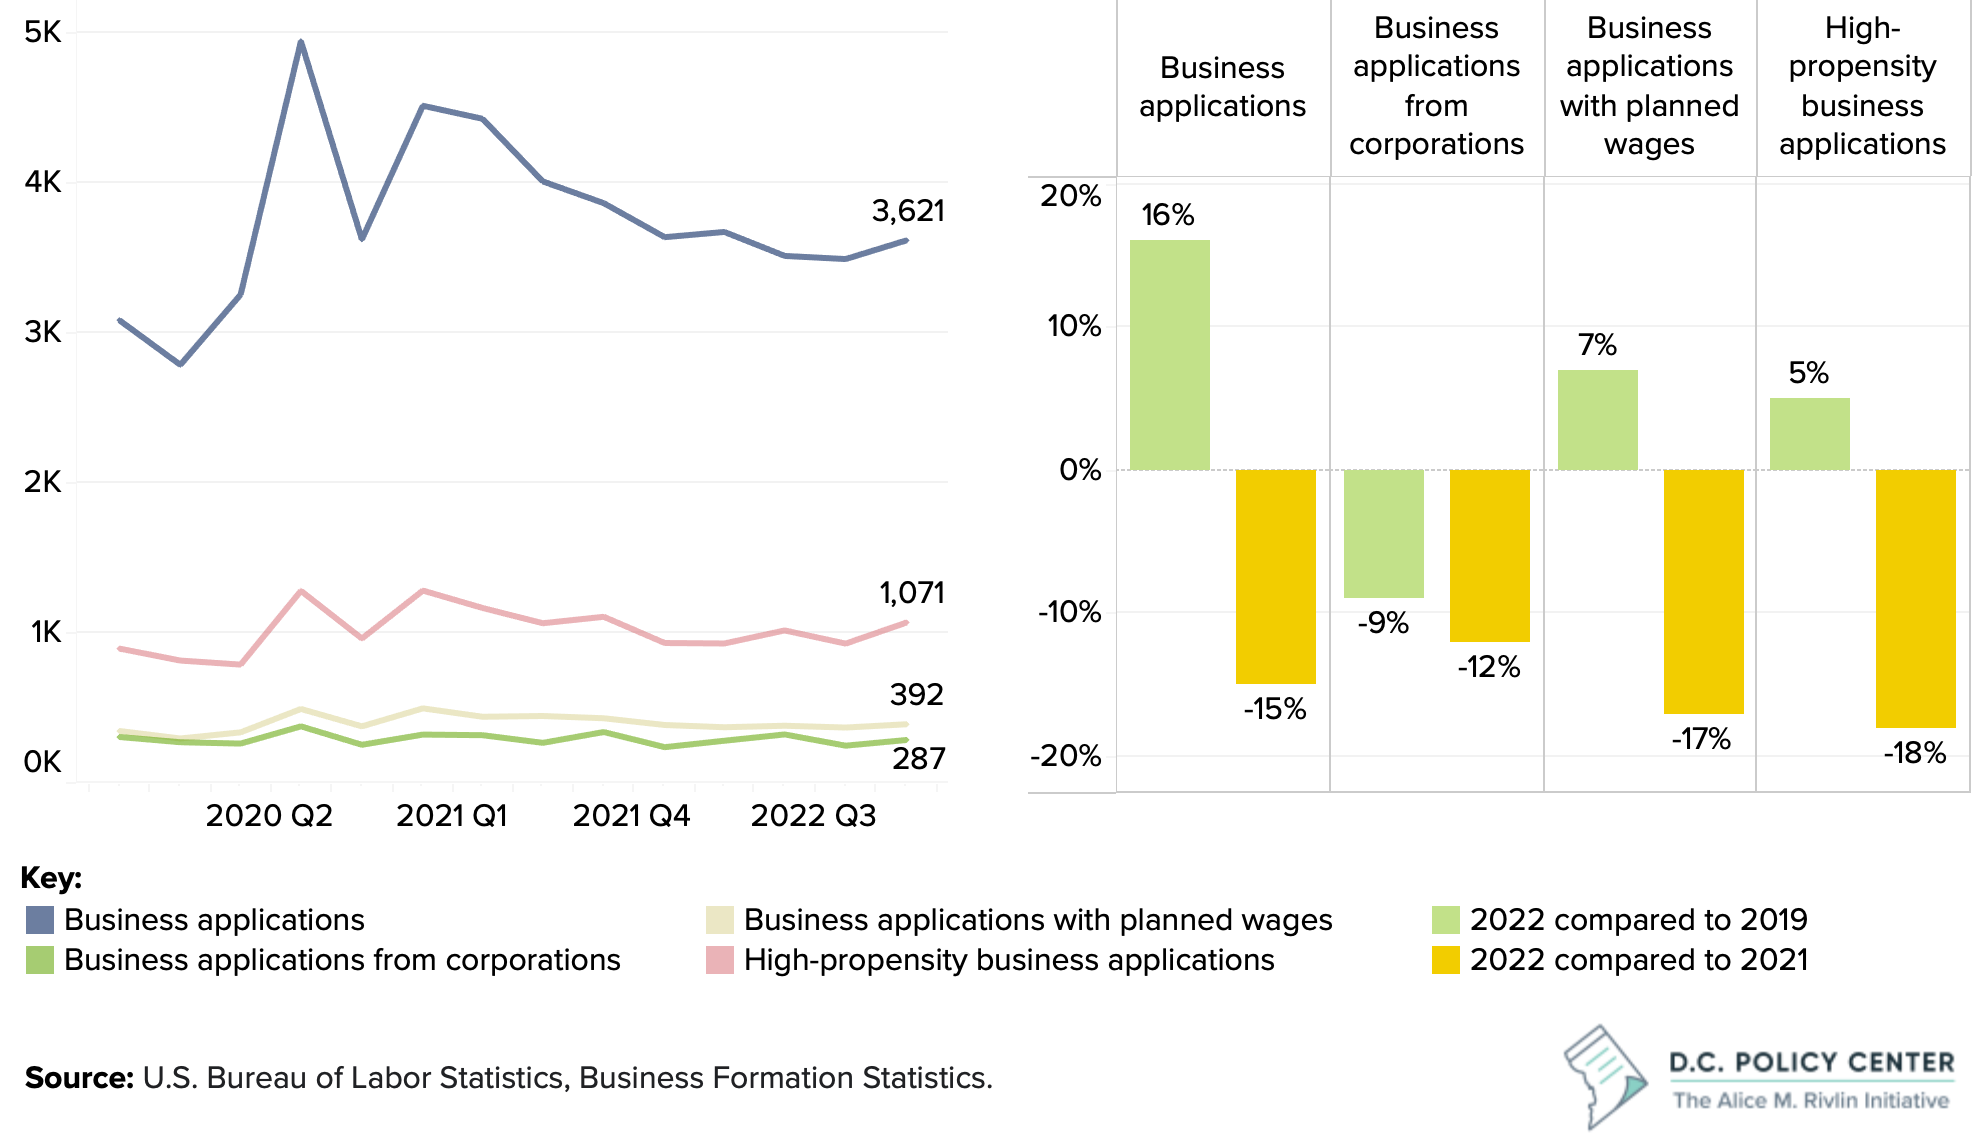
Despite challenges and risks, D.C. continues to attract entrepreneurial activity. Since the onset of the pandemic, one bright spot has been the uptick in start-up businesses. A spike in business applications occurred in the third quarter of 2020 and the first quarter of 2021. [See Figure 8.] Most likely, many of these applications stemmed from business owners who had been greatly impacted by the pandemic and were beginning to recover or rebrand. Since then, application submissions have slowed. In 2022, business applications in D.C. were still high relative to 2019 but slowing down relative to earlier in the pandemic.
By the end of 2022, business applications were up by 16 percent compared to 2019, but down 15 percent compared to 2021. Similarly, high-propensity business applications, or applications that are likely to result in wage-paying businesses, were up 5 percent compared to 2019, but down 18 percent compared to 2021.14
Figure 8. Business applications by year in the District of Columbia
Figure 9. Percent change in business applications filed
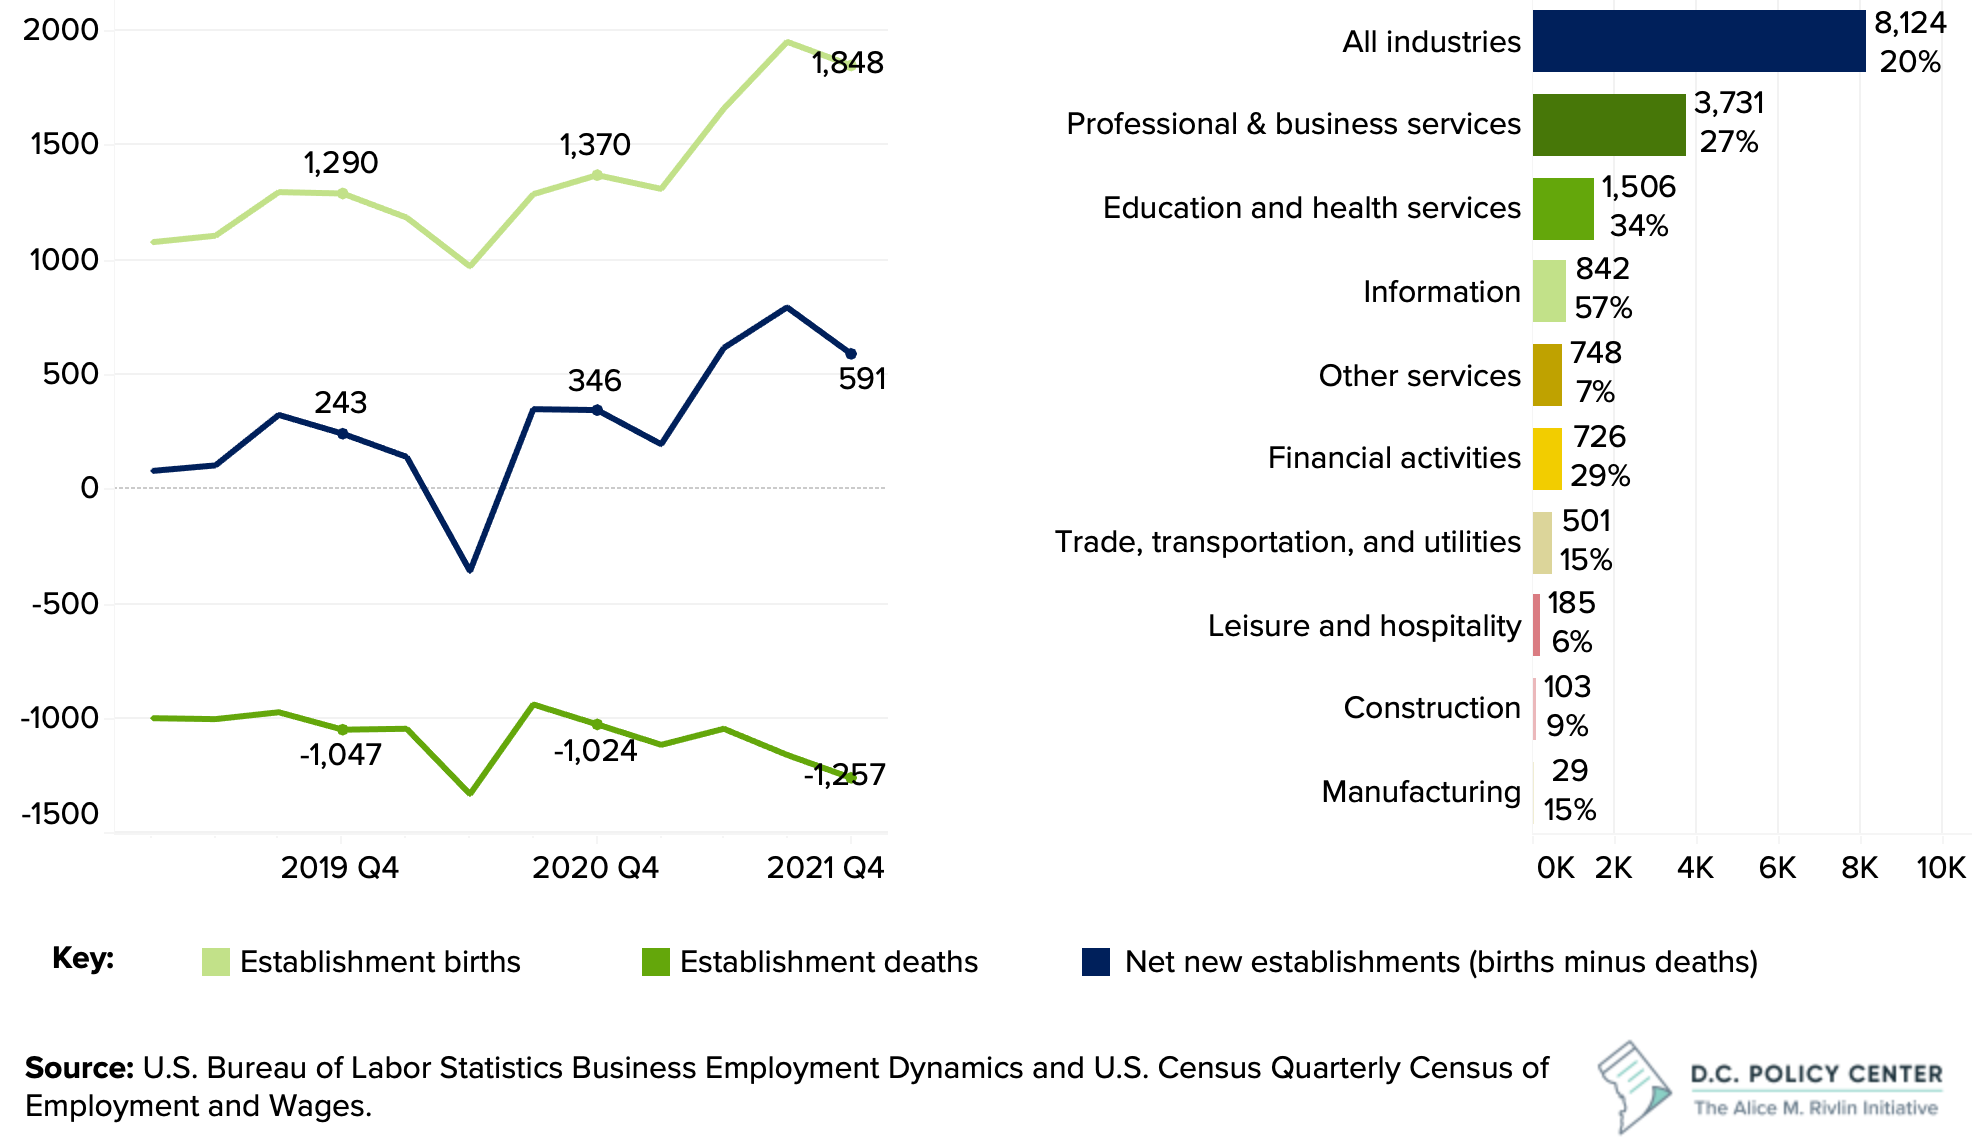
Alongside an uptick in business applications, business births in D.C.—new businesses opening in the city—have also increased compared to pre-pandemic. [See Figure 9.] In the fourth quarter of 2021, there were 1,848 new business births, up 43 percent from 1,290 new business births in the fourth quarter of 2019.15 In fact, as of the fourth quarter of 2022, across all industries, D.C. had 20 percent more private establishments compared to the same quarter in 2019. [See Figure 10.] This increase stems largely from new professional and business services establishments. Even the number of establishments in the leisure and hospitality industry, the sector most-negatively impacted by the pandemic, is up relative to 2019.16
Business closures, however, remain high. In the fourth quarter of 2021, D.C. lost 1,257 businesses. That is the equivalent of 20 percent more closures than the fourth quarter of 2019. Notably, the trajectory of business closures has not improved since the onset of the pandemic.17 These closures highlight the challenges many businesses continue to face in the wake of the pandemic. These business deaths could be due to loss of foot traffic and customers, new businesses that did not make it, or existing businesses that decided to move elsewhere for different reasons, including safety or excessive regulations. [See Figure 11.]
Figure 10. Establishment deaths and births in the District of Columbia
Figure 11. Net and percentage change in private establishments by industry
The increase in establishments in D.C. is good news. It means business owners are interested in setting up shop in the city, and their businesses have the potential to generate more jobs. But D.C. businesses still face ongoing challenges. Even prior to the pandemic, D.C. was a net exporter of businesses. Between 1990 and 2019, for every one business that moved to D.C., 1.7 moved to other regional jurisdictions. Though D.C. has always excelled at attracting small and young firms, the city remains a net exporter of those firms to elsewhere in the region.18 Now, as economic and job activity shift to the region’s suburbs and exurbs of the region, businesses may follow.
Chapter 2. An updated picture of the labor force
Today, the District has more business establishments than ever. But this has not yet translated into a full labor market recovery.
Resident employment, unemployment, and labor market participation
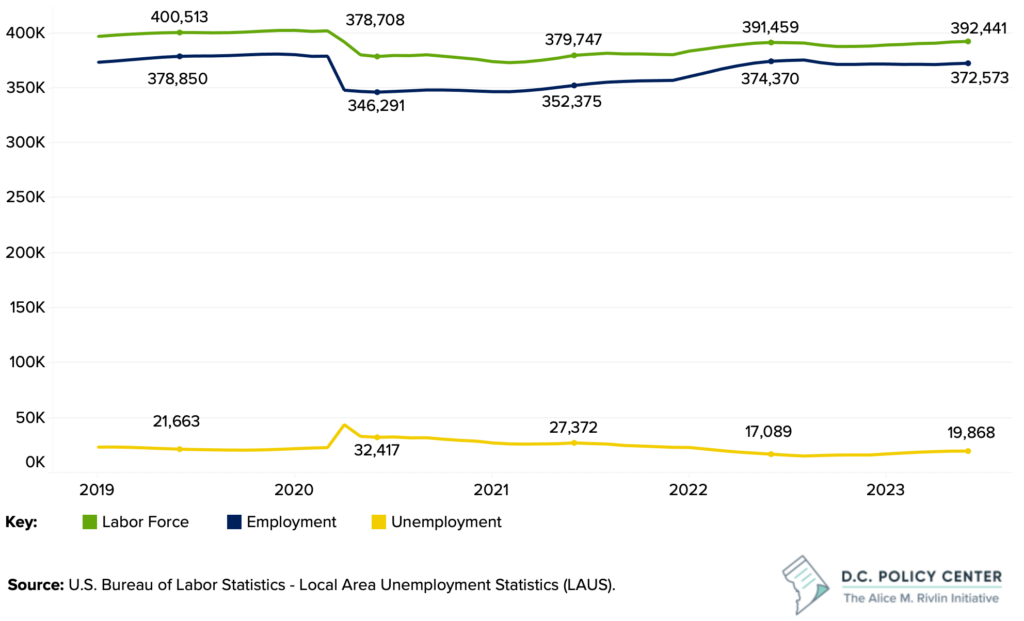
As of June 2023, resident employment, at 372,573, was still 1.7 percent below the June 2019 level, and the resident labor force, at 392,441, was 2.0 percent below the June 2019 resident labor force level. [See Figure 12.]
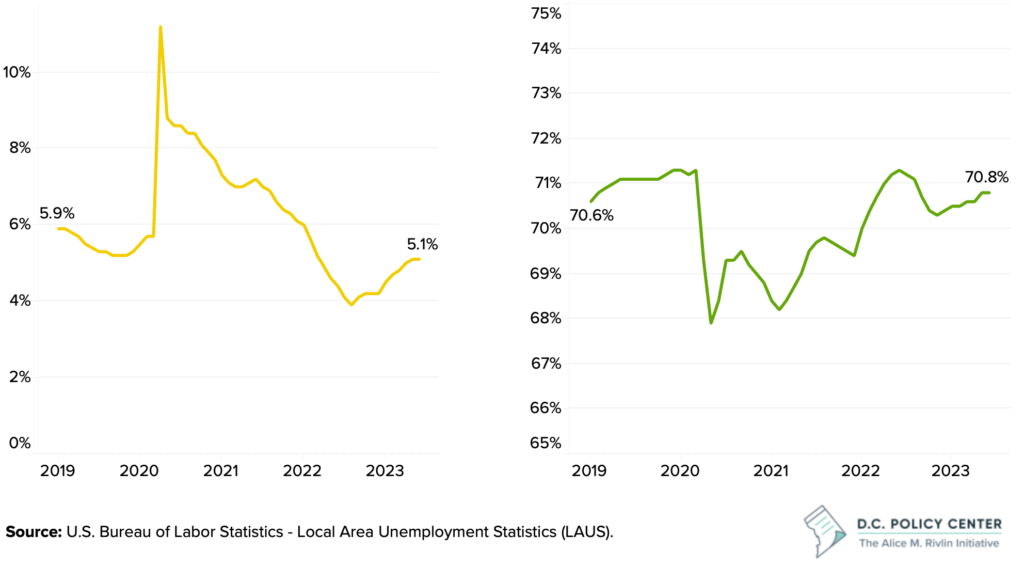
Resident unemployment is low—the number of unemployed residents is 8.3 percent below pre-pandemic levels. (The unemployment rate was 5.1 percent in June 2023.) Yet this low unemployment level does not necessarily translate into more people finding jobs. Instead, it is the result of the labor force shrinking faster than resident employment.19
Figure 12. District of Columbia resident labor force, employment, and unemployment levels
At the beginning of the pandemic, the decline in the labor force was largely driven by lower labor force participation. Many D.C. residents chose to not work, sometimes because they were worried about their health or the health of someone in their household; sometimes because they had to provide care; and sometimes because they were not able to find work and stopped looking.20 During that period, labor force participation dropped by 4 percentage points, from 71 percent to 68 percent. [See Figure 14.] At present, labor force participation is back to 71 percent, but resident employment has not recovered, because the District has lost population and workers. [See Figure 13.]
Figure 13. District of Columbia resident unemployment rate
Figure 14. District of Columbia resident labor force participation rate
Total employment in the city
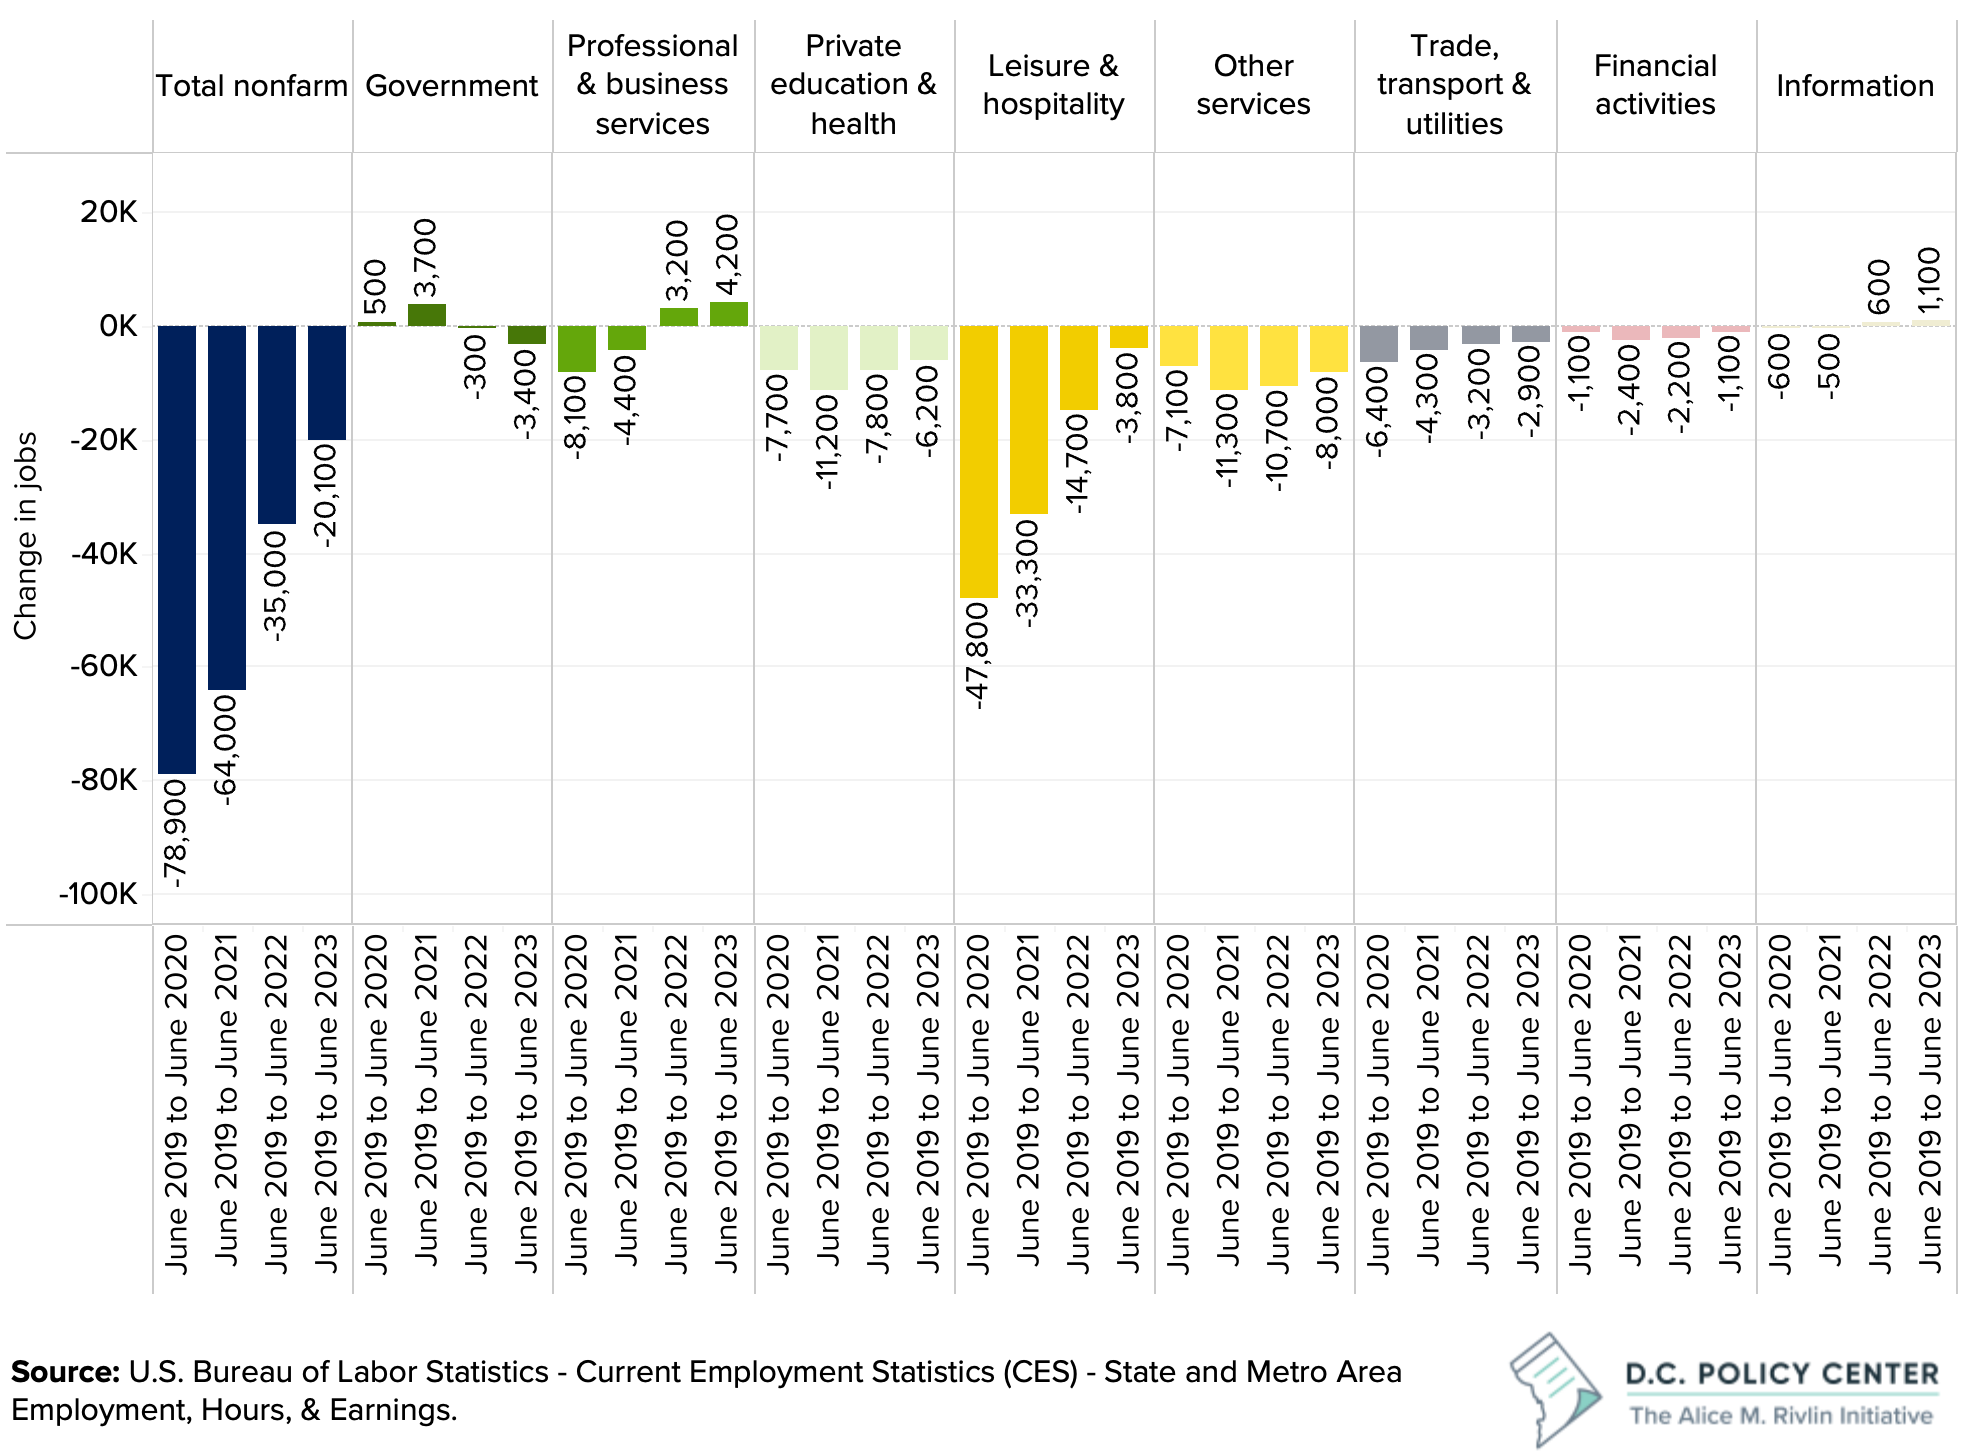
Total employment, which includes those who work in D.C. but may or may not live in D.C., also remains below pre-pandemic levels. As of June 2023, total non-farm employment in D.C. was 20,100 jobs below the June 2019 level—a 2.5 percent decline. [See Figure 15.] Most industries have not fully recovered from the repercussions of the pandemic, in particular the Leisure and Hospitality and Other Services sectors. Employment in these two service-oriented sectors remains well below pre-pandemic levels—4.7 percent below and 10.3 percent below, respectively. This is unsurprising given these industries were hit hardest by the pandemic.
The bright spots in employment recovery are within the Professional and Business Services sector and the Information sector. [See Figure 16.] These are the only two sectors that fully recovered from the pandemic’s impact and exceeded pre-pandemic employment levels. Professional and Business Services employment in June 2023 was 2.5 percent above the June 2019 level, and employment in the Information sector was 5.5 percent above June 2019.21
This aligns with business performance trends, as most net-new businesses have been within these sectors, which has likely led to new jobs. It is also possible that service workers are making the shift to office-based, remote-eligible jobs after the stress of working through the pandemic. However, there are signs that employment growth is stalling. During the first six months of 2023, for example, the Professional and Business Services sector barely grew (up 0.45 percent), adding only 800 jobs.
Figure 15. Employment by industry in the District of Columbia
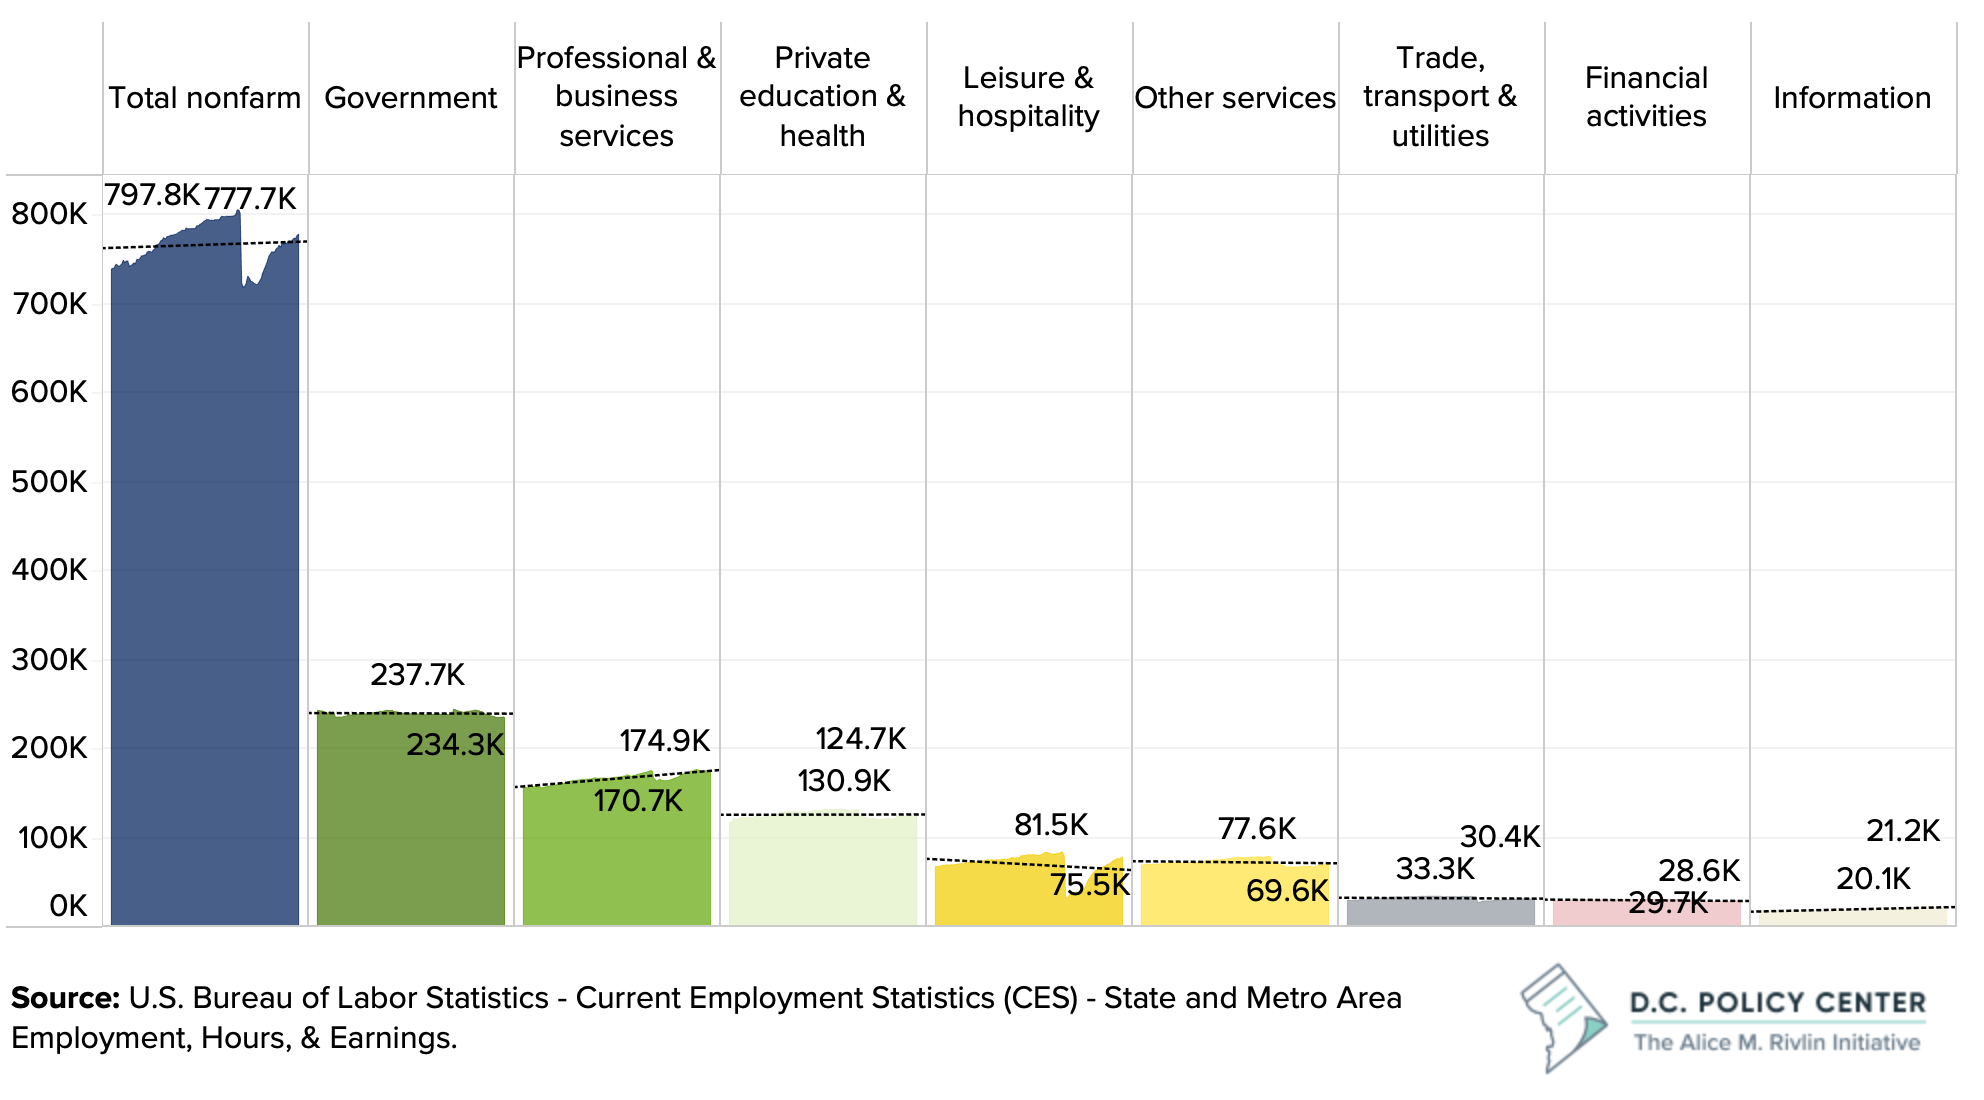
Figure 16. Recovery progress by industry and year in the District of Columbia
Job turnover and hiring challenges
Continued challenges in hiring are part of why employment has not yet returned to pre-pandemic levels. Employers are hiring at a faster rate than they did before the pandemic, but they are not able to fill all of their advertised positions. Job openings have been consistently above new hires, but the gap between job openings and net new hires (new hires minus separations) has widened since the beginning of the pandemic. [See Figure 17.]
Figure 17. Job openings, new hires, and net new hires, January 2019 through June 2023, 3-month moving average
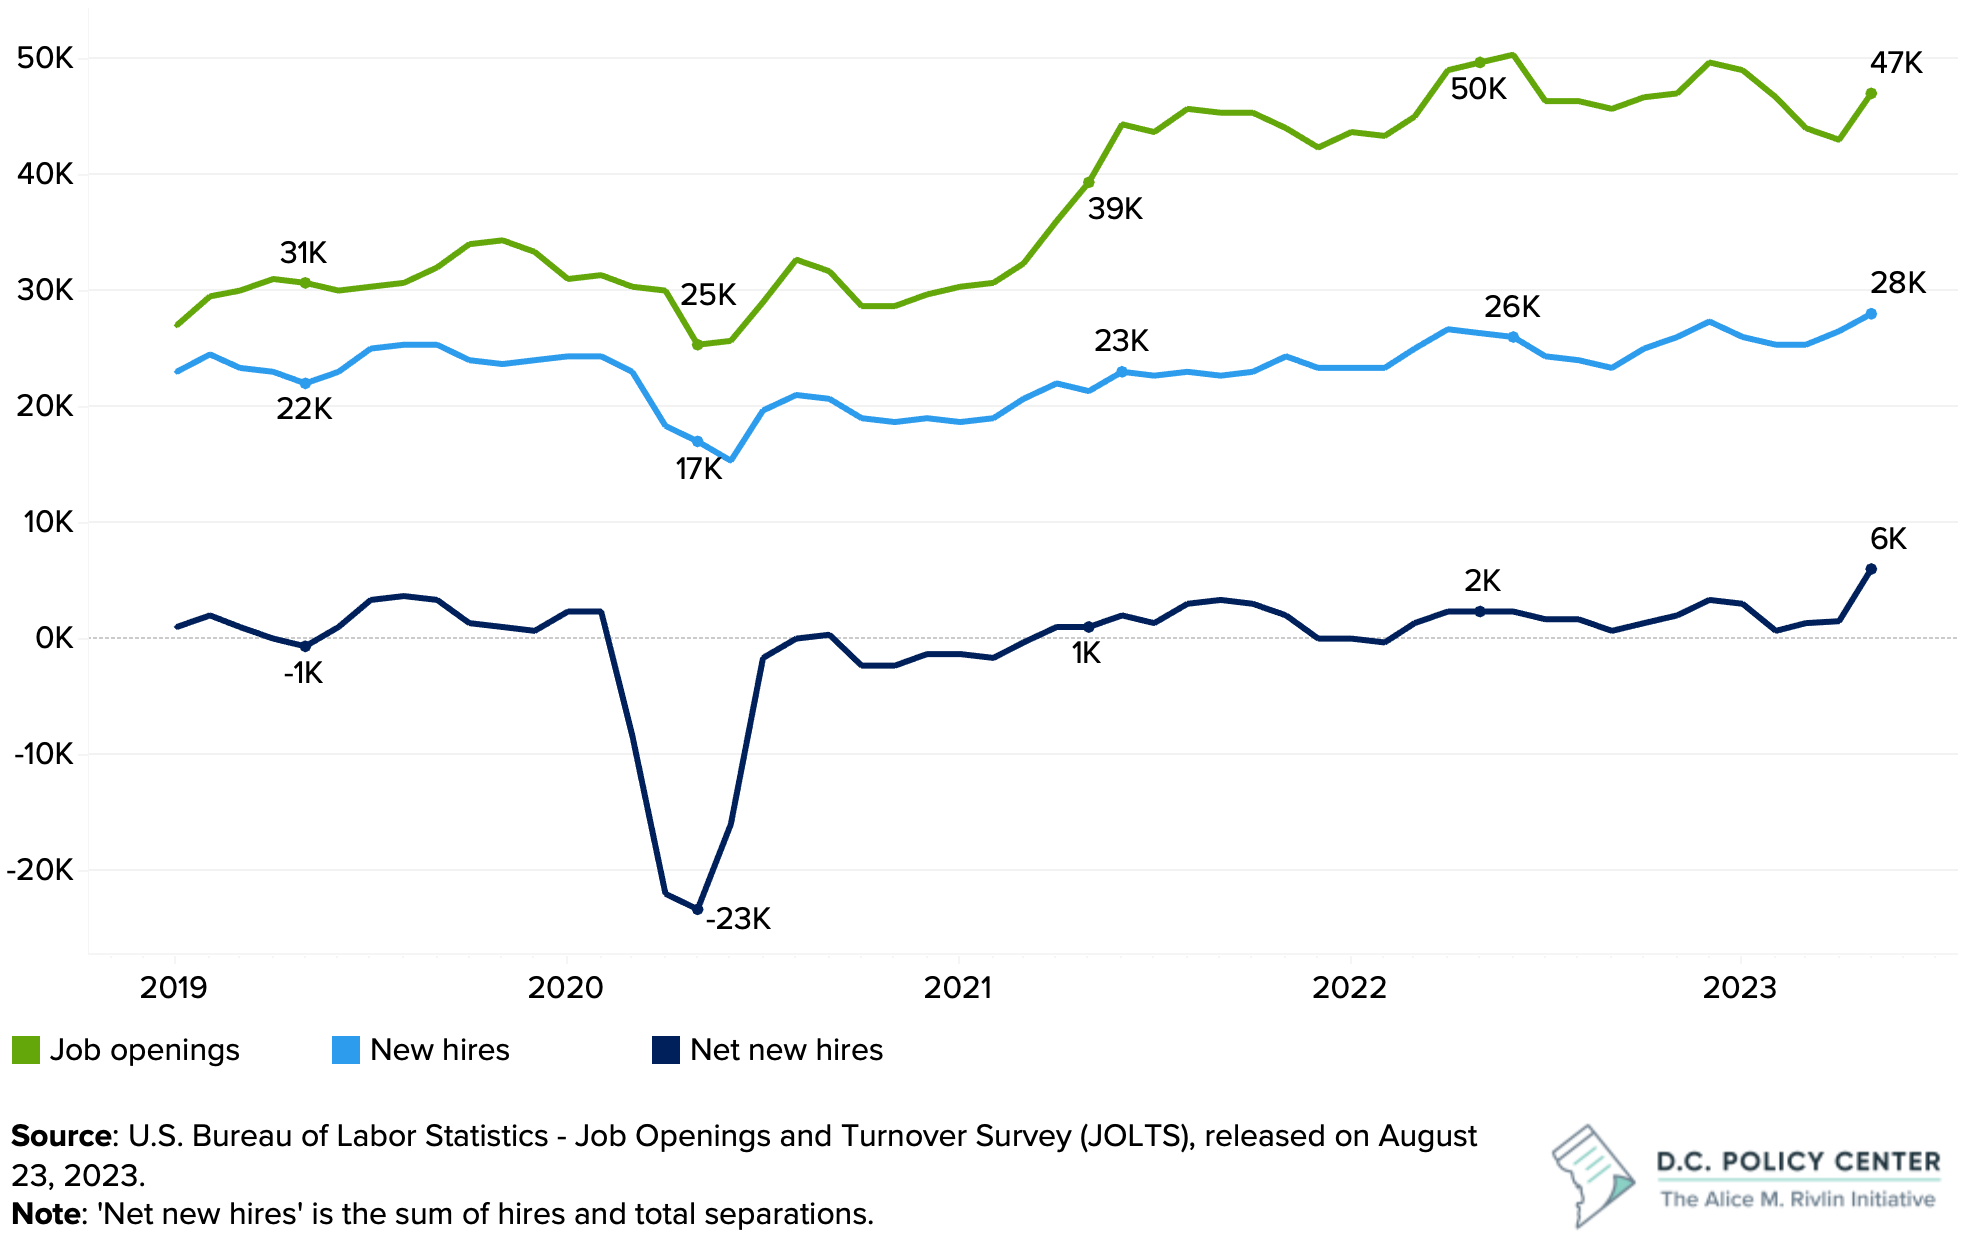
Job postings and hires continue to remain above pre-pandemic levels. In the 6-month period between January 2023 and June 2023, job openings were down 5 percent relative to the previous 6-month period, but job openings were still up by 44 percent compared to the period from October 2019 to March 2020.22 Consequently, the rate of new job postings is slowing down relative to earlier in the pandemic while the city is still seeing historically high levels of demand for new workers. This indicates that either employers are having a hard time filling positions, or people are not interested in working in D.C.
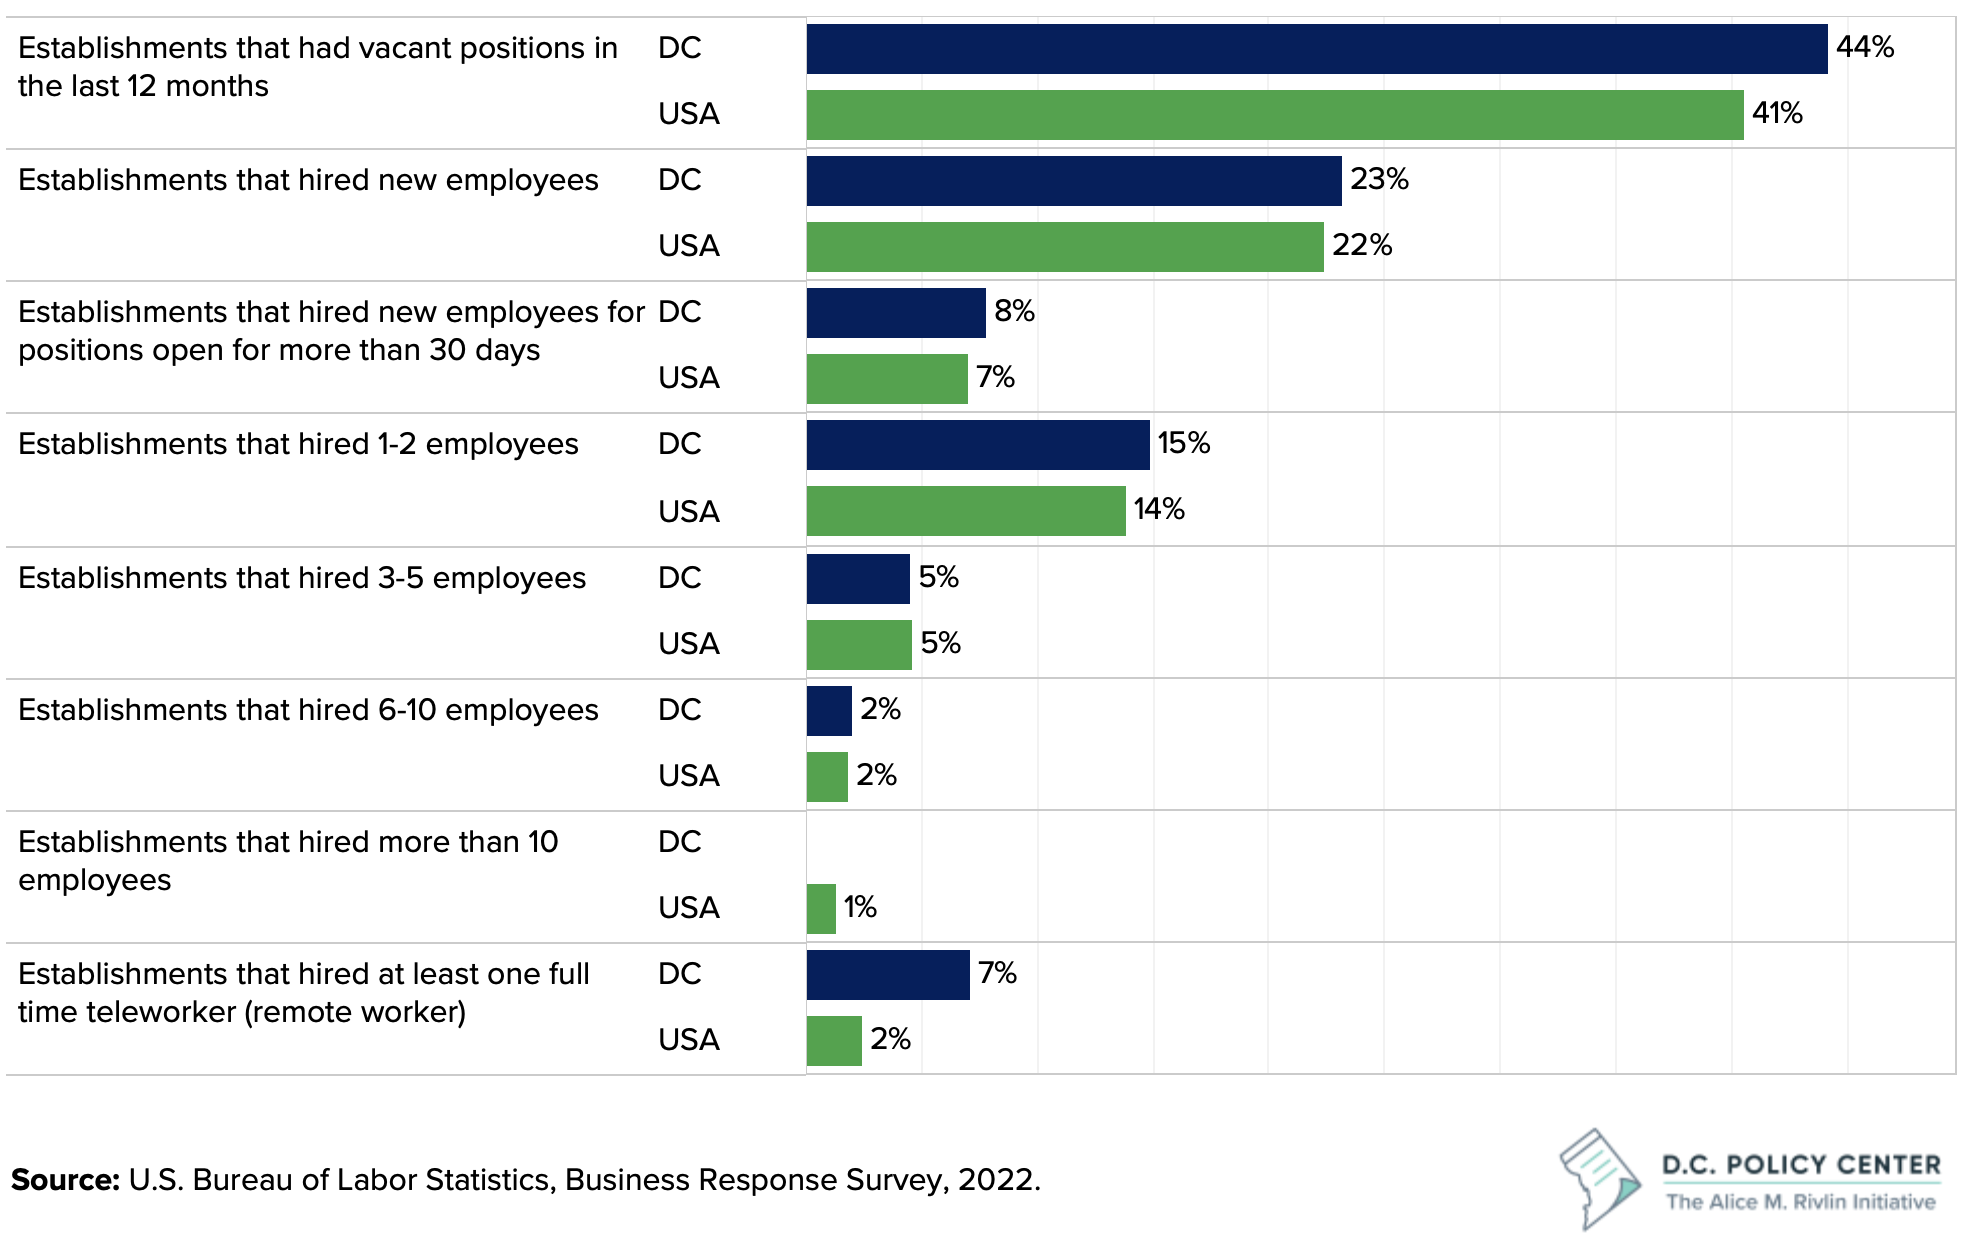
A slightly larger share of business establishments in D.C. had a vacant position in the last 12 months (when surveyed in September 2022) compared to the rest of the country, suggesting that hiring has been difficult. [See Figure 18.] In D.C., 44 percent of businesses reported vacancies, and only about half of them were able to fill those vacancies.
While D.C. resembles the rest of the country in the number of new hires by each business establishment, D.C. businesses are three times more likely than the rest of the country to hire remote workers.
Figure 18. Hiring needs and patterns in D.C. and nationally
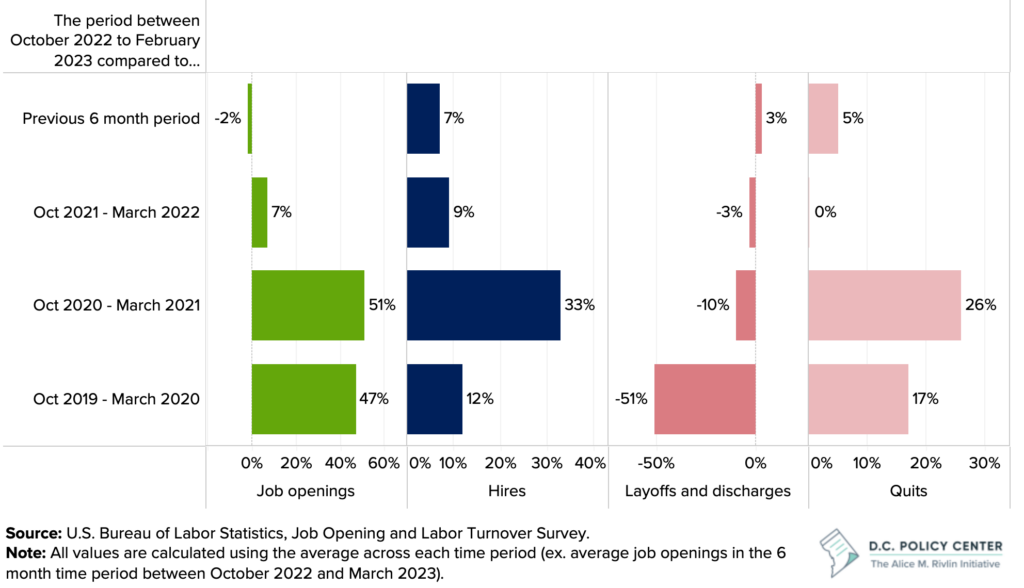
Finally, compared to early in the pandemic, the “quit rate” is beginning to slow down in D.C., yet it still remains above pre-pandemic levels. [See Figure 19.] An elevated quit rate could stem from employee dissatisfaction. For example, if employers are struggling to offer the benefits and raises necessary to retain employees. Though there has been a recent uptick in employee layoffs and discharges, and employers are still laying off employees at lower rates than before the pandemic. This increase in layoffs paired with a slowdown of resignations implies the pressure may have lifted from employers because they no longer need to operate in a job seeker’s market.
Figure 19. Percent change in hires, job openings, layoffs and discharges, and quits
Chapter 3. Doing business under fiscal distress
While D.C. businesses continue to face new trials as they recover from the pandemic, business expectations are improving.
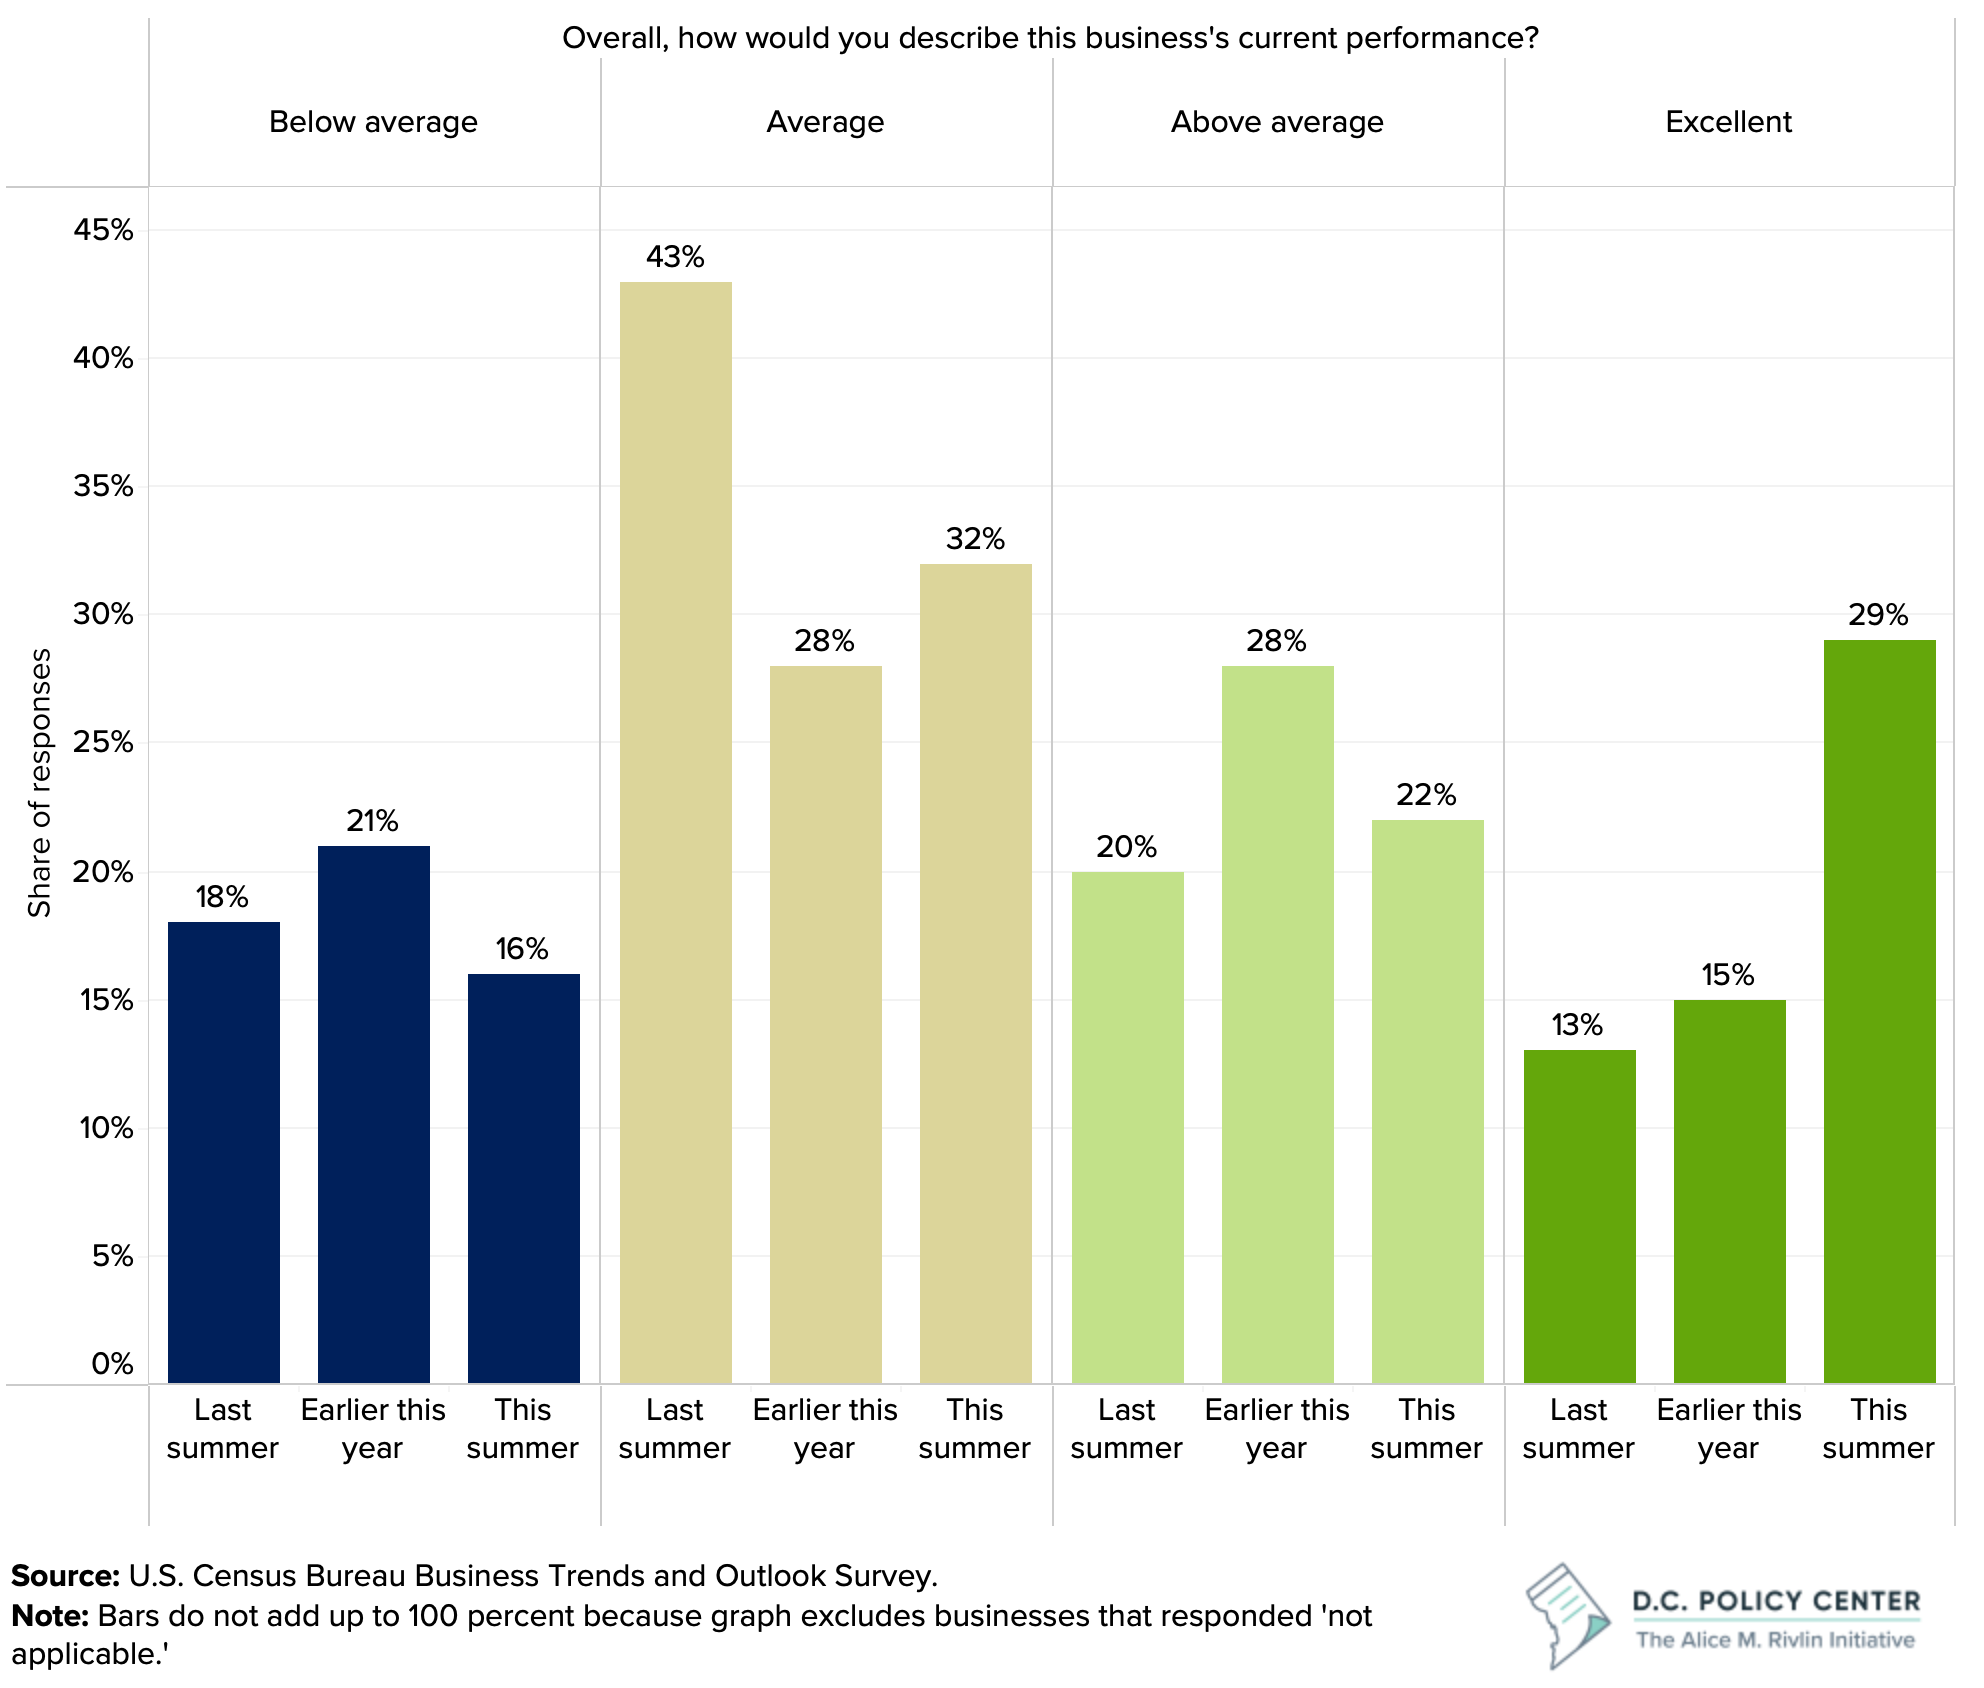
In the first two weeks of June 2023, 29 percent of D.C.’s businesses described their performance as ‘excellent,’ up from 15 percent last summer. [See Figure 20.] As post-pandemic conditions become the norm, it is likely that many businesses have already adapted and are starting to stabilize at a new normal.
However, it’s also possible that business expectations are improving thanks to the weeding out of businesses that were struggling while those that remain are doing well. Even as many businesses thrive, a third of businesses reported their performance as ‘average,’ suggesting continued room for improvement.23
Business expectations and concerns
Last year, key concerns for small businesses included hiring new employees, adopting or expanding use of digital technologies, improving existing goods or services, and compensating employees as inflation rises. While these concerns remain for many businesses in the city, business expectations are generally improving. [See Figure 21.]
Figure 20. Business performance in D.C.
‘Last summer’ refers to data collected between 7/18/2022 and 7/31/2022
‘Earlier this year’ refers to data collected between 1/16/2023 and 1/29/2023
‘This summer’ refers to data collected between 6/5/2023 and 6/18/2023
In the first two weeks of June 2023, 18 percent of D.C.’s businesses reported that they expect to have difficulties hiring paid employees in the next 6 months, compared to 31 percent of businesses last summer during the same period.24 The job turnover data show that new hiring and job postings are starting to slow down, perhaps indicating that businesses are not planning to hire as much in the next 6 months, or hiring pressures are easing as prospective employees’ priorities are shifting. For example, if prospective employees fear a recession, they may not be willing to negotiate a higher salary.
Figure 21. Business expectations in the District of Columbia
‘Last summer’ refers to data collected between 7/18/2022 and 7/31/2022
‘Earlier this year’ refers to data collected between 1/16/2023 and 1/29/2023
‘This summer’ refers to data collected between 6/5/2023 and 6/18/2023
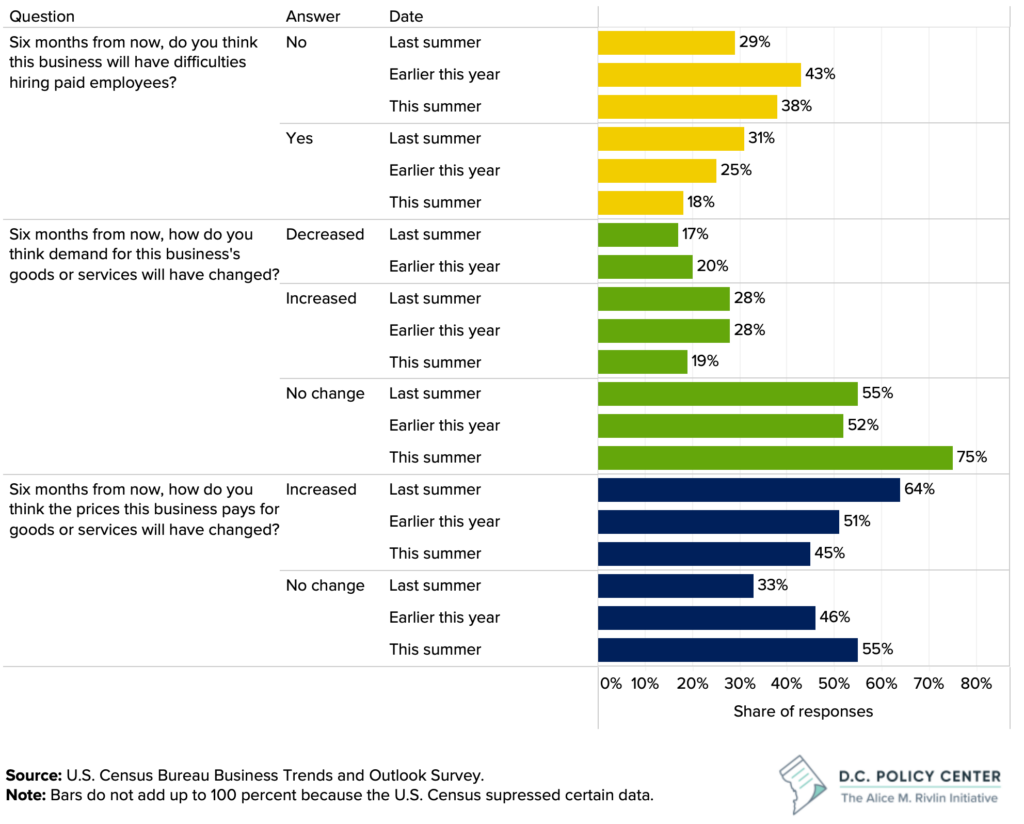
When asked about their expectations for business services or demand for goods, three in four D.C. businesses reported that they expect no change in demand, while about one in five reported they expect either an increase or decrease in demand. In some ways this is good news—there has not been a significant spike in the number of businesses reporting they expect decreased demand. But the data do not reveal whether the expected level of demand is above or below pre-pandemic levels.
Finally, concerns about inflation seem to have tapered off. Last summer, 64 percent of D.C. businesses expected an increase in the prices they pay for goods and services. Though still high, that share has dropped to 45 percent this summer.25 This implies that businesses expect inflation pressures to stabilize, reducing some of the financial stress on business operations.
Though data are limited, it is likely that in recent and coming months, maintaining demand will continue to be a key concern for businesses, especially those operating in downtown D.C. This aligns with shifting dynamics in the region, as more workers and people spend time outside of downtown.
Fiscal supports
As economic activity and job activity shift to elsewhere in the region, D.C. faces fiscal losses. With a decrease in the city’s regular commuters, sales taxes collected from commuters and office property valuations will continue their decline, resulting in a drop in city tax revenue unless the District can raise this revenue from elsewhere. City leaders will likely have less money to meet increasing needs, at a time when many businesses are still recovering from the pandemic.
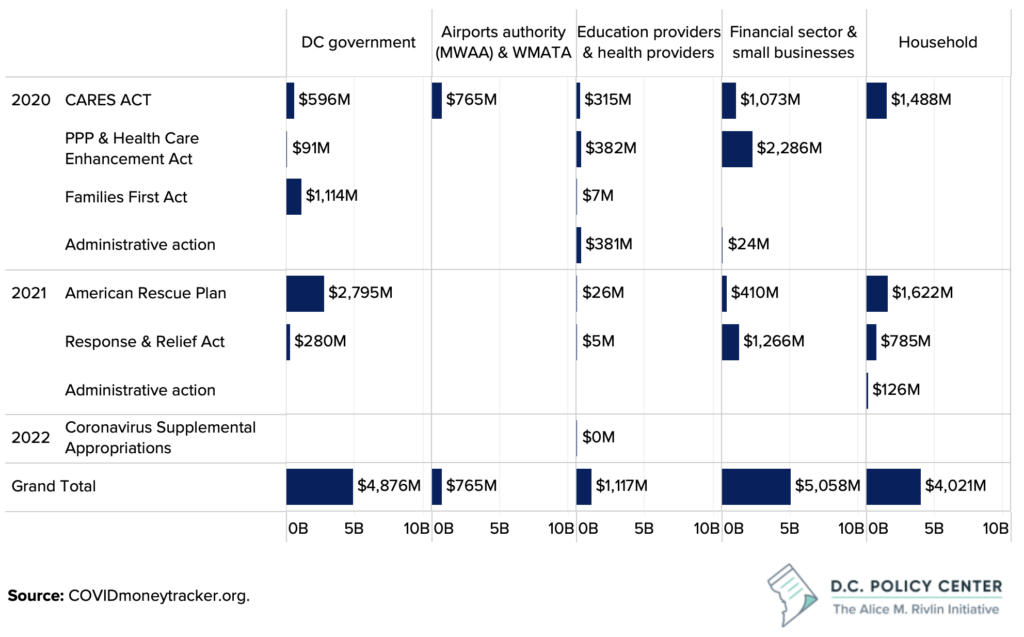
In response to the pandemic’s devastating impact on the economy and public health, the federal government enacted multiple statutes to provide fiscal aid to state and local governments, households, businesses, healthcare providers, schools, universities, financial institutions, and public transportation entities. Through seven separate laws, the District has been authorized to receive over $15 billion in federal funds. These funds created unprecedented supports for District residents and businesses at the beginning of the pandemic and continue to support the District government’s operations. [See Figure 22.]
Figure 22. Federal funding made available for D.C. under various federal initiatives in response to the COVID-19 pandemic
Since 2020, small businesses alone have received $5 billion in federal fiscal grants and loans. [See Figure 23.] The first wave of support came in the form of forgivable Paycheck Protection Program (PPP) loans. In the District, 23,455 different business establishments received approval for a PPP loan through the program’s two tranches in 2020 and 2021 for a total of $3.08 billion.26 Of the businesses that received PPP loans, 20,258 were small businesses with fewer than 20 employees, which qualified them for loan forgiveness for loans under $150,000. The total amount of PPP loans approved for these small businesses was $784 million, and of this amount, $721 million has been forgiven.
Figure 23. Federal supports made available for small businesses in D.C.
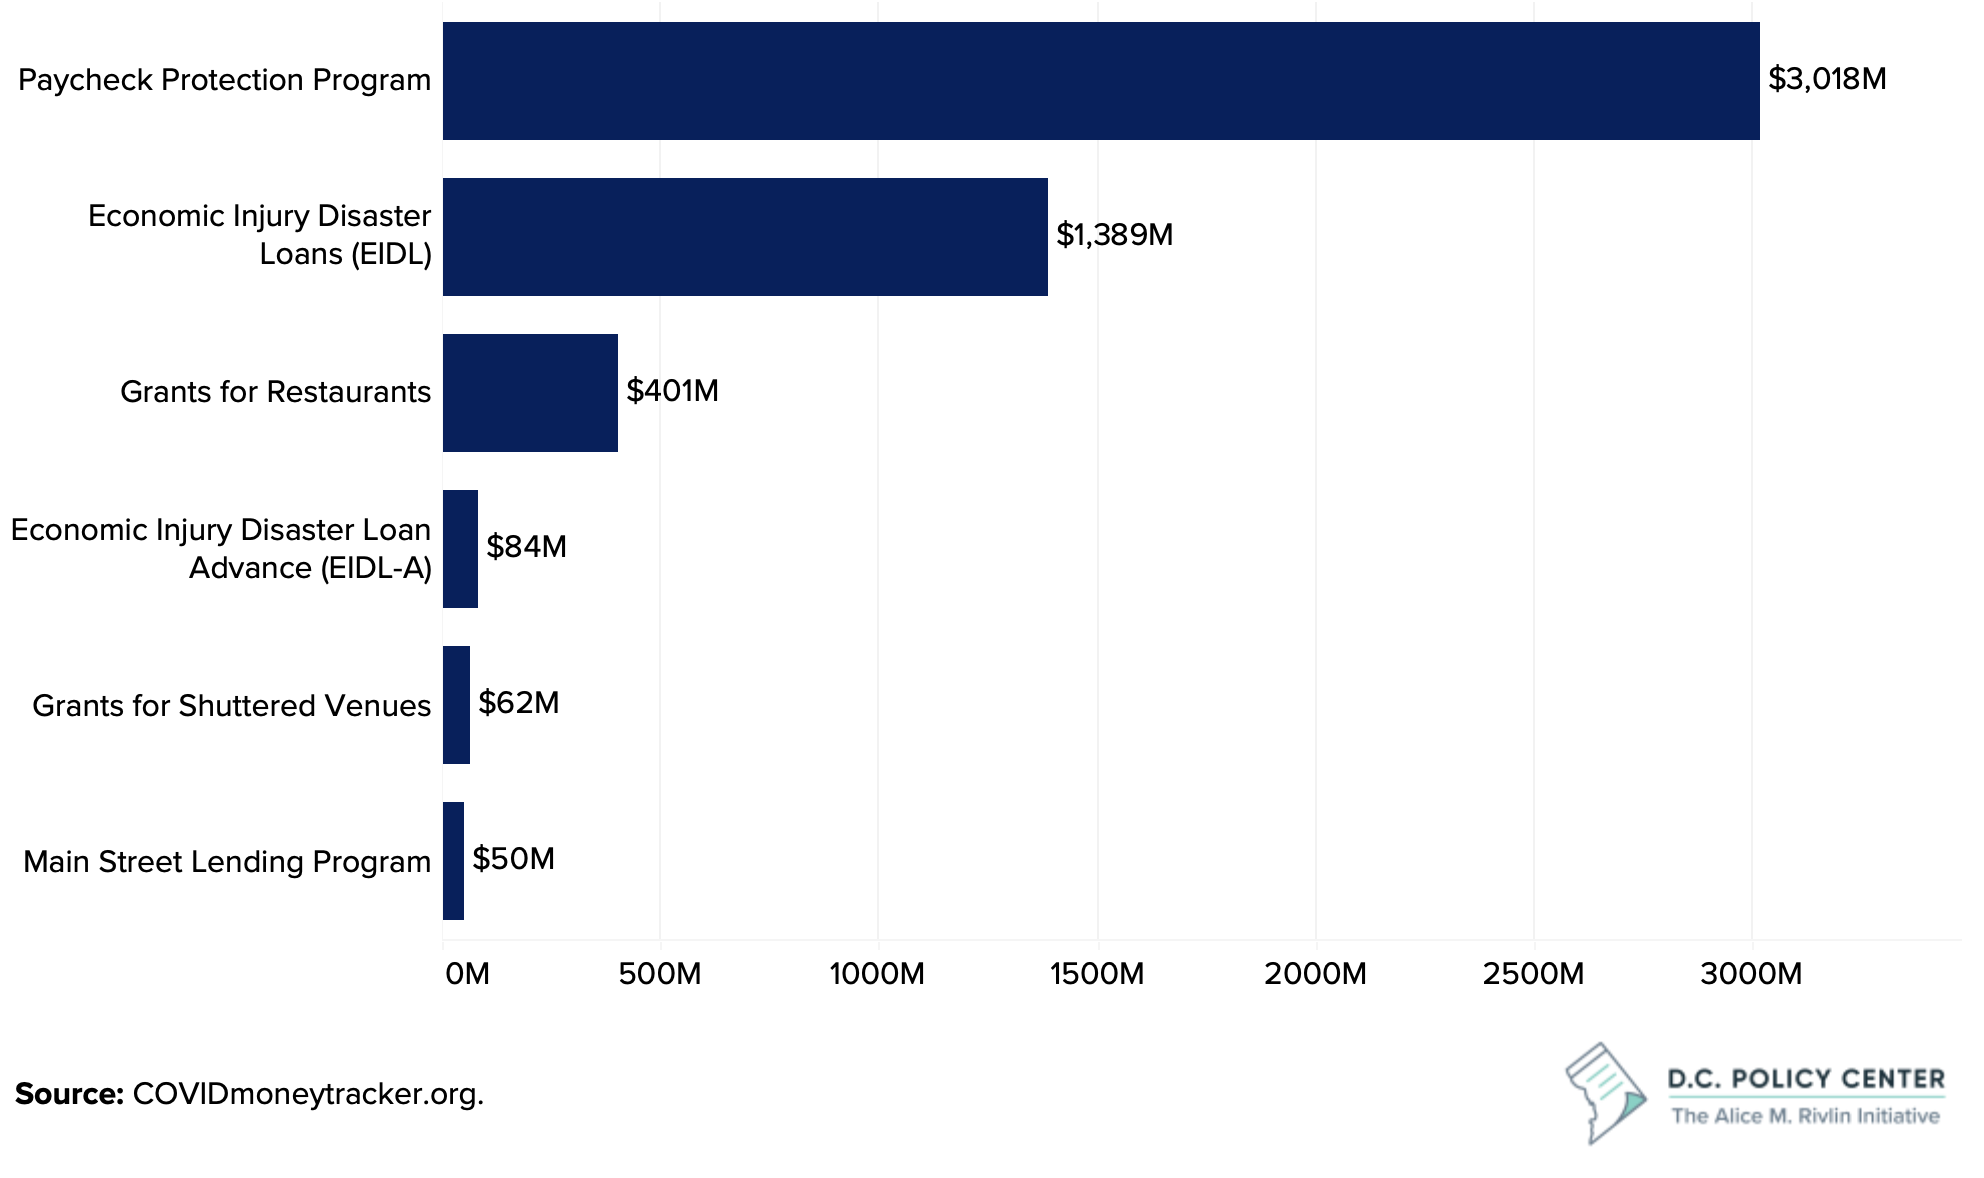
In addition, 14,561 business establishments applied for an Economic Injury Disaster Loan (EIDL) through the U.S. Small Business Administration and qualified for a one-time advance of stipends between $1,000 and $10,000. These advances totaled over $84 million in 2020 and 2021.27 Among those establishments that applied for an EIDL, 7,367 were approved for larger loans, collectively receiving $1.4 billion in low-interest loans. The federal government also supported 705 D.C. restaurants with $400 million in grants approved under the American Rescue Plan Act in 2021,28 and 78 arts and entertainment establishments with $92 million in grants that targeted “shuttered venues” and were approved under the Response and Relief Act.29 [See Figure 24.] These supports were made available through 2020 and 2021 and are now exhausted.
Figure 24. Federal restaurant and shuttered venue grants made available for small businesses in D.C.
The District government also supported small businesses through the pandemic with expanded grants. [See Figure 25.] In fiscal years 2018 and 2019, before the pandemic began, the Office of the Deputy Mayor for Planning and Economic Development provided various direct and indirect grants to businesses, but the amounts were generally under $3 million per year. In fiscal year 2020, D.C. government grants for businesses increased to $38.6 million, and in fiscal year 2021, it was $96.4 million. In fiscal year 2022, it was $86 million.30 The funding for these grants in fiscal year 2023 is $62.8 million, but this amount has declined to $16.7 million in the approved fiscal year 2024 budget.31
Figure 25. D.C. government grants and supports for businesses before and during the COVID-19 pandemic
The D.C. government received $4.9 billion in federal fiscal aid since 2020. This is the equivalent of 40 percent of the city’s annual local revenue. These funds have allowed the District to respond to immediate needs when the pandemic hit, maintain service levels despite declining revenue, and even expand government services and invest in new programs to aid recovery. This funding is now expiring. Fiscal Year 2024 is the final year in which the District can use federal fiscal aid to balance its budget and pay for additional services.
Financial outlook
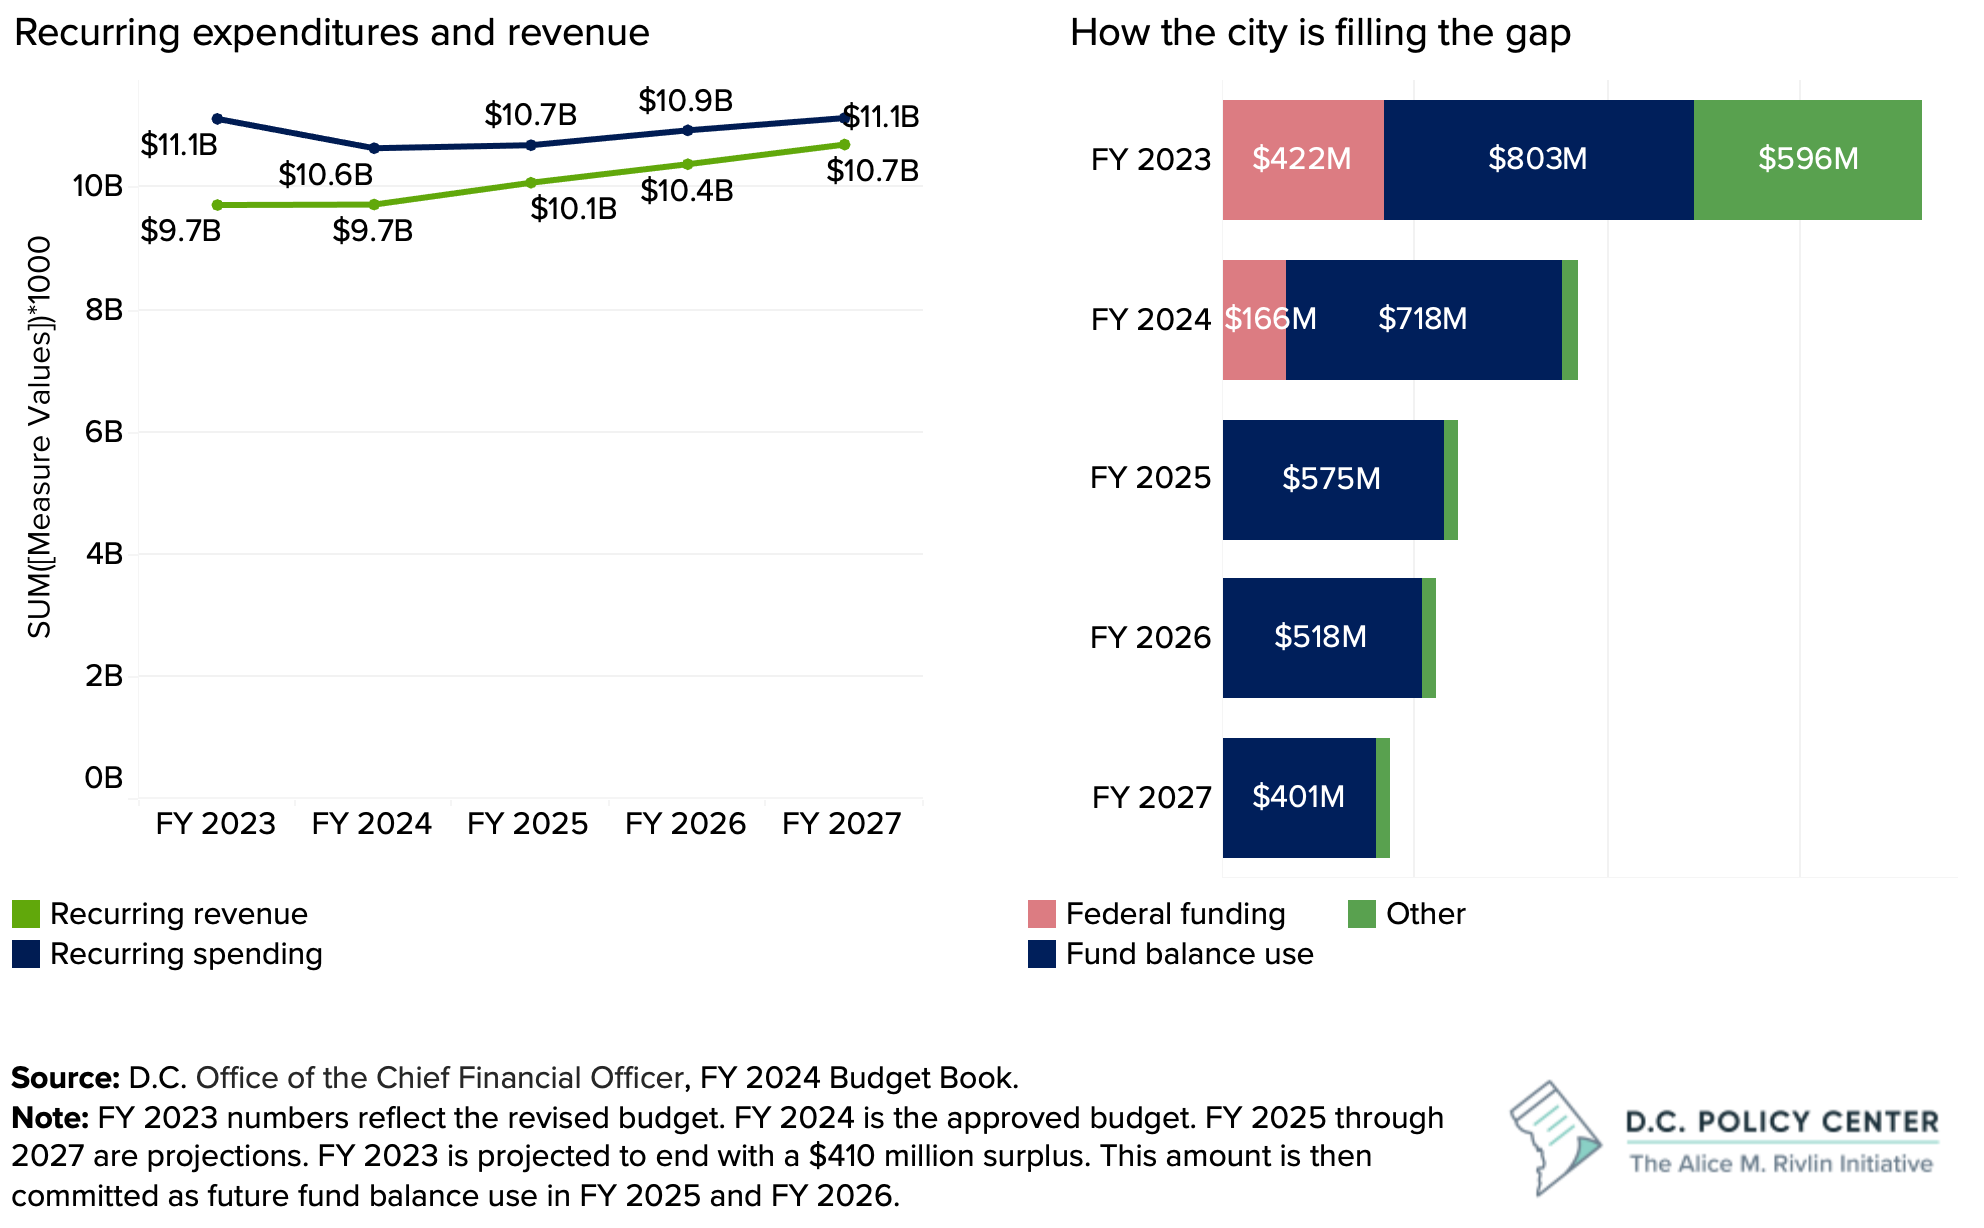
While the city has been able to maintain and grow its budget during the pandemic, it is unlikely that such high spending levels could be maintained in the coming years. The District’s approved budget documents indicate that in fiscal year 2023 and over the next four fiscal years, the city’s recurring revenue will not be high enough to cover its recurring expenditures. [See Figure 26.] For example, in this fiscal year (FY2023), the city is relying on $1.4 billion of one-time resources to balance its budget.
During the next four-year budget and financial plan period, the city is projected to collect $40.9 billion in recurring revenues but has committed to spending $43.0 billion. That $2.1 billion gap will be largely filled by the city’s past savings, since the last year during which the District can rely on federal fiscal aid is fiscal year 2024. While this is a balanced financial plan, it can only be achieved if fiscal year 2025 spending declines by 4 percent, and budget growth in the out years is kept below 2 percent. This is a very different scenario than the one the city has become accustomed. For example, the city’s budget grew by 10 percent from fiscal year 2021 to fiscal year 2022, and by 17 percent from fiscal year 2022 to fiscal year 2023.
Figure 26. The District’s recurring spending and expenditures, and how D.C. is balancing its budget
This fiscal picture suggests that the city will have difficulty investing additional funding to support business recovery. If revenue growth falls behind expectations because of a national recession or further unanticipated losses, especially in the value of commercial office buildings, existing programs may have to be cut. Thus, in the next four years, business success will entirely depend on private sector economic activity and growth.
Local policy response
Due to the District’s quick response to pandemic-related challenges, many businesses have survived, and new businesses have emerged. In the past four years, the local policy response to the pandemic’s challenges has been centered around distributing cash to small businesses in the form of either grants or loans. However, in the coming months and years, D.C.’s businesses will continue to face new challenges as the city settles into a post-pandemic normal, and they will have to face these challenges while in a period of fiscal distress. Still, the city’s leaders can support the success of local businesses in several key ways that focus on boosting demand and retaining existing businesses:
Support a diverse and mixed-use community in downtown D.C.
Businesses in downtown D.C. are highly dependent on office workers. This means any disruption to office demand will deeply impact the business and real estate markets in office-heavy areas.
Even three years after the onset of the pandemic, office demand is sitting at half of pre-pandemic levels and many office workers continue to spend more time outside of the city. The success of businesses downtown will depend on boosting foot traffic and demand downtown despite the loss of workers. Policies and initiatives that support a greater mix of uses and amenities downtown will boost the resilience of local businesses that once supported office workers. For example, converting office space to residential multifamily buildings, where feasible, will boost the number of people spending time downtown outside of working hours, which will help make up for some of the lost daytime activity.
Ensure D.C. remains an attractive place to live.
Ensuring downtown and other parts of the city remain attractive places to live is increasingly important. As workers spend more time away from the city, residents’ economic activity becomes more valuable to local businesses. Creating a safe and attractive environment will encourage residents to stay in D.C. for shopping, dining, and entertainment, thereby boosting the success of local businesses.
As the link between where people live and where they work continues to weaken, the city should also consider incentives for large employers located in D.C. to employ D.C. residents. Residents not only support local businesses with their economic activity, but also provide a strong talent pipeline for local businesses looking to hire. Importantly, hiring D.C. residents, retaining residents, and attracting new residents all contribute to boosting the city’s revenue though income and sales taxes.
Focus on business retention by creating a business-friendly environment.
As economic activity shifts to the suburbs, it will be increasingly important to focus on business retention. Building a more mixed-use downtown and increasing foot traffic in the city are long-term solutions. In the meantime, D.C. needs to ensure businesses do not follow the increasing economic activity elsewhere in the region. One simple way to retain businesses is to create a more efficient regulatory environment. This will be particularly important for businesses that need to adapt to new conditions by offering new services and applying for new or renewing their licenses.
Encouraging a process that allows businesses to efficiently and easily adapt or form will remove at least one barrier that D.C. businesses face. Another strategy could be supporting policies that offer pathways for small businesses to own their space. This would remove one source of financial stress in times when demand is suppressed, allowing many businesses to become more resilient to periods of economic stress.
Endnotes
- Aksoy, et al. (2023). Time saving when working from home. NBER Working Paper No. 30866. Available at https://data.sba.gov/dataset/ppp-foia.
- Kastle Data Systems. Note: Occupancy is the share of unique card holders that swipe into their office building. The average cardholder activity between February 3-13, 2020, is used as the baseline.
- Kastle Data Systems. Note: Occupancy is the share of unique card holders that swipe into their office building. The average cardholder activity between February 3-13, 2020, is used as the baseline.
- Dingel, Jonathan and Neiman, Brent (2020). “How Many Jobs Can be Done at Home?” Becker Friedman Institute at the University of Chicago.
- Google LLC “COVID-19 Community Mobility Reports.” Accessed June 14, 2023.
- U.S. Census Bureau LEHD Origin-Destination Employment Statistics Data (2019). Accessed on March 10, 2022 at https://lehd.ces.census.gov/data/#lodes. LODES 7.5. Note: To avoid double counting workers, this calculation only includes primary jobs. Additionally, the D.C. Office of the Chief Financial Officer estimates that approximately 61.7 percent of wages earned in D.C. were earned by non-residents in FY 2021.
- Job activity is a term coined by the D.C. Policy Center in 2023. Traditionally, jobs are counted based on where an employer is located. This is how the U.S. Bureau of Labor Statistics tracks jobs. In contrast, job activity measures where workers are actually working using the U.S. Census Bureau’s American Community Survey (ACS) data on worker-reported place of work by occupation. This measure is increasingly important to fully understand labor market dynamics as office workers continue to work from home. For more information see: McConnell, Bailey and Sayin, Yesim (2023). “Worker sprawl in the Washington metropolitan area: Is D.C. still the region’s job hub?” D.C. Policy Center.
- Althoff, Lukas et al. (2022). “The Geography of Remote Work.” Regional Science and Urban Economics (Volume 93).
- McConnell, Bailey and Sayin, Yesim (2023). “Worker sprawl in the Washington metropolitan area: Is D.C. still the region’s job hub?” D.C. Policy Center.
- CoStar, accessed July 31, 2023.
- Gupta, Arpit et al. (2023). Work From Home and the Office Real Estate Apocalypse. Available at SSRN.
- Raichura, Kiran & Cornes, Charlie (2023). Clear split between weak west and strong south. Capital Economics.
- Avison Young (2023). Washington DC Office Market Report, Q2 2023.
- U.S. Bureau of Labor Statistics, Business Formation Statistics. Accessed June 23, 2023.
- U.S. Bureau of Labor Statistics, Business Employment Dynamics. Accessed June 20, 2023.
- U.S. Census Quarterly Census of Employment and Wages. Accessed June 20, 2023.
- U.S. Bureau of Labor Statistics, Business Employment Dynamics. Accessed June 20, 2023.
- McConnell, Bailey (2023). “5 things we know about regional business migration trends.” D.C. Policy Center.
- U.S. Bureau of Labor Statistics, Local Area Unemployment Statistics (LAUS). Accessed on July 27, 2020.
- U.S. Census Bureau Household Pulse Surveys Phase 2. Available at https://www.census.gov/programs-surveys/household-pulse-survey/data.html.
- U.S. Bureau of Labor Statistics, Current Employment Statistics (CES), State and Metro Area Employment, Hours, & Earnings, accessed on July 27, 2020.
- U.S. Bureau of Labor Statistics, Job Opening and Labor Turnover Survey. Note: All values are calculated using the average across each time period (ex. average job openings in the 6-month time period between October and March 2023).
- U.S. Census Bureau Business Trends and Outlook Survey. Note: The Business Trends and Outlook Survey began in mid-July 2022. It replaced the Small Business Pulse Survey, expanding the scope to include large single-location employer businesses (those with 500 or more employees). Data are collected bi-weekly.
- U.S. Census Bureau Business Trends and Outlook Survey.
- U.S. Census Bureau Business Trends and Outlook Survey.
- Data from U.S. Small Business Administration. Available at https://data.sba.gov/dataset/ppp-foia.
- An additional $27 million of targeted EIDL advances were approved in 2022. Data from COVIDmoneytracker.org.
- Data from the U.S. Small Business Administration. Available at https://data.sba.gov/dataset/rrf-foia/resource/611f26df-0de0-427d-adb1-3bb91c8e8846.
- Data from the U.S. Small Business Administration. Available at https://data.sba.gov/dataset/svog.
- D.C. Office of the Chief Financial Officer, Unified Economic Development Reports for various fiscal years. Available at https://cfo.dc.gov/page/unified-economic-development-reports.
- Fiscal Year 2024 Budget Book, Agency Budget Chapters, Part 1. Available at https://cfo.dc.gov/page/annual-operating-budget-and-capital-plan.