

The persistence of widespread remote work is challenging the conventional understanding and analysis of jobs and economic activity. Because many workers can work remotely, standard jobs data, by employer location, can mask the true extent of labor market recovery and regional shifts in talent. This is particularly challenging for employment centers, with economies that depend heavily on commuter activity and office demand, like the District of Columbia. A better understanding of how the District’s role as a job center in the region has shifted in recent years requires rethinking how we measure jobs and employment.
To address the gaps in jobs data, this report measures job activity—the spread of regional jobs based on where workers are actually working—and how job activity has shifted across the region since the onset of the pandemic. This exercise is an essential precursor to crafting a policy response to new trends.
These data show that the increased mobility of workers and businesses is creating a more competitive environment between jurisdictions. A continued loss of jobs and workers could erode the city’s competitive advantages relative to the region, and D.C. is at risk of losing its share of regional economic growth—unless the city enhances other advantages that justify D.C.’s higher costs.
This report is a publication of the D.C. Policy Center’s Alice M. Rivlin Initiative for Economic Policy & Competitiveness, which provides an in-depth and objective look at the factors that influence the District of Columbia’s attractiveness and competitive position in the region and the nation.
We wish to thank Quadrangle Development Corporation, Ruben Companies, Tishman Speyer, and Fort Lincoln Realty Company for their support of the Rivlin Initiative’s work.
Quick links
Event: Telework’s impact on the D.C. labor market
Join us via Zoom on Wednesday, May 24 at 2:00 PM for a report briefing, expert panel discussion, and audience Q&A on what this report’s findings mean for the District’s economic future.
More information & free registration »

Executive summary
The COVID-19 pandemic has changed labor market dynamics across the United States, especially in large metropolitan areas. Because of widespread remote work, business and workers are increasingly mobile, making it possible for a worker in the D.C. region to live elsewhere or vice versa.1 This new dynamic presents new challenges and risks to metropolitan areas like the D.C. region.
In an era of remote work, traditional job data can disguise the true extent of labor market recovery and geographic shifts in talent.
Data from the U.S. Bureau of Labor Statistics (BLS) are a widely-used to assess labor market recovery in the United States. BLS data are employer-based—that is, gathered from surveys sent to establishments. Thus, BLS data show jobs based on where businesses are located.
Accordingly, with the rise of remote work, a city can lose workers without losing jobs as counted by BLS.2 For example, previous D.C. Policy Center research suggests that since the beginning of the pandemic (between February 2020 and July 2022), the Washington metropolitan area’s resident employment3 level has declined at a faster rate than total employment,4 meaning non-residents are holding more of the region’s jobs than before the pandemic began.5
This has likewise been the case in many large, high-cost metropolitan areas, such as those surrounding New York City, Los Angeles, Chicago, and San Diego. Meanwhile, lower-cost, smaller metro areas are experiencing rapid job growth along with in-migration of new workers.6 Together, these findings suggest that as remote work remains common among office workers, residents may be keeping their jobs but moving to new, often lower-cost, areas.
This trend is limiting the usefulness of traditional metrics. For example, the Washington metropolitan area’s near-record low unemployment rate—3.1 percent in November 2022. While a lower unemployment rate is generally a desirable outcome, how the region reached that outcome is not necessarily entirely a success story. Instead, the region has a shrinking labor force, and rather than creating jobs for those who are looking for one, the city (and the region) have lost jobs.7
To better understand recent labor market shifts, this report tracks regional job activity.
If office workers switch to part-time remote work (or fully remote work) arrangements, BLS data only captures where these workers are when they are in-office, thus offering an incomplete assessment of the economy and workforce. A better understanding of how the District’s role as a job center in the region has shifted in recent years is an essential precursor to crafting a policy response to new trends.
This report measures job activity—a term we coined for this report to capture the spread of regional jobs based on where workers are actually working—by using the U.S. Census Bureau’s American Community Survey (ACS) data on worker-reported place of work by occupation.
If everyone worked in-office, the ACS data would theoretically match the BLS employer survey-based job data. Instead, as remote work remains popular, these data are measuring where people are actually working.
Job activity, captured this way, is an increasingly important measure. It offers a worker-oriented perspective on how the regional labor market has changed since the onset of the pandemic, which is necessary to avoid an incomplete assessment of the economy and workforce.
The spread of job activity in the region offers a troubling perspective: D.C. is no longer benefiting from the shared economic strengths of the region.
As recovery from the pandemic continues, it is possible that out-migration from high-cost cities like D.C. will slow.8 But, there is also a risk that labor market dynamics will permanently shift, to the District’s detriment.
The Washington metropolitan region has been particularly competitive in five occupation groups:
- Business and financial occupations,
- Management occupations,
- Computer and math occupations,
- Legal occupations, and
- Life, physical, and social science occupations.
These occupations are important to the regional economy, as they play a key role in attracting both workers and employers. But, D.C.’s role as the region’s job hub is waning, and as of 2021, shifts in job activity show that the city is no longer benefiting from these shared occupational strengths of the region.
During the pandemic, the share of regional workers who reported their job location as D.C. began to decline—dropping from 30 percent to 19 percent in the business and finance occupation group; 28 percent to 20 percent in management; 23 to 13 percent in computer and math; 54 to 37 percent in legal; and 34 to 24 percent in life, physical, and social sciences.
Moreover, D.C. does not have a strong competitive advantage in these occupation groups relative to the rest of the region—even before the pandemic. In fact, the city emerged from the pandemic with a weaker representation of job activity in computer and math relative other jurisdictions in the Washington metropolitan area.
But, there is some good news. D.C. has retained its unique specialization in legal occupations and life, physical and social science occupations.
Still, while D.C. still holds many of the region’s jobs due to its density, data show that regardless of where the region’s employers are located, job activity in the region’s strongest occupations is declining in D.C. and growing in the rest of the metropolitan area.
Ultimately, the increased mobility of workers and businesses is creating a more competitive environment between jurisdictions. A continued loss of jobs, workers, and job activity could erode the city’s competitive advantages relative to the region, and D.C. is at risk of losing its share of regional economic growth—unless the city enhances other advantages that justify D.C.’s higher costs.
Understanding how the District’s role as a job center in the region (and country) has shifted in recent years will allow the city to face shifting inter-regional dynamics by refocusing workforce and economic policy to match the realities of the region.
Challenges of occupation-based jobs data
In this report, we look at jobs by occupation. Occupation data (rather than industry data) offer a more workforce-oriented perspective to the region’s economic base. This lens more clearly outlines how telework might be influencing workforce dynamics.
However, data on jobs by occupation have some limitations to note:
Occupational Employment and Wage Statistics. The U.S. Bureau of Labor Statistics publishes Occupational Employment and Wage Statistics every May, producing employment and wage estimates by occupation at the national, state, and metropolitan area level. However, these data cannot be compared year to year due to variances in methodology. We use these data to offer a snapshot of current occupation clusters in the region, but do not use it to identify trends. These data are also establishment-based, meaning they track jobs based on where businesses are located.
To identify trends, we use resident-based Census data. But, this has its own set of challenges:
ACS PUMS data. The U.S. Census Bureau’s American Community Survey (ACS) Public Use Microdata Sample (PUMS) provides estimates on population, housing, and household characteristics for geographic areas. We use the ‘place of work’ variable, which identifies a person’s place of work by PUMA and state, to analyze job activity by occupation throughout the D.C. region.
Due to the nature of microdata, this method often results in high margins of error. We have included the error terms for all calculations throughout the report as needed.
PUMS data also rely on the survey-taker understanding the question as intended, which may be difficult for many remote workers. The question on ‘place of work’ is written as: “At what location did this person work LAST WEEK? If this person worked at more than one location, print where he or she worked most last week.”9
Given the continued popularity of remote work in the D.C. region,10 the phrasing of this question implies that the data likely capture many workers’ home addresses, particularly for workers in office-based occupations. This offers a contrast to BLS data, which track jobs based on where businesses are located.
1. Understanding the region’s economic base
Labor markets operate beyond administrative borders. A worker can live outside of the borders of the District of Columbia, but still benefit from the city’s density of jobs.
Likewise, an establishment can locate anywhere in the Washington metropolitan area and still benefit from the regional workforce. For example, in 2019, an estimated 70 percent of the District’s workers lived outside the city, indicating that prior to the pandemic, the city’s jobs attracted commuters from the entire metropolitan area (or even beyond).11
This section of the report establishes what type of jobs, by occupation, are particularly important the region as a cohesive economy.
What is a location quotient (LQ)?
Location quotient (LQ) is one measure used identify regional economic strengths and weaknesses. It compares the concentration of an occupation in a region to a larger geographic area.12
- If an LQ > 1, then an area has proportionally more workers employed in that occupation than the larger comparison area.
- If an LQ = 1, then an area has the same share of workers employed in that occupation as the larger comparison area.
- If an LQ < 1, then an area has a weaker representation of workers in that occupation group than the larger comparison area.
How do we define a competitive advantage?
A region is considered more specialized in a particular occupation if the LQ is greater than 1. In this report, we assume that if an LQ is particularly high (> 1.25), then a region has a local competitive advantage for that occupation group.
What is an economic base?
Occupations with high LQs are important because they make the local economy unique. In particular, occupations that have both a high LQ and high job numbers typically form a region’s economic base, meaning these jobs greatly impact a region by increasing economic activity and stimulating the creation complimentary or dependent jobs.
Of the region’s 5 largest occupation groups, the Washington metropolitan area has a national competitive edge in three.
As of May 2021, the Washington metropolitan area’s largest occupation groups were:
- Business and financial occupations (12 percent of regional jobs),
- Office and administrative support occupations (11 percent),
- Management occupations (9 percent),
- Computer and math occupations (8 percent),
- Sales and related occupations (8 percent).
Of these five largest occupation groups (and even of the region’s top 10 largest occupation groups), the Washington metropolitan area is uniquely competitive across the nation only in three: Business and financial occupations, management occupations, and computer and math occupations. Combined, these three groups account for 32 percent of regional jobs.13 These jobs are valuable to the region because they play a key role in attracting both workers and employers.
Figure 1. Occupational clusters in the D.C. metropolitan area compared to other metropolitan areas, ordered from the Washington metropolitan area’s largest to smallest occupation groups
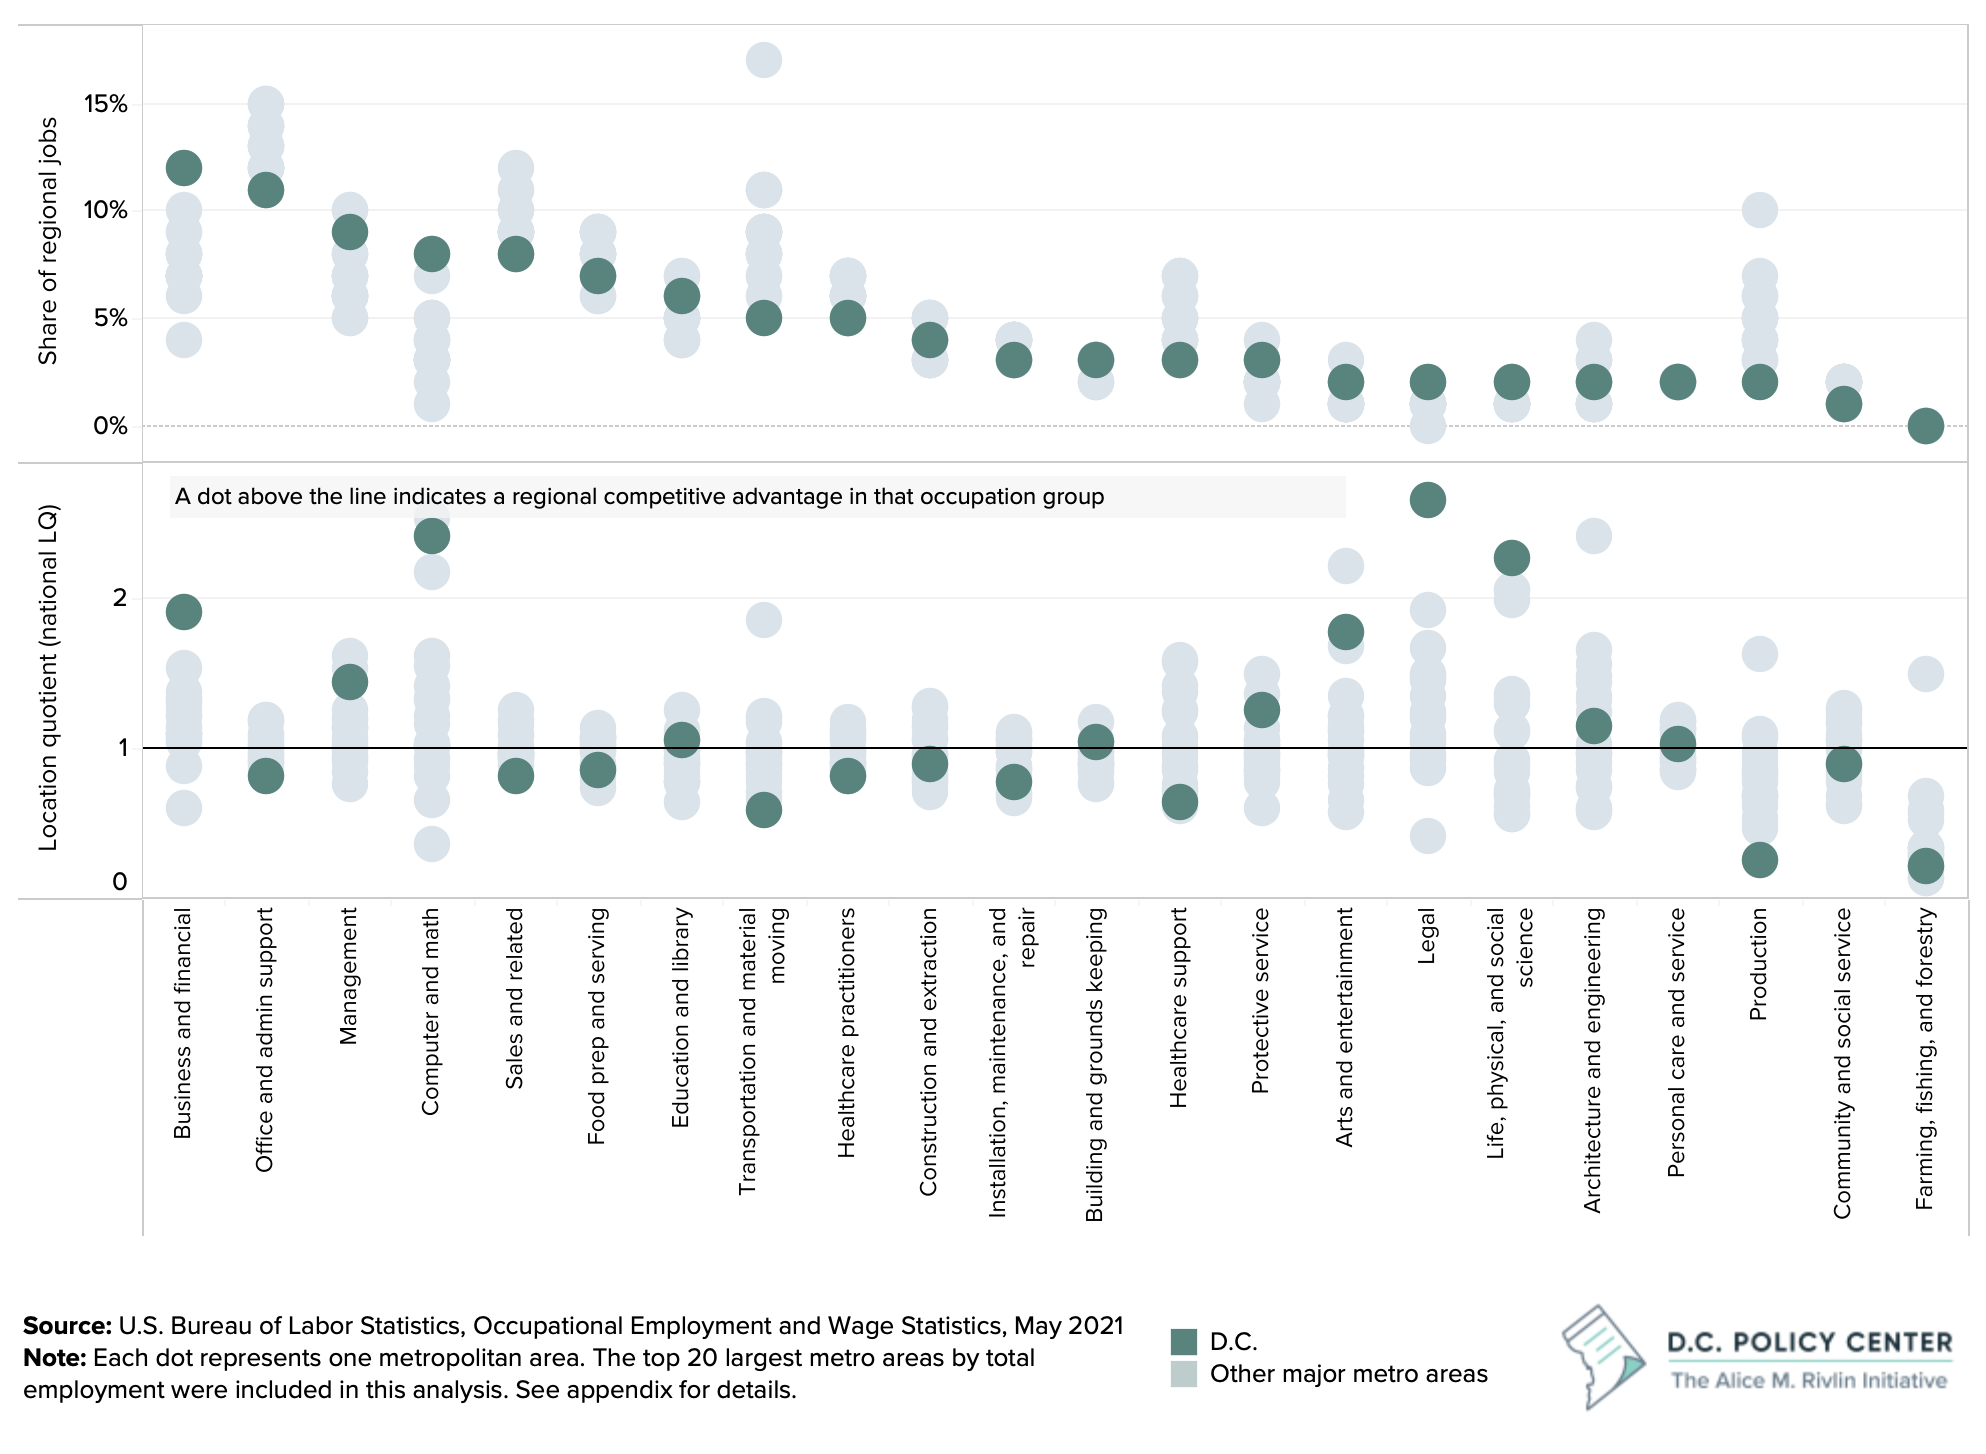
It turns out, many other metropolitan areas also have a national competitive edge in these three occupations. If a worker is interested in business and financial, management, or computer and math jobs, most metropolitan areas used in this analysis14 offer a higher concentration of opportunities than the country at-large.
But, even among high-opportunity metropolitan areas for these three occupations, the D.C. region appears to stand out, likely due to the presence of the federal government.
Figure 2. Summary of the Washington metropolitan area’s occupation clusters: large and competitive occupation groups
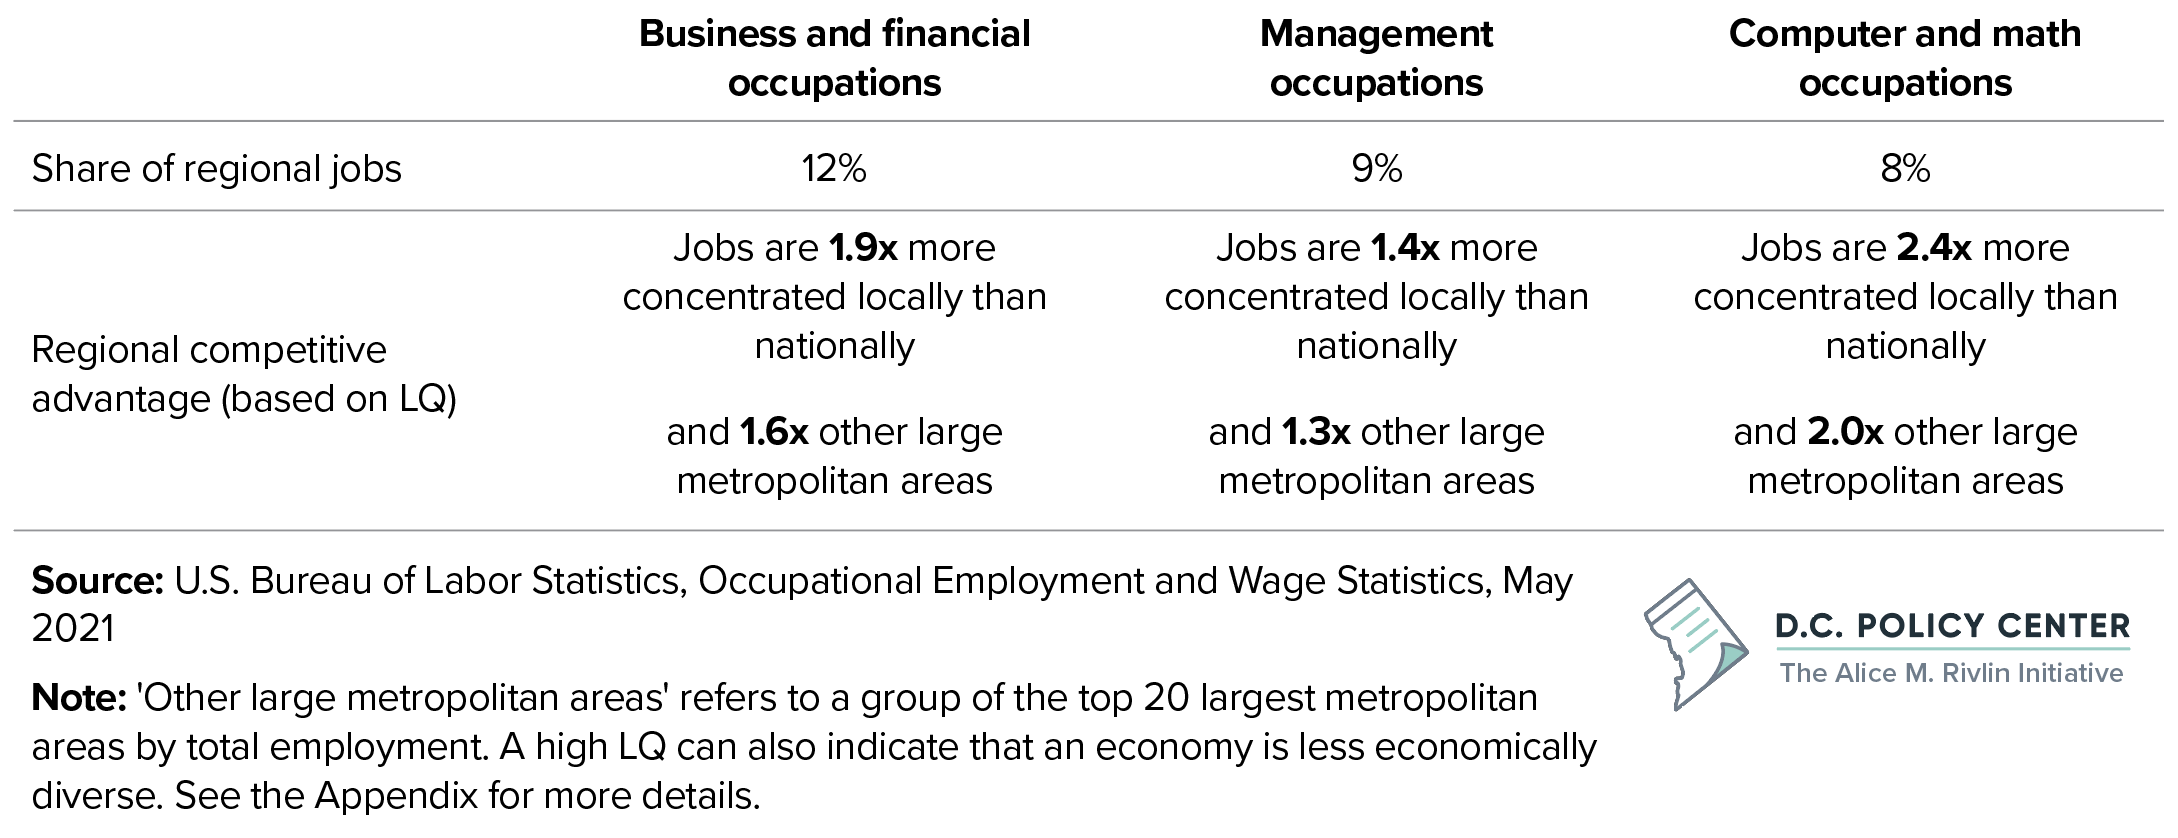
The presence of the federal government has attracted many businesses to the region and created complementary jobs, such as government contractor work, non-profits, advocacy groups, and lobbying firms. As a result, the Washington metropolitan area is particularly specialized in jobs that are either directly related to the government or adjacent to government, such as budget analysts, public relations managers, and fundraising managers.
And, within the computer and math occupation group, while San Francisco and Seattle metro areas have a larger presence for software developers or programmers, the Washington metropolitan area leads in jobs for statisticians, mathematicians, information security analysts, database architects, and operations research analysts. Many of the region’s jobs in computer and math support the work of the federal government, but the Dulles Technology Corridor,15 which is home to many defense, data centers, and technology companies, and the addition of Amazon’s second headquarters, also contribute to the Washington metropolitan area’s strength in this field.
Our region is also highly competitive in two smaller occupation groups.
While business and financial, management, and computer and math occupations largely form the region’s economic base, the Washington metropolitan area is also highly competitive in: legal occupations, and life, physical, and social science occupations.
Business and financial occupations, management occupations, and computer and math occupations stand out in the region due to their high location quotient (LQ) and high job numbers, implying that these jobs form a large part of the region’s economic base. However, though smaller in scale, legal jobs, and life, physical, and social science jobs are also important to the region.
Figure 3. Summary of the Washington metropolitan area’s occupation clusters: small and competitive occupation groups
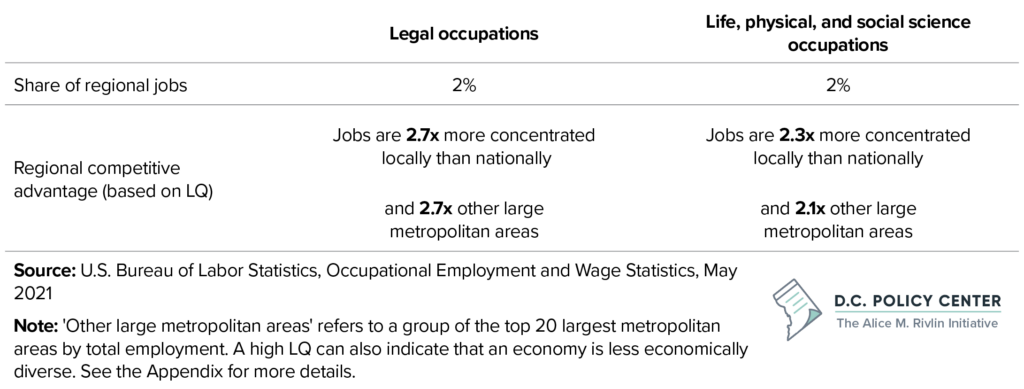
Compared to the country, and even among other metropolitan areas, the D.C. region stands out as particularly competitive in the legal occupations and life, physical, and social science occupations.
Workers in both of these occupation groups, such as attorneys, social scientists, and political scientists, support federal government agencies. The region’s strength in life, physical, and social sciences is also likely driven by the biotech cluster in Maryland’s I-270 Corridor.16
While these occupation groups have a relatively small impact on the economy, the region’s particularly high specialization in these fields is noteworthy.17
2. Job activity in the Washington metropolitan area
Any jurisdiction can draw from the strengths of its larger region. But, each individual jurisdiction’s policies, investments, and actions can push out or pull in businesses, workers, and residents.
So, while labor markets typically operate at a regional level, it is still important to understand the District’s role in the region’s success, and whether that role has evolved since the pandemic began.
What is job activity?
Typically, jobs are counted based on where an employer is located. For example, an establishment in D.C. that employs 10 workers contributes 10 jobs to D.C.’s labor market, regardless of where those workers live.
This report tracks job activity—a measure of where workers are actually working. To do so, we use the U.S. Census Bureau’s American Community Survey (ACS) data on worker-reported place of work by occupation.
Why is measuring job activity important?
Under D.C.’s reciprocal agreement with Maryland and Virginia, income tax collections are only impacted by the movement of jobs based on where employers and businesses are located. However, the movement of workers (regardless of employer location) has spillover effects across the economy—in the long-term, service-oriented jobs will follow economic activity and businesses may no longer be able to justify the costs of being in D.C. if their workers are elsewhere, further depressing office demand.
During the pandemic, the share of region’s workforce who reported their job location as D.C. declined.
As the region’s central city, the District has been a large contributor to the region’s job growth.18 Due to the density of jobs, residents, and establishments in the city, D.C. has a natural advantage within the region when it comes to attracting jobs and workers. However, not only is D.C. surrounded by attractive suburban jurisdictions that also have large tax bases, strong government services, a high quality of life, and good schools, but D.C. also has constraints on growth within its already relatively small footprint. This puts the city at risk of losing businesses, residents, and workers, particularly in a time where workers do not necessarily need to live near their jobs, and when businesses are less tied to a physical location.
How does job activity compare to traditional job data?
The data on recovery of jobs in the Washington metropolitan area compared to D.C. vary by source. In this report, we focus on data from the U.S. Census Bureau’s American Community Survey (ACS) Public Use Microdata Sample (PUMS). This allows us to maintain the breakdown in job activity by occupation and incorporate the impact of telework, but these data also have higher error terms and are dependent on resident response.
As a point of comparison, the Quarterly Census of Employment and Wages from U.S. Bureau of Labor Statistics (BLS) indicates that in 2021, D.C. had 10 percent fewer jobs compared to 2019 and the rest of the metropolitan area (excluding D.C.) had 5 percent fewer jobs. The BLS data capture jobs from the perspective of establishments, so the greater loss of job activity (based on worker reported place of work) in the ACS data likely stems from remote workers.
In nearly every occupation group, D.C.’s share of regional job activity was stable19 in the years immediately before the pandemic (2017—2019). However, data from 2021 show that following the onset of the pandemic, there was a sharp decline in D.C.’s job activity, including in the region’s strongest and largest occupation groups.20
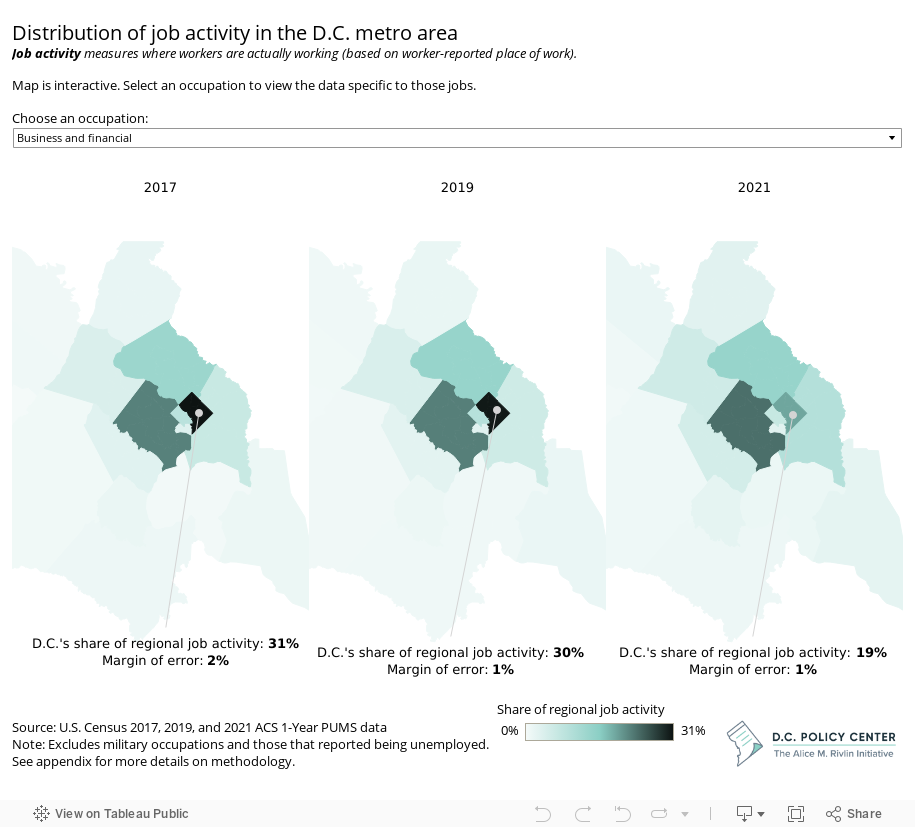
Business and financial occupations
D.C.’s share of the region’s business and financial job activity (based on worker-reported place of work) dropped from about 30 percent in 201921 to 19 percent in 2021.22 As a result, whereas prior to the pandemic, D.C. attracted more workers in this occupation group than any other jurisdiction in the region, Fairfax County is now the metropolitan area’s leader, with 23 percent23 of regional business and financial job activity.
Management occupations
The shift in management job activity follows a similar story. Prior to the pandemic, D.C. held about 28 percent24 of the region’s management job activity, but in 2021, this share dropped to 20 percent.25 Pre-pandemic, D.C. held more job activity in this field than any other jurisdiction in the region, but now, D.C.’s share is about equal to Fairfax County’s.26
Computer and math occupations
Prior to the pandemic, there were more people in computer and math jobs working in Fairfax County than any other jurisdiction in the region,27 with D.C. coming in second. However, D.C.’s share of job activity sharply dropped from 23 percent28 to 13 percent29 between 2019 and 2021. Notably, while Fairfax County remains the region’s leader, Montgomery County’s share of job activity in this field increased enough to become about equal to D.C.’s.30
Legal occupations
Prior to the pandemic, over half of those in the region’s legal jobs worked in D.C. In 2021, this share dropped to 37 percent,31 though the city remains the biggest regional player in this occupation group.
Life, physical, and social sciences
And, finally, D.C.’s share of the region’s life, physical, and social science job activity dropped from about 34 percent32 in 2019 to 24 percent33 in 2021, making the city’s share about equal to Montgomery County.34
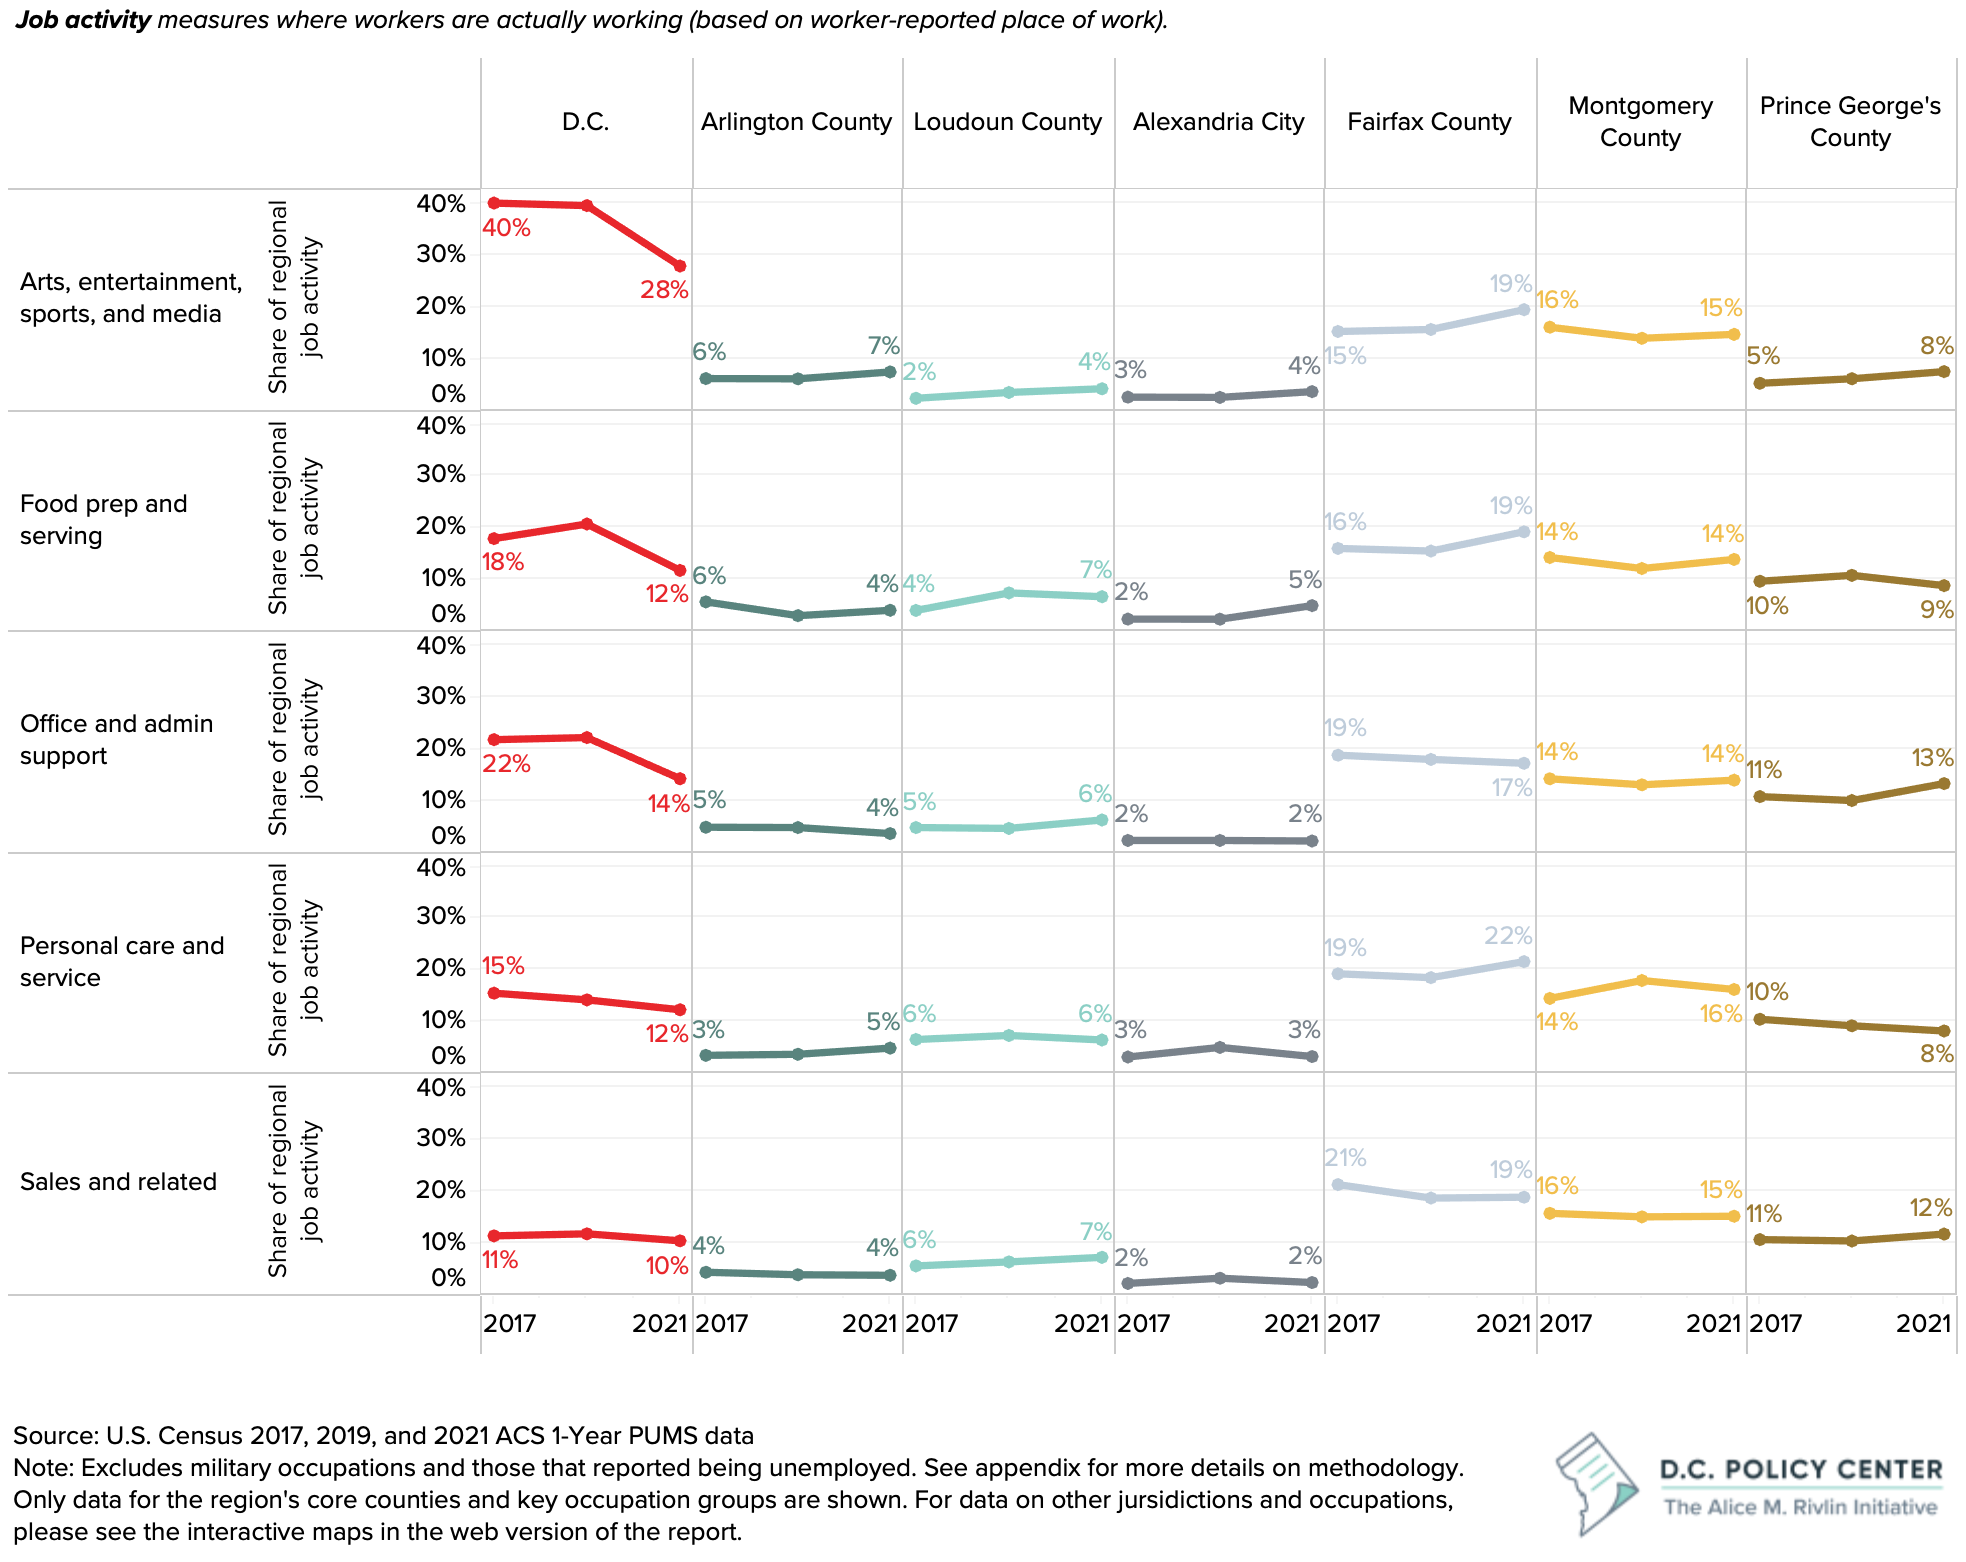
Figure 4. Distribution of job activity in the Washington metropolitan area (based on worker-reported place of work)
The decline of job activity in D.C. is not limited to remote-eligible jobs. Service sector activity is also declining.
The region’s most competitive occupation groups are primarily office-based and likely remote-eligible jobs. It is possible that workers are keeping their jobs in D.C. and reporting their place of work as elsewhere due to remote work. Given the wording of the Census question on ‘place of work,’35 this is very likely, but it is impossible to know how each survey-taker interprets the questions.
But even service-based occupations, which are less likely to be remote-eligible, are shifting away from the District. This shift is particularly sharp for food prep and serving-related jobs and arts, entertainment, sports, and media jobs. D.C.’s share of regional job activity in the food prep and serving occupation group dropped from 21 percent36 in 2019 to 12 percent37 in 2021, and D.C.’s share of regional arts job activity dropped from 39 percent38 to 28 percent.39
Figure 5. Distribution of service-sector job activity in the Washington metropolitan area
Researchers have found that consumer service workers depend on the local spending of workers in office-based jobs. Accordingly, big cities face two threats: 1) the loss of increasingly mobile high-skill works and 2) the loss of local consumer workers.40
Even if employers remain concentrated in D.C., if workers shift elsewhere, in the long-term, businesses are likely to follow. And, challenges specific to D.C., such as lack of space for businesses looking to grow or increasing rents, can expedite this transition. So, while D.C. remains a relatively large player within the region’s job market, the shift in job activity towards neighboring jurisdictions is still a risk to the city.
As job activity increasingly shifts outside D.C., the city is not benefiting from shared regional occupational strengths.
Between 2017 and 2019, job activity in Washington metropolitan area as a whole grew (based on worker-reported place of work), meaning the labor market grew. But, across the different occupation groups, there was no meaningful difference between D.C.’s percent change in job activity compared to the rest of the metropolitan area (due to the error terms). This is good news, as it indicates that the District’s growth did not lag the rest of the region’s in a statistically meaningful way.
But, between 2019 and 2021, there was a net loss of workers based in the District. Meanwhile, the rest of the metropolitan area thrived.
Figure 6. Percent change in job activity in D.C. compared to the rest of the Washington metropolitan area
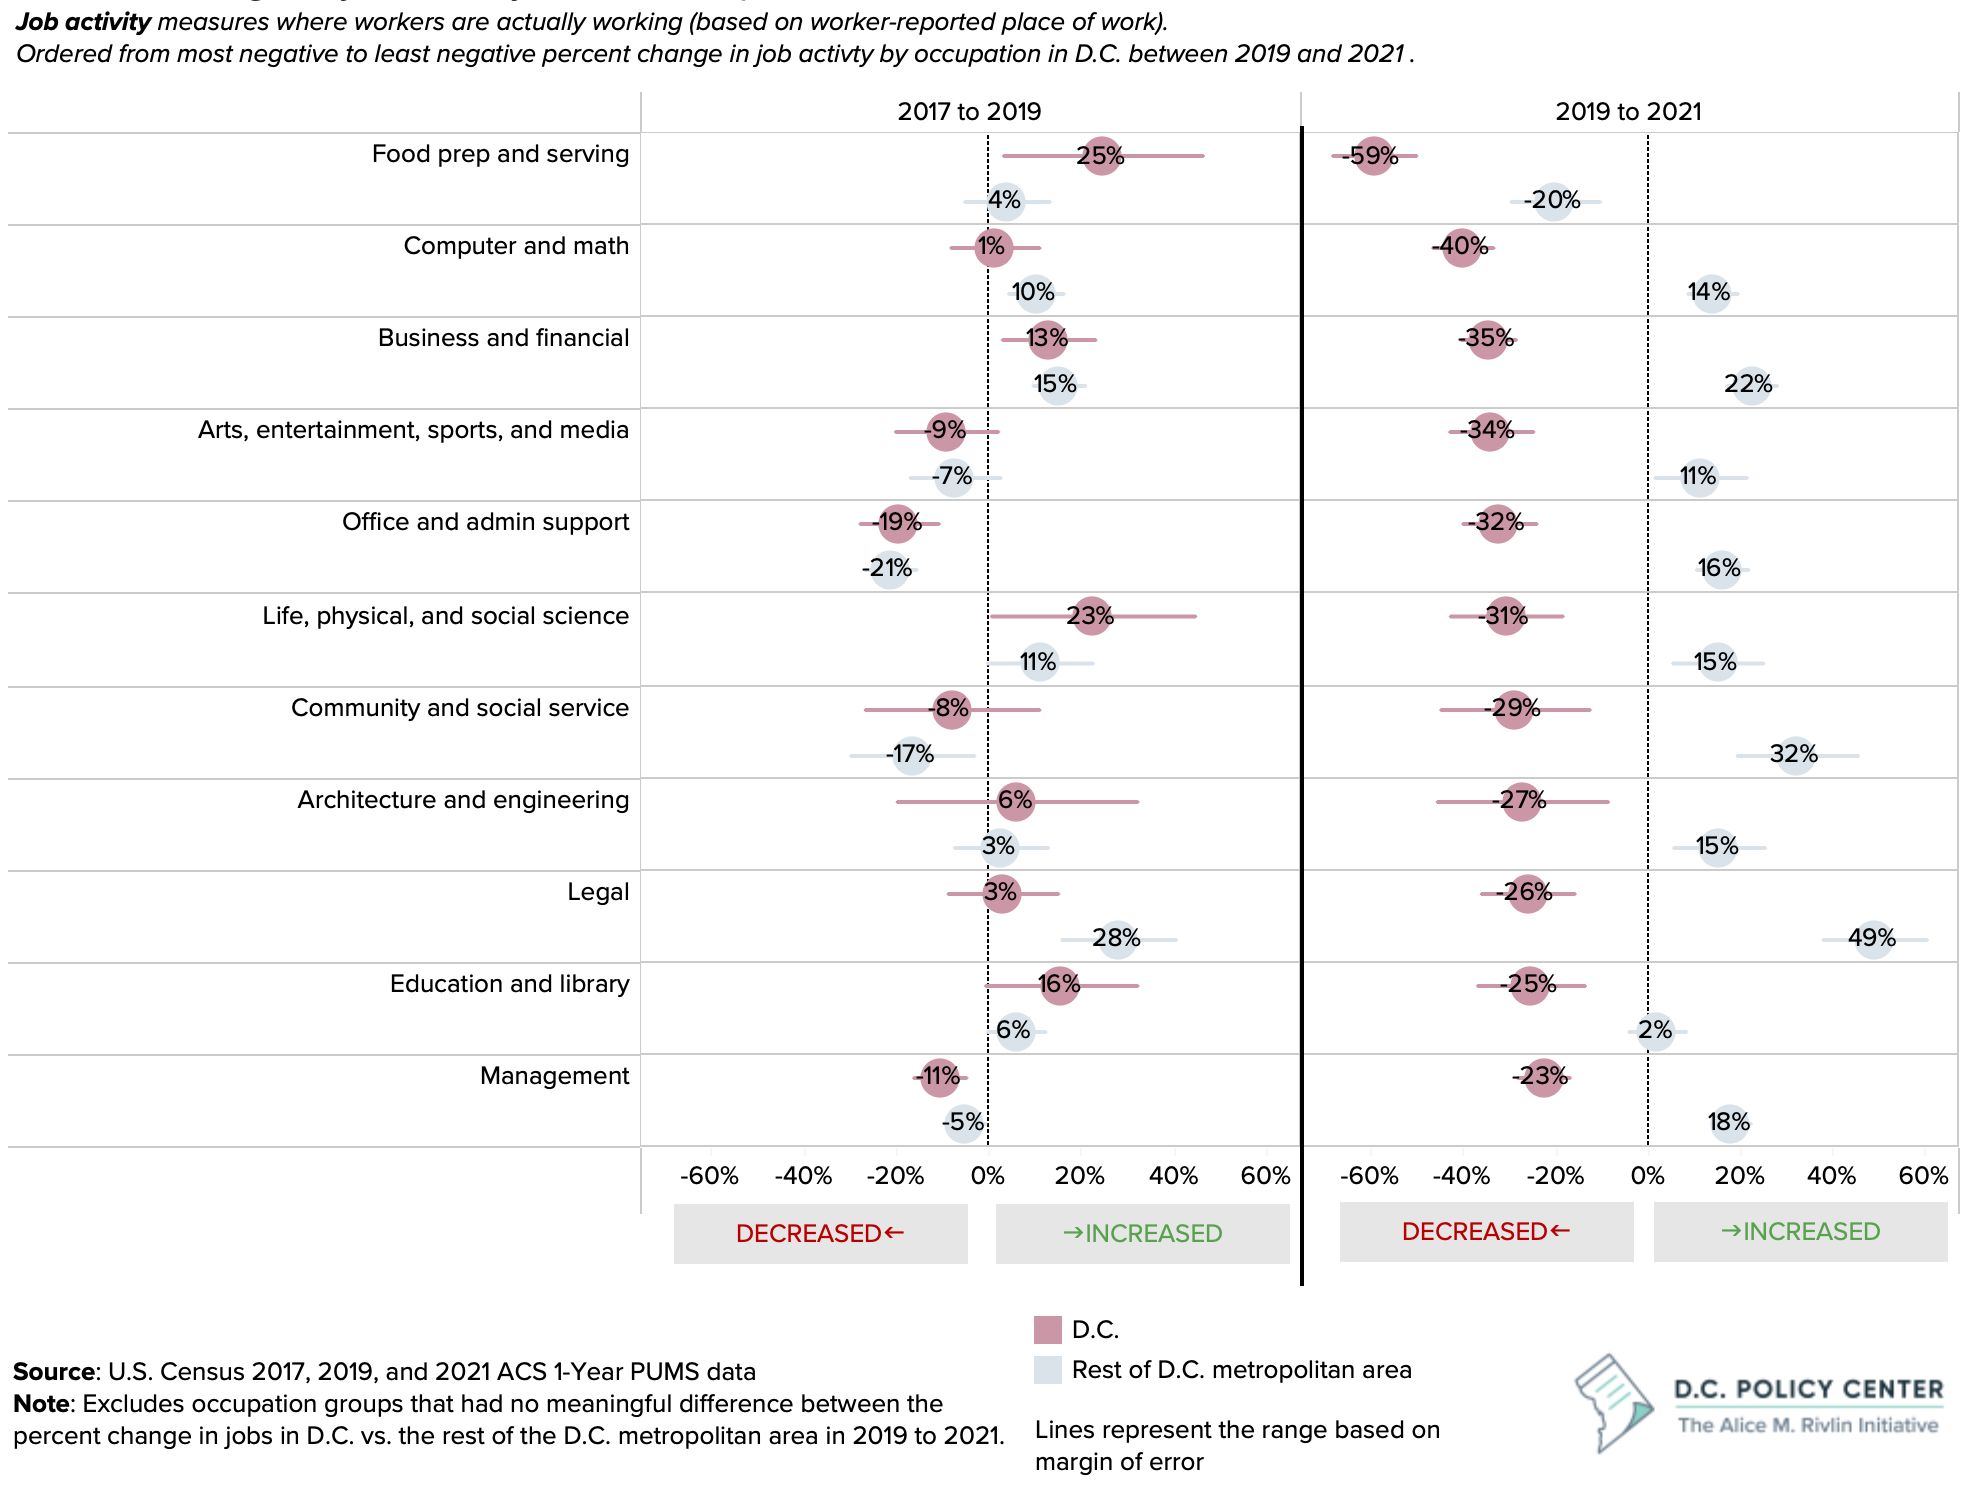
This difference is particularly stark in the computer and math, business and financial, and legal occupation groups. D.C. experienced a 40 percent41 drop in computer and math job activity between 2019 and 2021, while the rest of the region experienced a 14 percent42 increase; a 35 percent43 drop in business and financial job activity, while the rest of the region had a 22 percent44 increase; and a 26 percent45 drop in legal job activity while the rest of the region had a 49 percent46 increase.
In the occupations we examined (Figure 6), data indicate that on net, the regional labor market fully recovered from the negative impacts of the pandemic, and some even grew. But, all of this growth in job activity is occurring outside of the District, which points to a threat to D.C.’s labor market.
The declining share of regional job activity in D.C. is not because job activity in those occupations is growing more slowly in D.C. compared to the rest of the Washington metropolitan area, but because job activity in those occupations are declining in D.C. and growing in the rest of the metropolitan area.
In recent years, the sharp decline in workers that are actually working in D.C. is driven by remote work. Again, remote or partially remote workers are likely reporting their place of work as their homes.
But, the greater distribution of jobs throughout the region is not entirely new.
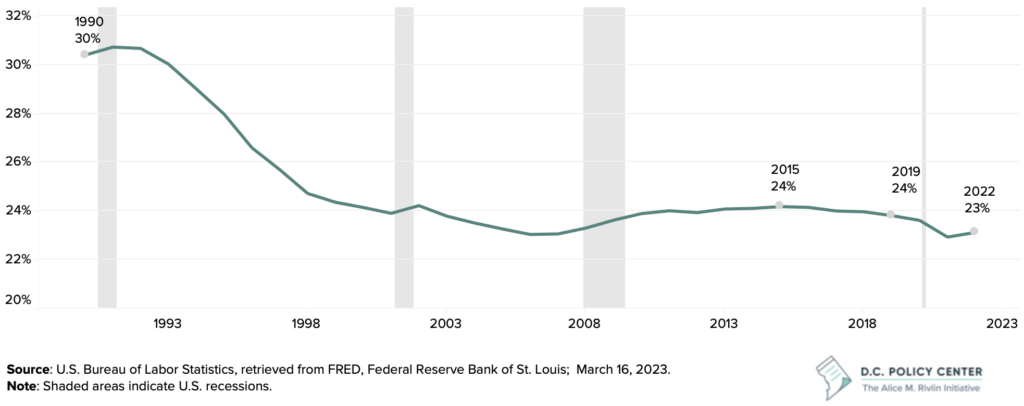
In 1990, nearly 30 percent of jobs in the Washington metropolitan area were based in D.C., but even prior to the pandemic, this share had dropped to below 25 percent. Much of the decline in D.C.’s share of regional jobs occurred prior to the Great Recession of 2008. However, the city’s share was beginning to decline again in the years before the pandemic (2015 to 2019), though very marginally. The COVID-19 pandemic accelerated this existing trend.47
Although between 1990 and 2019, the District gained 110,400 jobs, a 16 percent increase, an increasing share of the Washington metropolitan area’s new jobs were being distributed to the suburbs. As the suburbs became more populated and better at attracting large businesses, jobs followed.48
Figure 7. D.C.’s share of employment in the Washington metropolitan area
Now, the pandemic has created an even more competitive inter-jurisdictional environment, and D.C. is experiencing a decline in job activity. Thus, the District is no longer benefiting from the shared strengths of the regional labor market. And, a continued loss of workers could start to erode the city’s competitive advantages, detailed in the next section.
3. The District of Columbia’s competitive position within the region
Because the District is the region’s central city, and jurisdictions throughout the metropolitan area vary in terms of size and density of jobs, the distribution of job activity alone does not offer a full picture of regional dynamics. Location quotients (LQs), which measure the relative concentration of jobs, add additional context by factoring in the composition of each jurisdiction’s labor market and normalizing size, making comparisons illustrative.
National LQ and regional LQ
To identify the region’s most competitive occupation groups (section 1), LQ was used in a national context, to compare the concentration of an occupation in the Washington metropolitan area to the concentration of that occupation in the entire United States.
To better understand which jurisdictions within the Washington metropolitan area are particularly competitive across different occupations, we will compare the concentration of an occupation’s job activity in each jurisdiction to the concentration of that occupation’s job activity in the entire Washington metropolitan area, calculating a regional LQ.
- If an LQ > 1, then an area has proportionally more job activity in that occupation than the region.
- If an LQ = 1, then an area has the same representation of job activity in that occupation as the region.
- If an LQ < 1, then an area has a weaker representation of job activity in that occupation group than the region.
D.C. does not have a strong competitive edge in any of the region’s largest occupation groups.
Comparing the unique economies of individual jurisdictions in the region offers some positive news for the District: in the last few years, D.C. has retained its competitive positioning relative to the rest of the region in many occupation groups.
However, neighboring jurisdictions are often just as specialized, or in some cases, have a stronger competitive advantage, in the region’s key occupation groups. In fact, of the region’s largest and strongest occupation groups (business and financial, management, and computer and math), D.C. does not have a particularly strong specialization in any.49
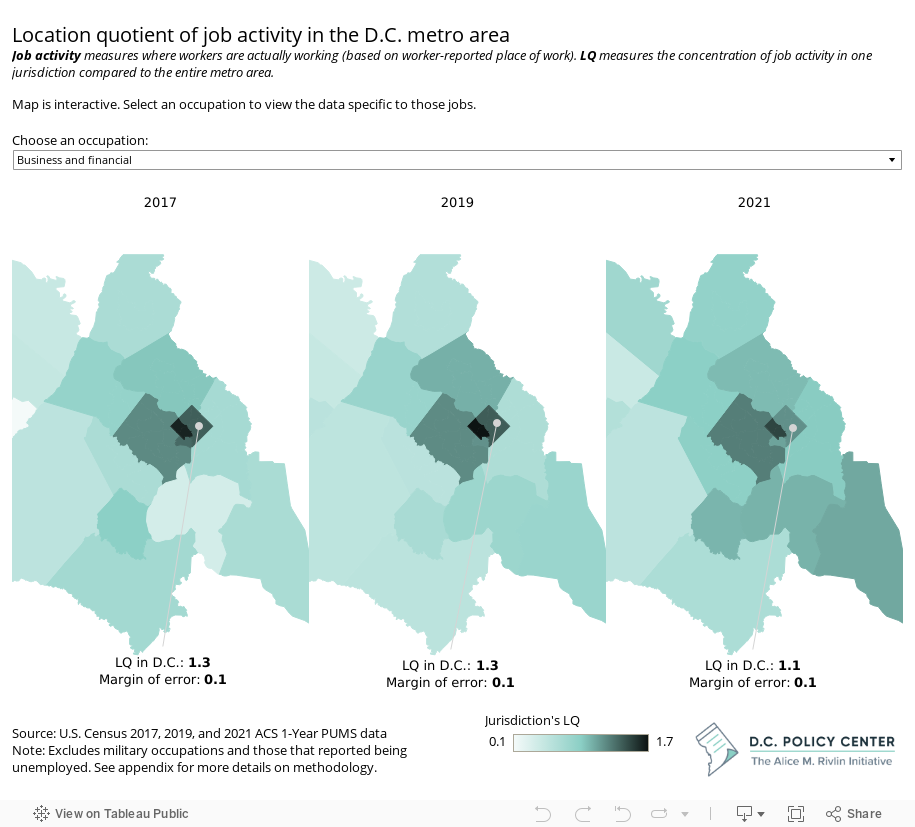
Business and financial occupations
As of 2021, business and financial job activity is 1.1 times50 more concentrated in D.C. than the rest of the region. A location quotient > 1 indicates D.C.’s economy is more dependent on business and financial job activity than the region as a whole, which implies some level of local specialization in that field.
However, many neighboring jurisdictions also have an above-average representation of business and financial job activity, so D.C. does not stand out among its neighbors. Fairfax and Arlington counties may have a slight competitive edge in this sector, but the error terms make it difficult to identify which jurisdiction has the highest location quotient.51
Management occupations
Management job activity in the region follow a pattern similar to business and financial occupations. As of 2021, management job activity is 1.2 times52 more concentrated in D.C. than the region as a whole. Arlington53 and Fairfax54 counties beat out D.C. slightly, at 1.3 times more concentrated than the region. However the error terms make it difficult to conclude which jurisdiction within the region stands out in this field.
Computer and math occupations
Even prior to the pandemic, D.C. did not hold a competitive advantage in computer and math occupations over its neighboring jurisdictions. In 2019, Fairfax County and Arlington had a greater concentration of job activity in this field compared to the rest of the region, with location quotients of 1.655 and 1.556 respectively. As of 2021, Fairfax County and Arlington remain uniquely competitive in this field, and Loudoun County is also becoming increasingly specialized relative to the region.
Meanwhile, D.C.’s concentration of computer and math job activity dipped below the rest of the region. With a location quotient of 0.8, the city has a relatively weak representation of job activity in this field, but this could also indicate an opportunity to develop these occupations in D.C. to meet unmet local demand.57
Figure 8. Location quotient of job activity by occupation in the Washington metropolitan area
Where D.C.’s competitive advantage is strongest: Legal occupations and life, physical, and social sciences.
Though the District does not stand out as particularly specialized in the region’s largest and strongest occupation groups, the city does have a competitive advantage in the legal and life, physical, and social science occupation groups.
Despite the sharp decline in the District’s share of regional legal job activity, D.C. has retained its strong competitive advantage in this field. In 2019, legal job activity was 2.4 times58 more concentrated in D.C. than the rest of the region, and in 2021, D.C. had 2.2 times59 the region’s concentration of legal job activity. This implies that the Washington metropolitan area’s strength in the legal occupation group can largely be attributed to the District. Beyond D.C., Alexandria also has a specialization in this field,60 and Arlington and Montgomery counties have seen an increase in their location quotients between 2017 and 2021.61
D.C. has also retained its competitive positioning relative to the rest of the region in the life, physical, and social science occupation group, with a location quotient of 1.4 in 2021.62 In the years prior to the pandemic, Montgomery County and D.C. had about equal representations of job activity in this field. But, as of 2021, Montgomery County now has the strongest representation of job activity in life, physical, and social science occupations with a location quotient of 2.0.63
Exurban jurisdictions are becoming increasingly dependent on the region’s most competitive and high-wage occupations.
In the years before the pandemic, the region’s job activity in business and financial occupations, management occupations, and computer and math occupations, all of which tend to be high-wage64 and high-skill, were more concentrated within the region’s core counties.65 The exurbs66 were more dependent on job activity in lower-wage occupation groups, such as food prep and serving, buildings and grounds keeping, and personal care and services.67 However, between 2017 and 2021, the exurban jurisdictions became increasingly dependent on the region’s most competitive and high-wage occupations, though only very marginally.68
The location decisions of workers and businesses are complex, but the greater spread of high-wage workers throughout the region is accelerating due to the rise of remote work. As commute times become less important to workers and many remote workers choose to relocate to lower-cost areas, high-wage, office-based job activity will become more evenly distributed throughout the region.
Policy will matter in bringing job activity back to D.C.
While office jobs are typically more concentrated in the core of a region, it is possible for the District to lose its competitive advantage in some occupation groups to neighboring jurisdictions, given the shift of job activity away from the city in recent years. Other factors that workers typically consider when choosing where to locate include housing costs, access to space, and transportation—all of which were considerations for many workers prior to the pandemic as well.
4. Policy implications
The data above offer a workforce-oriented perspective on the region’s economic base. The region’s key occupation groups are vital to the economic health of the region because they bring in residents and workers. But, attracting and retaining businesses that employ workers in those occupations is also important. As D.C.’s neighboring jurisdictions become increasingly competitive, D.C. needs to rethink how it can maintain and grow a diverse economy.
Key findings: D.C.’s strengths and weaknesses in the context of the region
Throughout the pandemic, job activity—a measure of where workers are actually working—has declined. Meanwhile, the rest of the region has seen in uptick in workers based on worker-reported place of work.
Most notably, this is occurring in the region’s largest and most competitive occupation groups: business and finance occupations, management occupations, and computer and math occupations.
- In business and finance occupations and in management occupations, not only is D.C.’s share of regional job activity declining, but D.C. also has no unique competitive advantage in these fields relative to the rest of the region.
- In computer and math occupations, D.C.’s share of regional job activity is declining, and D.C. has a weaker representation of job activity in this field compared to the rest of the region.
- D.C. is primarily competing with Northern Virginia jurisdictions in these three occupation groups. With the addition of Amazon’s second headquarters, the Dulles Technology Corridor, and proximity to the federal government, these occupations will likely continue to grow in Northern Virginia.
The region also has a strong competitive advantage in two smaller occupation groups: legal occupations and life, physical, and social sciences occupations.
- D.C.’s share of regional job activity in both is declining; however, the city has retained its unique specialization in these fields, even in the year following the onset of the pandemic.
- D.C.’s competitive advantage in life, physical, and social sciences relative to the region is shared with Montgomery County, though for distinct reasons. While Montgomery County has a strong biotech corridor, D.C. attracts economists, political scientists, and other social scientists.
These findings imply that D.C. is not currently benefiting from the shared economic strengths of the region. A continued loss of job activity will begin to erode D.C.’s competitive advantages.
Risks to the District’s economic prosperity
A worst-case economic scenario for D.C. would be falling behind the region rather than growing alongside its neighboring jurisdictions. While many cities bounce back after experiencing pandemics and other catastrophic events, there is still a loss to the community in the time that it takes to recover.69
Remote work
As D.C. recovers from the pandemic’s impacts, one risk is the rise of remote work causing jobs to leave the city and people to spend less time in city. This is risk is particularly strong in the D.C. region where the largest and strongest occupations are high-skill, high-wage, and office-based, making those workers particularly mobile. In the past, when D.C. lost jobs to the rest of the region, it was generally the consequence of companies moving out of the city. With the rise of remote work, the city can lose workers without losing jobs as counted by the BLS. And, if enough workers are working remotely, it is possible that the companies will follow them or reduce their office footprint in D.C. to save on costs.
Weaker policies and insufficient investments
But, D.C.’s share of regional jobs was declining even before the pandemic. Another risk is D.C.’s policies and investments blocking city’s ability to pull from regional strengths.
Northern Virginia’s jurisdictions are becoming increasingly competitive in attracting workers and businesses in the region’s key occupation groups (business, finance, management, and computer and math). And, with Virginia often listed as a top state to do business, this success will continue. The strong education institutions, access to capital, and business friendliness (a legal and regulatory framework that does not overburden businesses) contributed to state ranking third place on CNBC’s America’s Top States for Doing Business list in 2022 and first in 2021.70
Northern Virginia’s strengths in business, finance, management, and computer and math in part stem from the presence of the Dulles Technology Corridor. But, the Virginia Economic Development Partnership has also put together a long-term strategy to attract workers and businesses in these fields, offering corporate tax credits, recruitment and training incentives, and management and technical support.71
The District also offers many business incentives. These incentives tend to target start-ups and small businesses,72 but do not offer as many benefits for the industries that employ workers in the region’s key occupation groups, such as management of companies and enterprises and professional, scientific, and technical services.73 And, while one of D.C.’s strengths has been incubation of new businesses,74 D.C. lags its surrounding jurisdictions when it comes to start-up rates and business survival rates.75, 76
Successful businesses attract workers. Likewise, a strong workforce will attract more businesses. While D.C. is one of the largest employment centers in the region and has been successful at incubating new small businesses, the city can fine-tune its policies to build on its competitive positioning within the region, and grow alongside its neighboring jurisdictions.
D.C.’s ability to attract and retain residents, workers, and businesses
The recently-unveiled DC Comeback Plan, created by Mayor Muriel Bowser and the Office of the Deputy Mayor for Planning and Economic Development (DMPED), aims to address many of the challenges D.C. is facing by setting goals to increase equity, attract new jobs, create more opportunities for residents, and boosting the population. Notably, the plan sets an intention to create 35,000 new jobs and add 15,000 new residents to the city’s downtown population, in addition to retaining existing residents.
Targeting the region’s largest and strongest industries will make the greatest impact on the regional economy. But a new job in D.C. does not guarantee that worker will live in D.C., or even commute to the city. And, it would be difficult to regulate any incentives requiring a worker’s presence in D.C. This elevates the need to attract and retain residents in addition to jobs. This is the best way for the city to attract workers and bring more diversity to the economy, enabling the city to maintain and grow its tax base.
The D.C. Policy Center has written extensively on strategies to attract businesses and jobs, including reviewing policies that impact businesses’ start-up rates and start-up rates, creating a more business-friendly environment by offering regulatory certainty, and addressing barriers to starting a business.77 And innovative policy solutions, focused on addressing pre-pandemic challenges that have since been exacerbated, such as housing affordability, the vibrancy of downtown, public transit reliability, and pubic safety concerns, would serve to attract residents.78 The Comeback Plan is a step in the right direction.
As the region’s central city, D.C. has several existing strengths to leverage. D.C. can offer a density of jobs, amenities, and networks that suburbs do not have. Retaining these features by enhancing the quality of life in the city would serve to make D.C. an attractive place for workers to locate, even if their jobs are elsewhere.
Appendix
More on US Census ACS PUMS data
The U.S. Census Bureau’s American Community Survey (ACS) Public Use Microdata Sample (PUMS) provides estimates on population, housing, and household characteristics for geographic areas. We use the ‘place of work’ variable, which identifies a person’s place of work by PUMA and State, to analyze the number of jobs by occupation located throughout the D.C. region.
PUMAs are geographic areas with at least 100,00 people. Place of work by PUMA identifies the location of a resident’s primary workplace. Place of work microdata can only be tabulated to the state or county-based PUMA level, so the place of work PUMA code is distinct from standard PUMA codes. This report uses the distinct place of work PUMA codes, which aggregates to the data to the county level (in some cases, counties are combined).
More information can be found at https://www2.census.gov/geo/pdfs/reference/puma/Defining_POWPUMAs_MIGPUMAs.pdf#:~:text=Public%20Use%20Microdata%20Areas%20%28PUMAs%29%20are%20geographic%20areas,to%20the%20state%20or%20%E2%80%9Cstandard%E2%80%9D%20county-based%20PUMA%20level.
Due to the nature of microdata, analysis of these data often has high margin of errors. We have included the error terms for all calculations throughout the report as needed. All errors are calculated according to Census guidelines found at https://www.census.gov/content/dam/Census/library/publications/2008/acs/ACSGeneralHandbook.pdf (Appendix 3).
As stated throughout the report, these data also relies on the surveytaker understanding the question (place of work) as intended. With remote work, this question is likely increasingly unclear to surveytakers.
We use ACS PUMS data over Current Population Survey Annual Social and Economic Supplement (CPS ASEC) data because D.C. has a very small sample size in the CPS ASEC.
More on BLS Occupational Employment and Wage Statistics data
This report offers a snapshot of the Washington metropolitan area’s economic strengths by occupation, using BLS Occupational Employment and Wage Statistics data. According to BLS, these data cannot be compared over time due to changes in methodology, changes in the survey reference periods, and changes in the occupational, industrial, and geographic classification systems. More information on these data can be found at https://www.bls.gov/oes/oes_ques.htm.
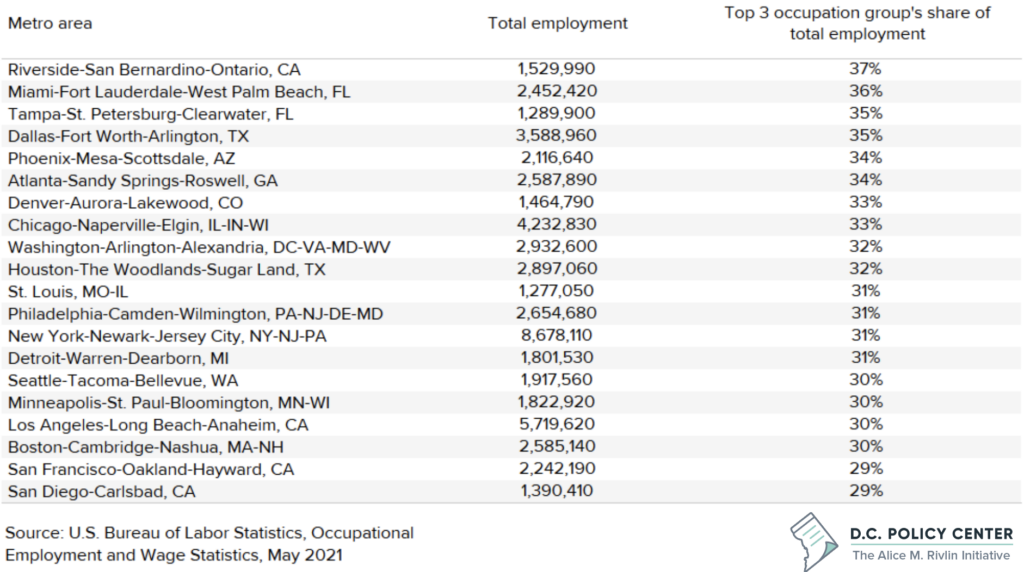
The Washington metropolitan area’s occupational strengths are also compared to the top 20 largest metropolitan areas (by total employment) as a reference point. The following metropolitan areas are used in the analysis:
- Atlanta-Sandy Springs-Roswell, GA
- Boston-Cambridge-Nashua, MA-NH
- Chicago-Naperville-Elgin, IL-IN-WI
- Dallas-Fort Worth-Arlington, TX
- Denver-Aurora-Lakewood, CO
- Detroit-Warren-Dearborn, MI
- Houston-The Woodlands-Sugar Land, TX
- Los Angeles-Long Beach-Anaheim, CA
- Miami-Fort Lauderdale-West Palm Beach, FL
- Minneapolis-St. Paul-Bloomington, MN-WI
- New York-Newark-Jersey City, NY-NJ-PA
- Philadelphia-Camden-Wilmington, PA-NJ-DE-MD
- Phoenix-Mesa-Scottsdale, AZ
- Riverside-San Bernardino-Ontario, CA
- San Diego-Carlsbad, CA
- San Francisco-Oakland-Hayward, CA
- Seattle-Tacoma-Bellevue, WA
- St. Louis, MO-IL
- Tampa-St. Petersburg-Clearwater, FL
- Washington-Arlington-Alexandria, DC-VA-MD-WV
A high location quotient indicates regional specialization in an occupation group. However, it can also indicate a lack of economic diversity. This should be considered when comparing location quotients.
Figure 9. Total employment and economic diversity
More on BLS jobs data
Jobs and labor force numbers come from two different sources (the first, from the Current Employment Survey, and the second, from the Current Population Survey) that measure employment in slightly different ways.
The Current Employment Survey measures employment in a region regardless of the residency of the worker. This metric typically excludes proprietors, private household employees, unpaid volunteers, farm employees, and the unincorporated self-employed.
The Current Population Survey measures resident employment. This is the number of residents who live in a region and are employed, regardless of the location of their employment. This metric typically includes persons who did any work as paid employees, worked in their own business or profession or on their own farm, or worked 15 hours or more as unpaid workers in an enterprise operated by a member of their family.
Other data sources like Quarterly Workforce Indicators, Longitudinal Employer-Household dynamics, or Origin-Destination Employment Statistics, which partly depend on employer-reported job locations, are also more challenging to interpret with the rise of remote work.
Acknowledgements
This report benefited from thoughtful feedback from Kartik Athreya (Federal Reserve Bank of Richmond), Richard Auxier (Urban-Brookings Tax Policy Center), Evette Banfield (CNHED), Tracy Hadden Loh (Brookings Metropolitan Policy Program), and Santiago Pinto (Federal Reserve Bank of Richmond). All remaining errors belong to the authors.
The views expressed in this report are those of D.C. Policy Center researchers and experts and should not be attributed to members of the D.C. Policy Center’s Board of Directors, advisors, or its funders.
Our gratitude to the photographers whose images appear in this report. Cover photo by Rawpixel Ltd (source), used under Creative Commons license CC0 1.0.
Endnotes
- Remote work remains popular in D.C. metro area. This is likely to cause shifts in the region’s economic activity. McConnell, Bailey and Sayin Yesim (2022). “Remote work and the future of D.C. (Part 1): How is remote work changing the geography of work in the District of Columbia?” D.C. Policy Center, Washington, D.C.
- Job data from BLS is based on surveys sent to establishments, so this data tracks jobs based on where businesses are located.
- Resident employment is defined by the number of residents who live in the region and are employed, regardless of the location of their employment. This data comes from the BLS Local Area Unemployment Statistics. This metric typically includes persons who did any work as paid employees, worked in their own business or profession or on their own farm, or worked 15 hours or more as unpaid workers in an enterprise operated by a member of their family.
- Total employment is the employment in the region regardless of the residency of the worker. This data comes from the BLS Current Employment Statistics (State and metro Areas). This metric typically excludes proprietors, private household employees, unpaid volunteers, farm employees, and the unincorporated self-employed.
- Sayin, Yesim and McConnell, Bailey (2023). “Chart of the week: Here, but gone: The impact of remote work on local talent.” D.C. Policy Center, Washington, D.C.
- Sayin, Yesim and McConnell, Bailey (2023). “Chart of the week: Here, but gone: The impact of remote work on local talent.” D.C. Policy Center, Washington, D.C.
- Sayin, Yesim (2023). “Chart of the week: When a low unemployment rate is not good news.” D.C. Policy Center, Washington, D.C.
- In May 2021, researcher Stephan Whitaker found that between 2020 Q2 and 2021 Q1, migration from high-cost, large metro areas to lower-cost, large metro areas was up by 9.4 percent compared to migration flows between 2017 Q2 and 2020 Q1. Whitaker’s most recent data show that between 2021 Q3 and 2022 Q2 migration is from high-cost, large metro areas to lower-cost, large metro areas was up 17.4 percent compared to the same base period. Source: Whitaker, Stephan (2021). “Migrants from High-Cost, Large Metro Areas during the COVID-19 Pandemic, Their Destinations, and How Many Could Follow.” Federal Reserve Bank of Cleveland. Updated data can be found here.
- U.S. Census Bureau American Community Survey questionnaire, found here.
- McConnell, Bailey (2023). “Chart of the week: Office occupancy rates and remote work.” D.C. Policy Center, Washington, D.C.
- U.S. Census Bureau LEHD Origin-Destination Employment Statistics Data (2019), accessed on March 10, 2022 at https://lehd.ces.census.gov/data/#lodes. LODES 7.5 [version]. Note: To avoid double counting workers, this calculation only includes primary jobs. Additionally, the DC Office of the Chief Financial Officer estimates that approximately 61.7 percent of wages earned in D.C. were earn by non-residents in FY 2021.
- For more information on location quotient, please see the following guide: Understanding Location Quotient – EMSI Resource Library.
- U.S. Bureau of Labor Statistics, Occupational Employment and Wage Statistics, May 2021 data.
- See appendix for details
- JLL (2019). “Big tech is taking off in NoVa.” Washington Business Journal.
- Cushman & Wakefield (2022). “I-270 Life Sciences Corridor Remains Top Cluster in the Nation.” Cushman & Wakefield.
- The region is also relatively specialized in protective services (LQ 1.25 and 3 percent of regional jobs) and arts, entertainment, sports, and media (LQ 1.8 and 2 percent of regional jobs). In this report, among the region’s smaller occupation groups, we limit the focus to the legal and life, physical, and social science due to the region’s particularly strong specializations in these fields (each have an LQ greater than 2).
- Between 2001 and 2019, the D.C. metro area gained 511,446 jobs. D.C. contributed to 27.4 percent of this growth. U.S. Census, Quarterly Census of Employment and Wages.
- We consider the District’s share of jobs within the region stable if the share in different years is the same, or if the margin of error makes it statistically unclear if the share increased or decreased.
- Data is based on resident reported place of work. Source: U.S. Census, 2017, 2019, and 2021 ACS 1-Year PUMS data. Calculations exclude military occupations and those that reported being unemployed.
- Margin of error: 1.3 percentage points
- Margin of error: 1.2 percentage points
- Margin of error: 1.3 percentage points
- Margin of error: 1.2 percentage points
- Margin of error: 1.0 percentage points
- In 2021, 20.1 percent of regional management jobs were in D.C. with a margin of error of 1.0 percentage points and 20.6 percent were in Fairfax County with a margin of error of 1 percentage points.
- In 2019, 30.1 percent of the region’s computer and math jobs were in Fairfax County with a margin of error of 1.7 percentage points.
- Margin of error: 1.4 percentage points
- Margin of error: 1.0 percentage points
- In 2021, 14.9 percent of the region’s computer and math jobs were in Montgomery County with a margin of error of 1.2 percentage points and 13.4 percent were in D.C. with a margin of error of 1.0 percentage points. The error terms make it unclear whether Montgomery County or D.C. has more jobs in this field.
- Margin of error: 3.1 percentage points
- Margin of error: 3.2 percentage points
- Margin of error: 2.9 percentage points
- Montgomery County’s share of the region’s life, physical and social science jobs was 28.3 percent in 2021 with a margin of error of 1.8 percentage points. D.C.’s share was 23.8 percent, but with a margin of error of 2.9 percentage points. The errors make it unclear which jurisdiction is the leader.
- The question on place of work was written as: “At what location did this person work LAST WEEK? If this person worked at more than one location, print where he or she worked most last week.” Source: U.S. Census Bureau American Community Survey questionnaire
- Margin of error: 2.3 percentage points
- Margin of error 2.0 percentage points
- Margin of error: 2.4 percentage points
- Margin of error: 2.6 percentage points
- Althoff, Lukas et al. (2022). “The Geography of Remote Work.” Regional Science and Urban Economics (Volume 93).
- Margin of error: 6.6 percentage points
- Margin of error: 5.4 percentage points
- Margin of error: 6 percentage points
- Margin of error: 5.5 percentage points
- Margin of error: 10 percentage points
- Margin of error: 11 percentage points
- U.S. Bureau of Labor Statistics, All Employees: Total Nonfarm in Washington-Arlington-Alexandria, DC-VA-MD-WV (MSA) [WASH911NA], retrieved from FRED, Federal Reserve Bank of St. Louis; https://fred.stlouisfed.org/series/WASH911NA, March 16, 2023.
- McConnell, Bailey and Sayin, Yesim (2022). “A new regional playing field: How can D.C. stay economically competitive with its suburban neighbors?” D.C. Policy Center, Washington, D.C.
- U.S. Census, 2017, 2019, and 2021 ACS 1-Year PUMS data. Calculations exclude military occupations and those that reported being unemployed.
- Margin of error: 0.1
- As of 2021, Fairfax County has a location quotient of 1.2 for business and financial jobs with a margin of error of 0.1 and Arlington County has a location quotient of 1.4 with a margin of error of 0.2.
- Margin of error: 0.1
- Margin of error: 0.1
- Margin of error: 0.1
- Margin of error: 0.1
- Margin of error: 0.1
- In 2019, D.C.’s location quotient for computer and math jobs was 1.0 with a margin of error of 0.1. In 2021, D.C.’s location quotient was 0.8 with a margin of error of 0.1.
- Margin of error: 0.3
- Margin of error: 0.3
- As of 2021, legal jobs are 1.96 times more concentrated in Alexandria than the rest of the region. Margin of error: 0.5
- Accounting for the error terms, the increase is only significant for Montgomery County, which had a location quotient of 0.5 with a margin of error of 0.1 in 2017 and a location quotient of 1.1 with a margin of error of 0.2 in 2021
- Margin of error: 0.2
- Margin of error: 0.2. 2021 was the first year (between 2017, 2019, and 2021) that Montgomery County had the region’s largest location quotient for life, physical, and social science jobs in a significant way (the error terms do not make this lead unclear).
- As of May 2021, in the D.C. metro area, the average annual wage for management occupations is $152,640, the average annual wage for business and financial occupations is $100,780, and the average annual wage for computer and math occupations is $117,730. This compares to an average annual wage of $80,480 across all occupations in the area. Source: U.S. Bureau of Labor Statistics, Occupational Employment and Wage Statistics, May 2021 data.
- Core counties include: D.C., Arlington, Fairfax, and Loudoun counties in Virginia, Montgomery and Prince George’s counties in Maryland, and Alexandria city in Virginia.
- Exurbs include jurisdictions in the Washington metropolitan area that are not a core county (cannot be reached by WMATA metro).
- As of May 2021, the average annual wages in the D.C. metro area are $34,030, $36,820, and $38,210, respectively. Source: U.S. Bureau of Labor Statistics, Occupational Employment and Wage Statistics, May 2021 data.
- The error terms do not make this shift meaningful in every jurisdiction.
- Many have speculated that cities will recover: Wilbert, Tony (2020). “Cities Will Bounce Back From Crisis as They Always Have, ULI Honoree Predicts.” CoStar, Washington, D.C.; Jaffe, Eric (2020). “Why Richard Florida worries cities will recover too quickly from Covid.” Sidewalk Talk via Medium; McArdle, Megan (2020). “Opinion: Cities will make a comeback after the coronavirus. They almost always do.” Washington Post, Washington, D.C
- America’s Top States for Business 2022 and 2021, CNBC.com
- For more information: https://www.vedp.org/
- For more information: https://open.dc.gov/biz-incentives/
- Song, Abraham (2021). “The District’s business incentives should target its comparative advantages.” D.C. Policy Center, Washington, D.C.
- Between 2019 and 2021, despite the loss of existing businesses due to the pandemic, there was still an 11 percent net increase in total private establishments in D.C. Source: 2022 State of Business Report: Doing business Under the New Normal. D.C. Policy Center on behalf of the DC Chamber of Commerce
- Sayin, Yesim (2022). “D.C. Council testimony on Bill 24-301, the “Business and Entrepreneurship Support to Thrive (BEST) Amendment Act of 2021.” D.C. Policy Center, Washington, D.C.
- Sayin, Yesim (2022). “New business formation and survival across the Washington metropolitan region.” D.C. Policy Center, Washington, D.C.
- Sayin, Yesim (2022). “D.C. Council testimony on Bill 24-301, the “Business and Entrepreneurship Support to Thrive (BEST) Amendment Act of 2021.” D.C. Policy Center, Washington, D.C.
- For more on these strategies, see: McConnell, Bailey and Sayin, Yesim (2022). “Remote work and the future of D.C. (Part 2): What does remote work mean for the District of Columbia’s tax base?” D.C. Policy Center, Washington, D.C.