

State of D.C. Schools is an annual systemwide overview of public education in the District of Columbia. In school year 2022-23 students and staff began their first normal year of in-person learning since the pandemic. This report examines the District’s persistent push for academic recovery and improving attendance. This version of the report has been adapted for web. You may also access the original PDF version.
Quick links
- Read this report in its original PDF format
- Report one pager / En español
- Launch event information
- Recovery Dashboard
About the D.C. Policy Center
The mission of the D.C. Policy Center is to arm decision makers with fact-based, unbiased, and reliable research and analyses to help create a vibrant local economy that can maximize opportunities for residents, workers, and businesses in the District of Columbia. Through objective and rigorous research and collaboration, the D.C. Policy Center develops and tests policy ideas, disseminates its findings, actively promotes policy solutions, and engages in constructive dialogue and debate.
About this report
State of D.C. Schools is an annual systemwide overview of public education in the District of Columbia. The report’s main purpose is to give D.C. residents, parents, caregivers, policymakers, and other stakeholders a snapshot of the overall performance of the District’s public schools.
This report captures school year 2022-23, which in many ways marked the first normal year of in-person school during the pandemic. This report examines a continued push for education recovery with a concentrated push especially toward improving attendance.
We hope that this State of D.C. Schools report will help inform local education leaders and policymakers in their development of future policy decisions especially as federal pandemic recovery funds sunset.
The views expressed in this report are those of D.C. Policy Center researchers and experts and should not be attributed to members of the D.C. Policy Center’s Board of Directors or its funders.
Other reports in this series
- State of D.C. Schools, 2018-19
- State of D.C. Schools, 2019-20
- State of D.C. Schools, 2020-21
- State of D.C. Schools, 2021-22
Acknowledgements
This report was prepared with generous support from Education Forward DC. The report also benefited from comments provided by the staff of DME, DC SBOE, OSSE, and DC PCSB. Their review in no way indicates an endorsement of this report, and all errors are the responsibility of the D.C. Policy Center authors.
School year 2022-23 began the great work of recovery from the pandemic as students, teachers, and school leaders focused their efforts and investments on academic recovery and student wellbeing. At the center of these efforts was a push to increase attendance and decrease high chronic absenteeism rates.
In many ways, school year 2022-23 marked the first normal year of in-person school during the pandemic as COVID-19 cases dropped below the previous school year’s levels. With the easing of strict COVID-19 protocols, many schools began to recreate school culture and were able to dedicate more resources to their core programs. Outcomes for school year 2022-23 show a new state of play for public schools in D.C. They indicate some improvements since the previous school year and a return to pre-pandemic levels. Nonetheless, results for key metrics show the pandemic’s impacts on education are long-lasting and will take many years to undo.
Executive summary
School year 2022-23 began the great work of recovery from the pandemic as students, teachers, and school leaders focused their efforts and investments on academic recovery and student wellbeing. At the center of these efforts was a push to increase attendance and decrease high chronic absenteeism rates.
In many ways, school year 2022-23 marked the first normal year of in-person school during the pandemic as COVID-19 cases dropped below the previous school year’s levels. With the easing of strict COVID-19 protocols, many schools began to recreate school culture and were able to dedicate more resources to their core programs. Outcomes for school year 2022-23 show a new state of play for public schools in D.C. They indicate some improvements since the previous school year and a return to pre-pandemic levels. Nonetheless, results for key metrics show the pandemic’s impacts on education are long-lasting and will take many years to undo.
Key metrics
Enrollment shifts: Enrollment grew by 2 percent but was still lower than pre-pandemic levels in pre-kindergarten and elementary school. Earlier grades have significant influence on the direction of future enrollments and school budgets.
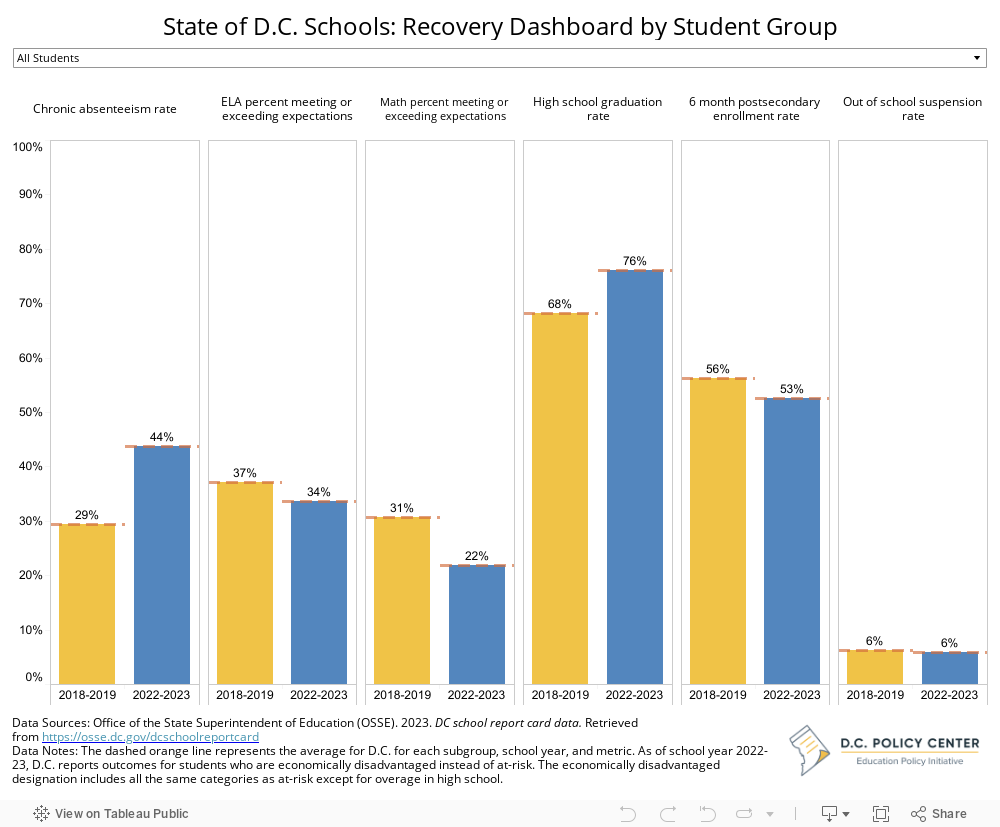
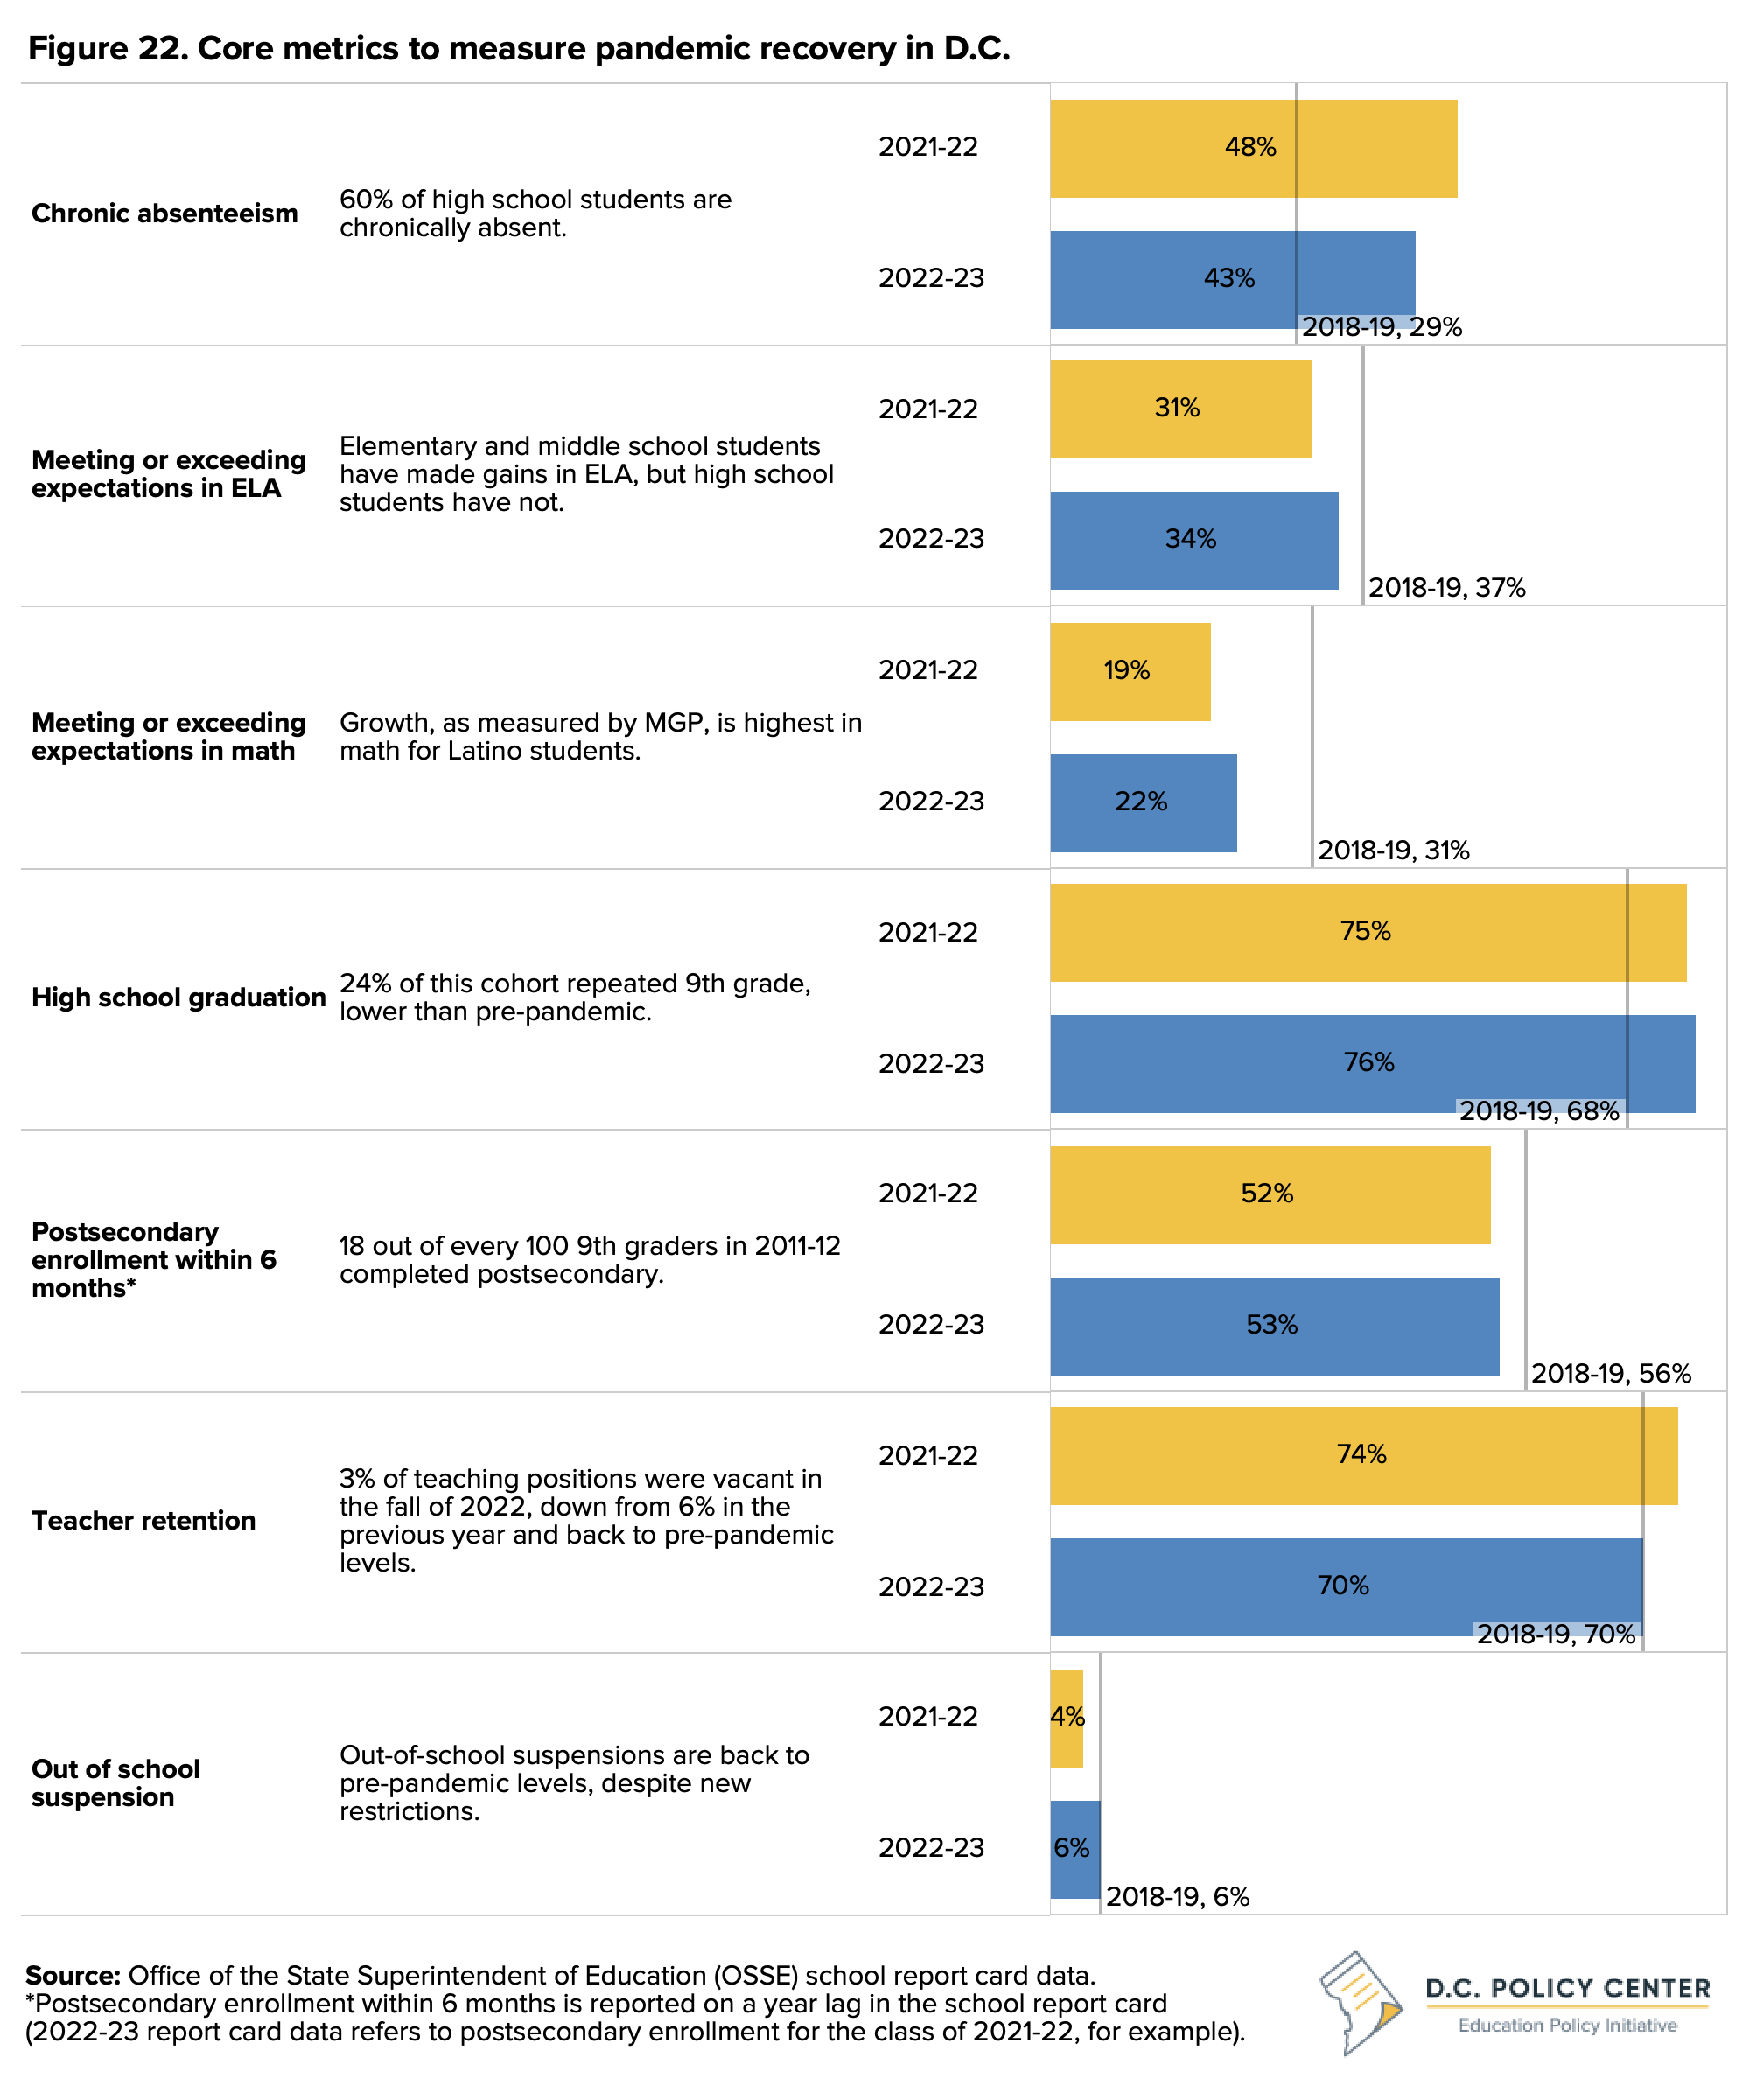
Learning outcomes: Statewide assessments improved in English Language Arts (ELA) and math by 3 percentage points over the previous school year, but this was not enough to make up for pandemic learning loss. The share of students who meet or exceed expectations remained below the pre-pandemic school year 2018-19 for both ELA (by 3 percentage points) and math (by 9 percentage points).
High school graduation: The high school graduation rate was 76 percent, showing an increase of 8 percentage points over pre-pandemic school year 2018-19. However, a smaller share of graduates continued their education, with postsecondary enrollment for the class of 2021-22 decreasing to 53 percent from 56 percent in school year 2018-19.
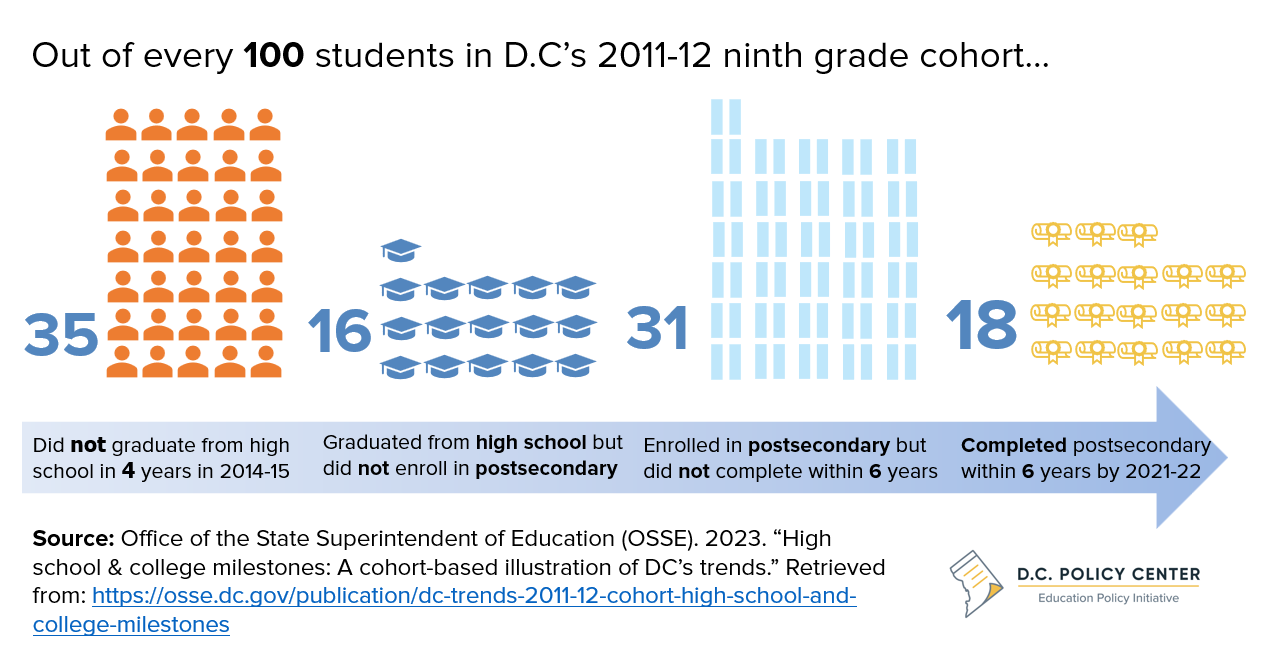
Postsecondary completion: New data showed that for the 9th grade cohort of 2011-12 (with a four-year high school graduation in school year 2014-15), 18 out of every 100 students completed a postsecondary degree within 6 years (by the spring of 2022).
Attendance: 44 percent of students were chronically absent, showing an improvement from 48 percent in the previous school year. Absenteeism was still much higher than pre-pandemic levels (29 percent in school year 2018-19) despite the switch to a less stringent absenteeism policy. Chronic absenteeism among high school students was particularly high at 60 percent.
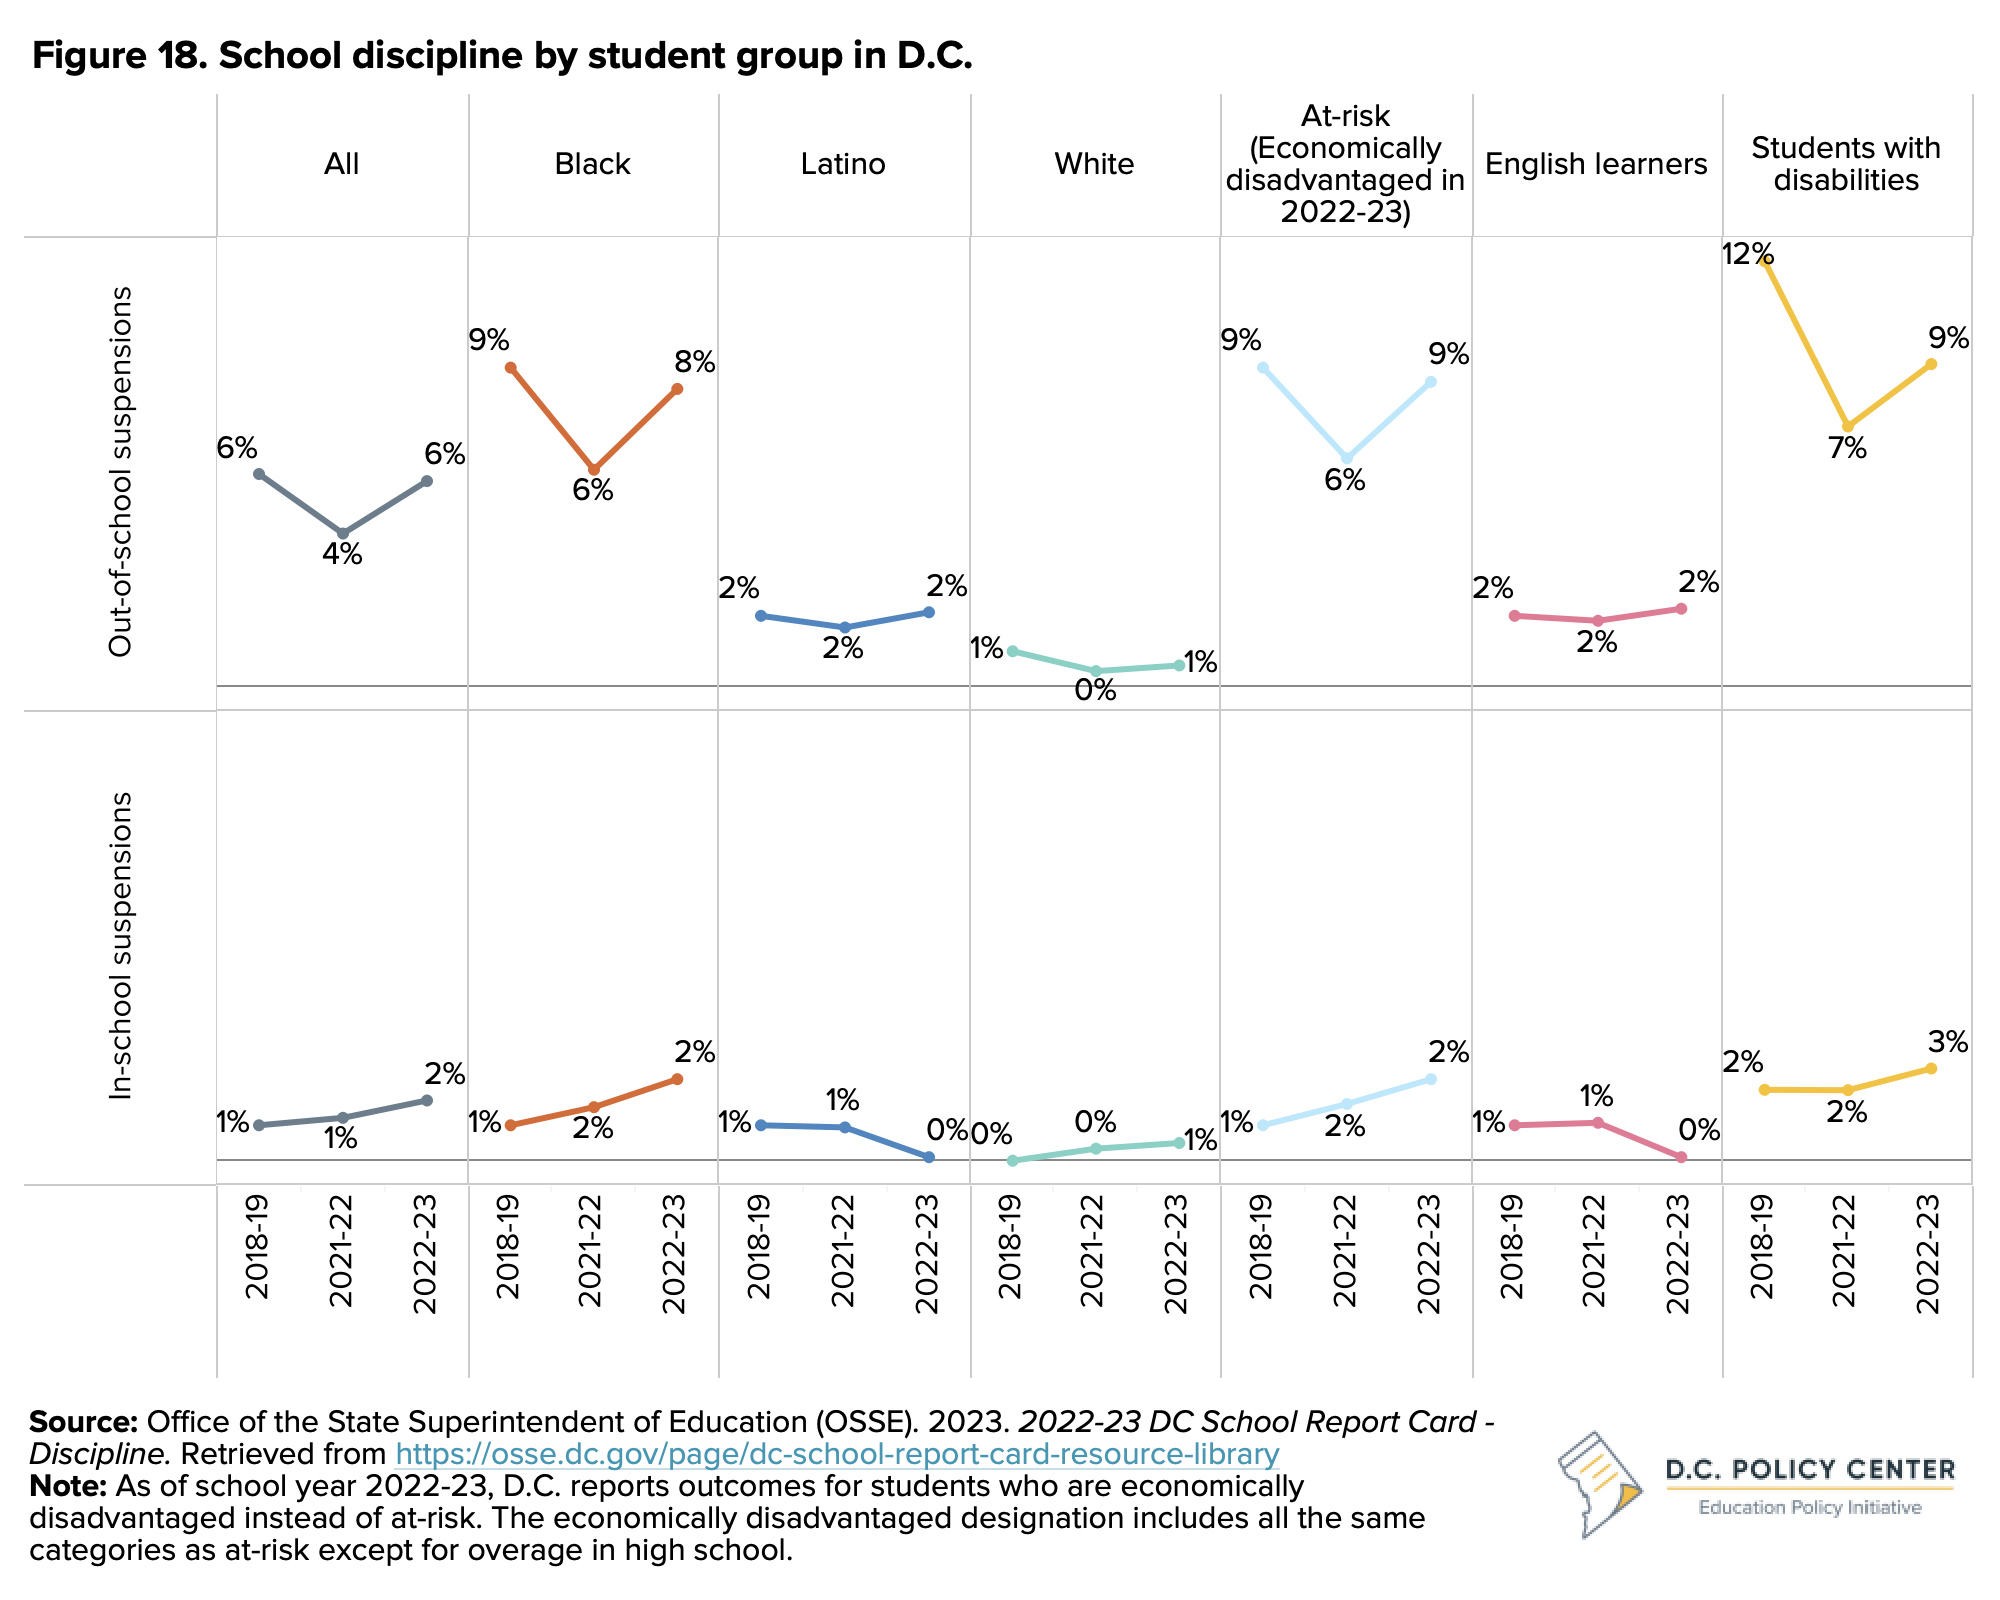
Discipline: Out-of-school suspensions have returned to pre-pandemic levels with 6 percent of students receiving a suspension, despite new restrictions on the types of behavior that lead to suspensions and the duration of suspensions.
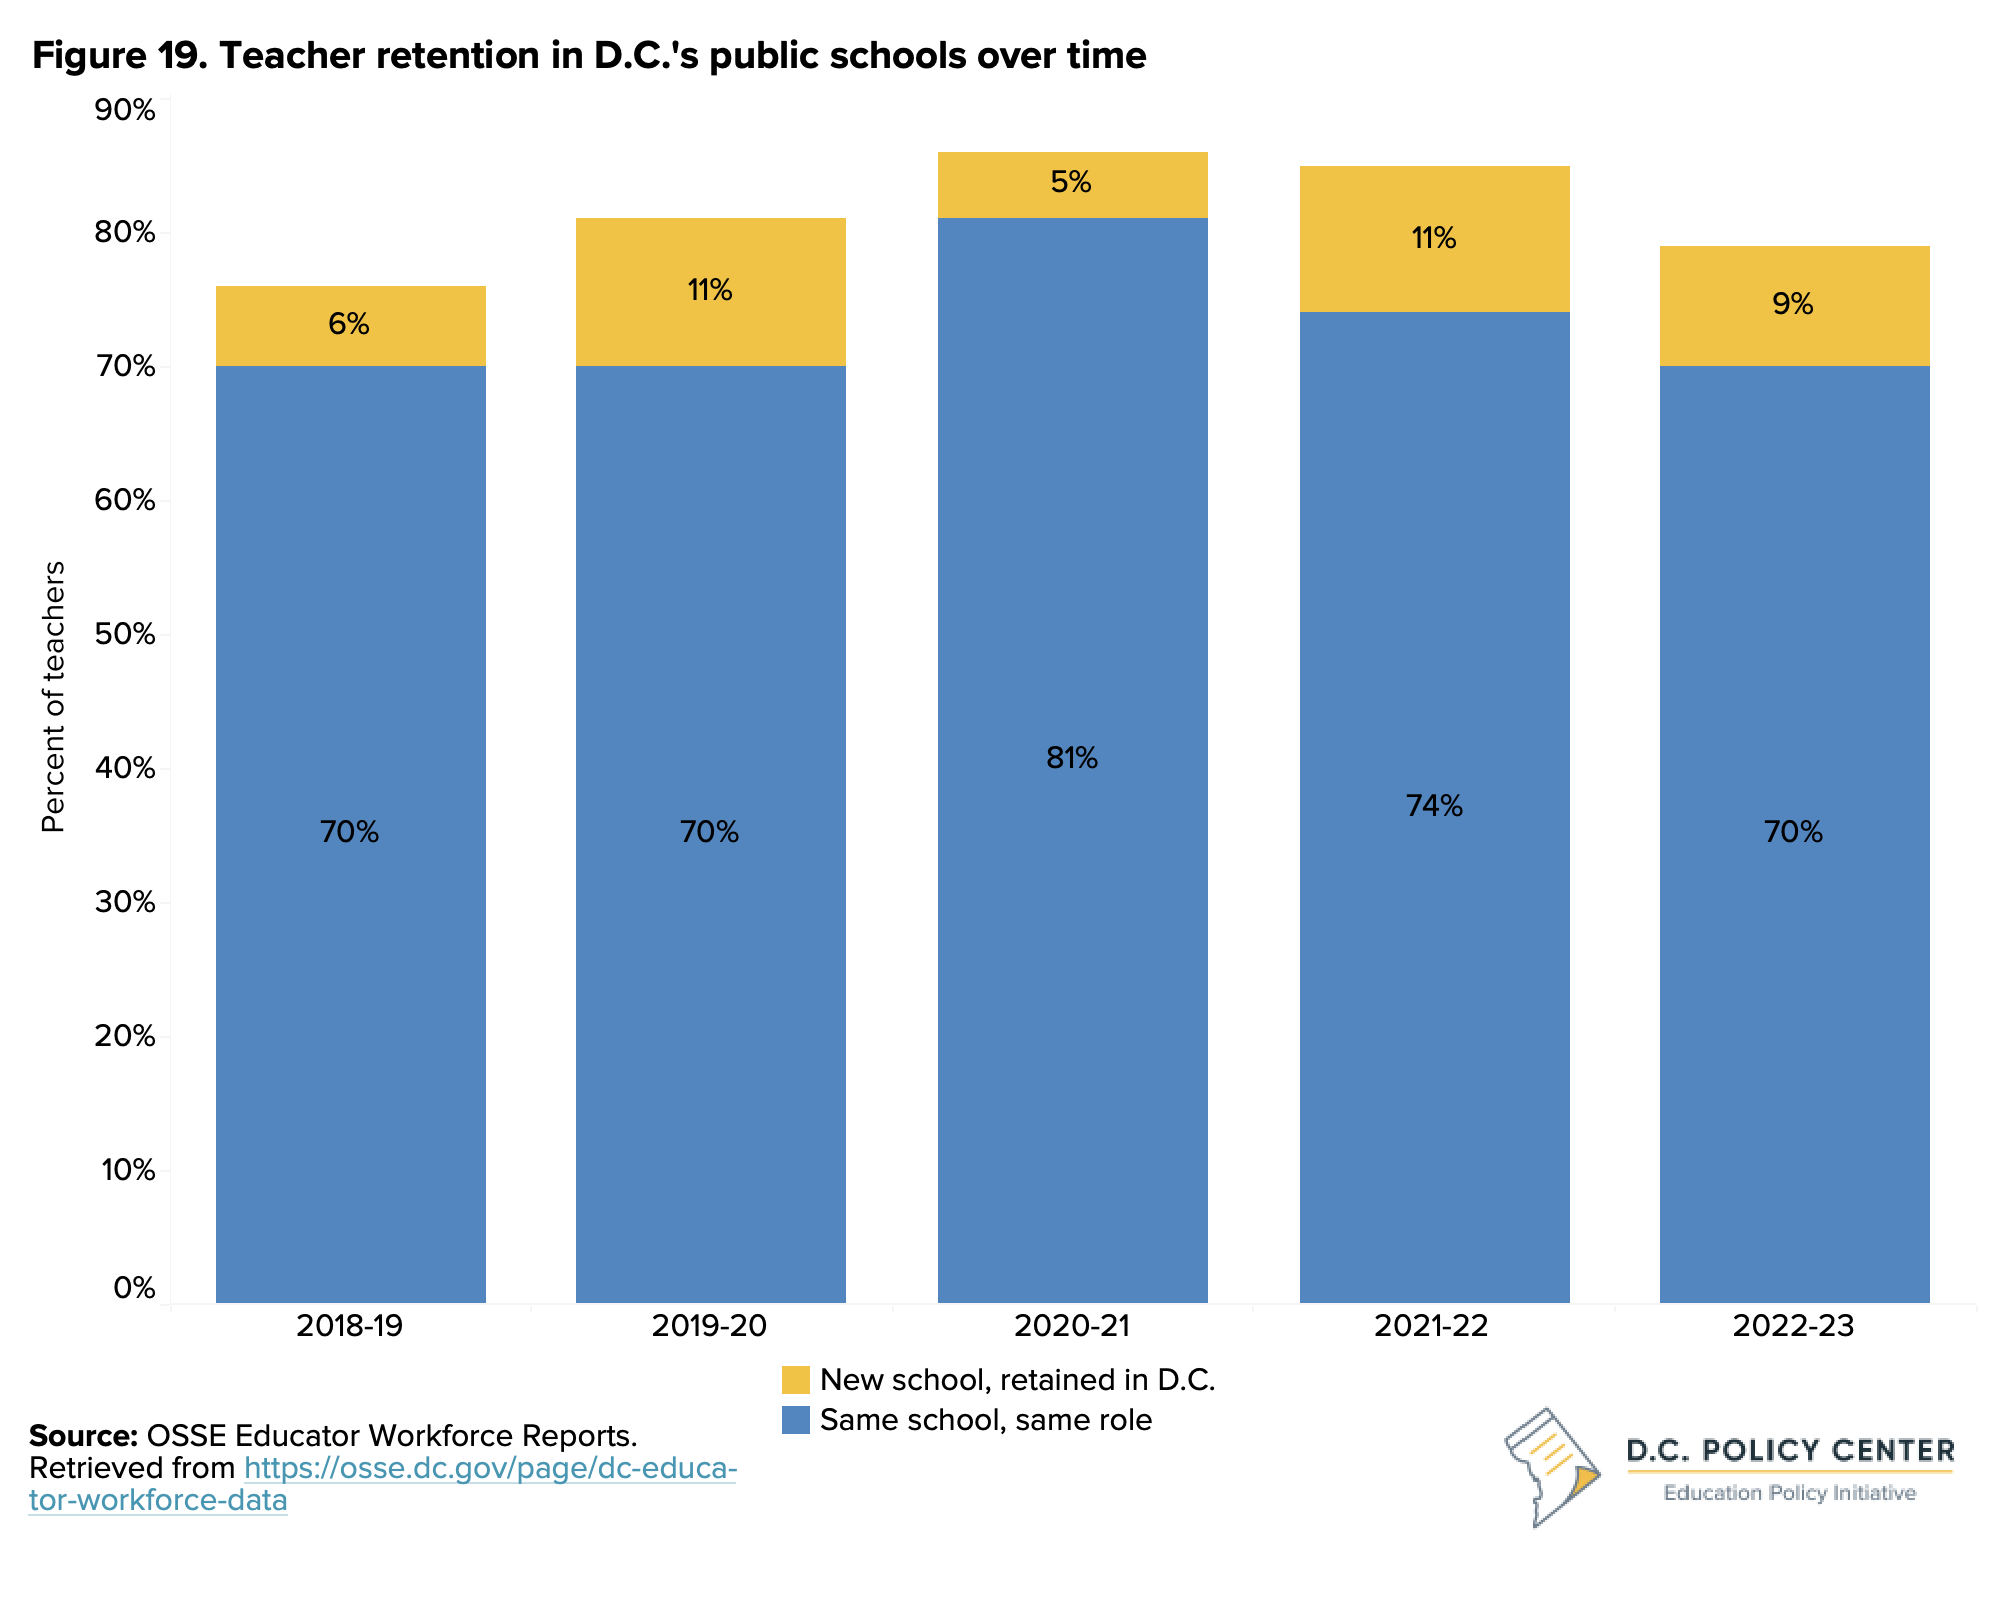
Retention: After peaking at 81 percent during the pandemic, teacher retention was back to pre-pandemic levels at 70 percent.
School funding: Schools had additional resources to spend on pandemic recovery through ESSER funds. As of February 2024 reporting, schools spent 50 percent of ESSER III funding, and have an additional $175 million to spend in school year 2023-24 and through an extension period (spending amounts are not final).
This year’s State of D.C. Schools report starts with a chronicle of how students fared during the second year of attending school fully in-person post-pandemic, with a focus on enrollment trends and student outcomes. The report also documents the school environment, with the impact of federal Elementary and Secondary School Emergency Relief (ESSER) funding and a look at the student experience. Finally, the report provides a preview of school year 2023-24.
The recovery dashboard below displays most of these key metrics for school year 2018-19 (pre-pandemic) and school year 2022-23 (post-pandemic) by student group, highlighting the difference between the D.C. average and each student group’s outcomes.
Students
This section presents enrollment trends and outcomes for students. Public school enrollment has decreased nationally since the pandemic, with a drop of 1.2 million students in school year 2020-21 that persisted into school year 2021-22.1 In school year 2022-23, enrollment in D.C.’s public schools, including District of Columbia Public Schools (DCPS) and public charter schools started to turn around, with pre-kindergarten through grade 12 enrollment increasing for the first time since the beginning of the pandemic by 2 percent. However, pre-kindergarten and elementary enrollment is still lower than pre-pandemic. Academic outcomes have increased post-pandemic in both math and ELA, excluding high school grades, but remain lower than pre-pandemic scores. Outcomes are mixed for high school students, who are more likely to graduate high school but less likely to continue to postsecondary education.
Enrollment
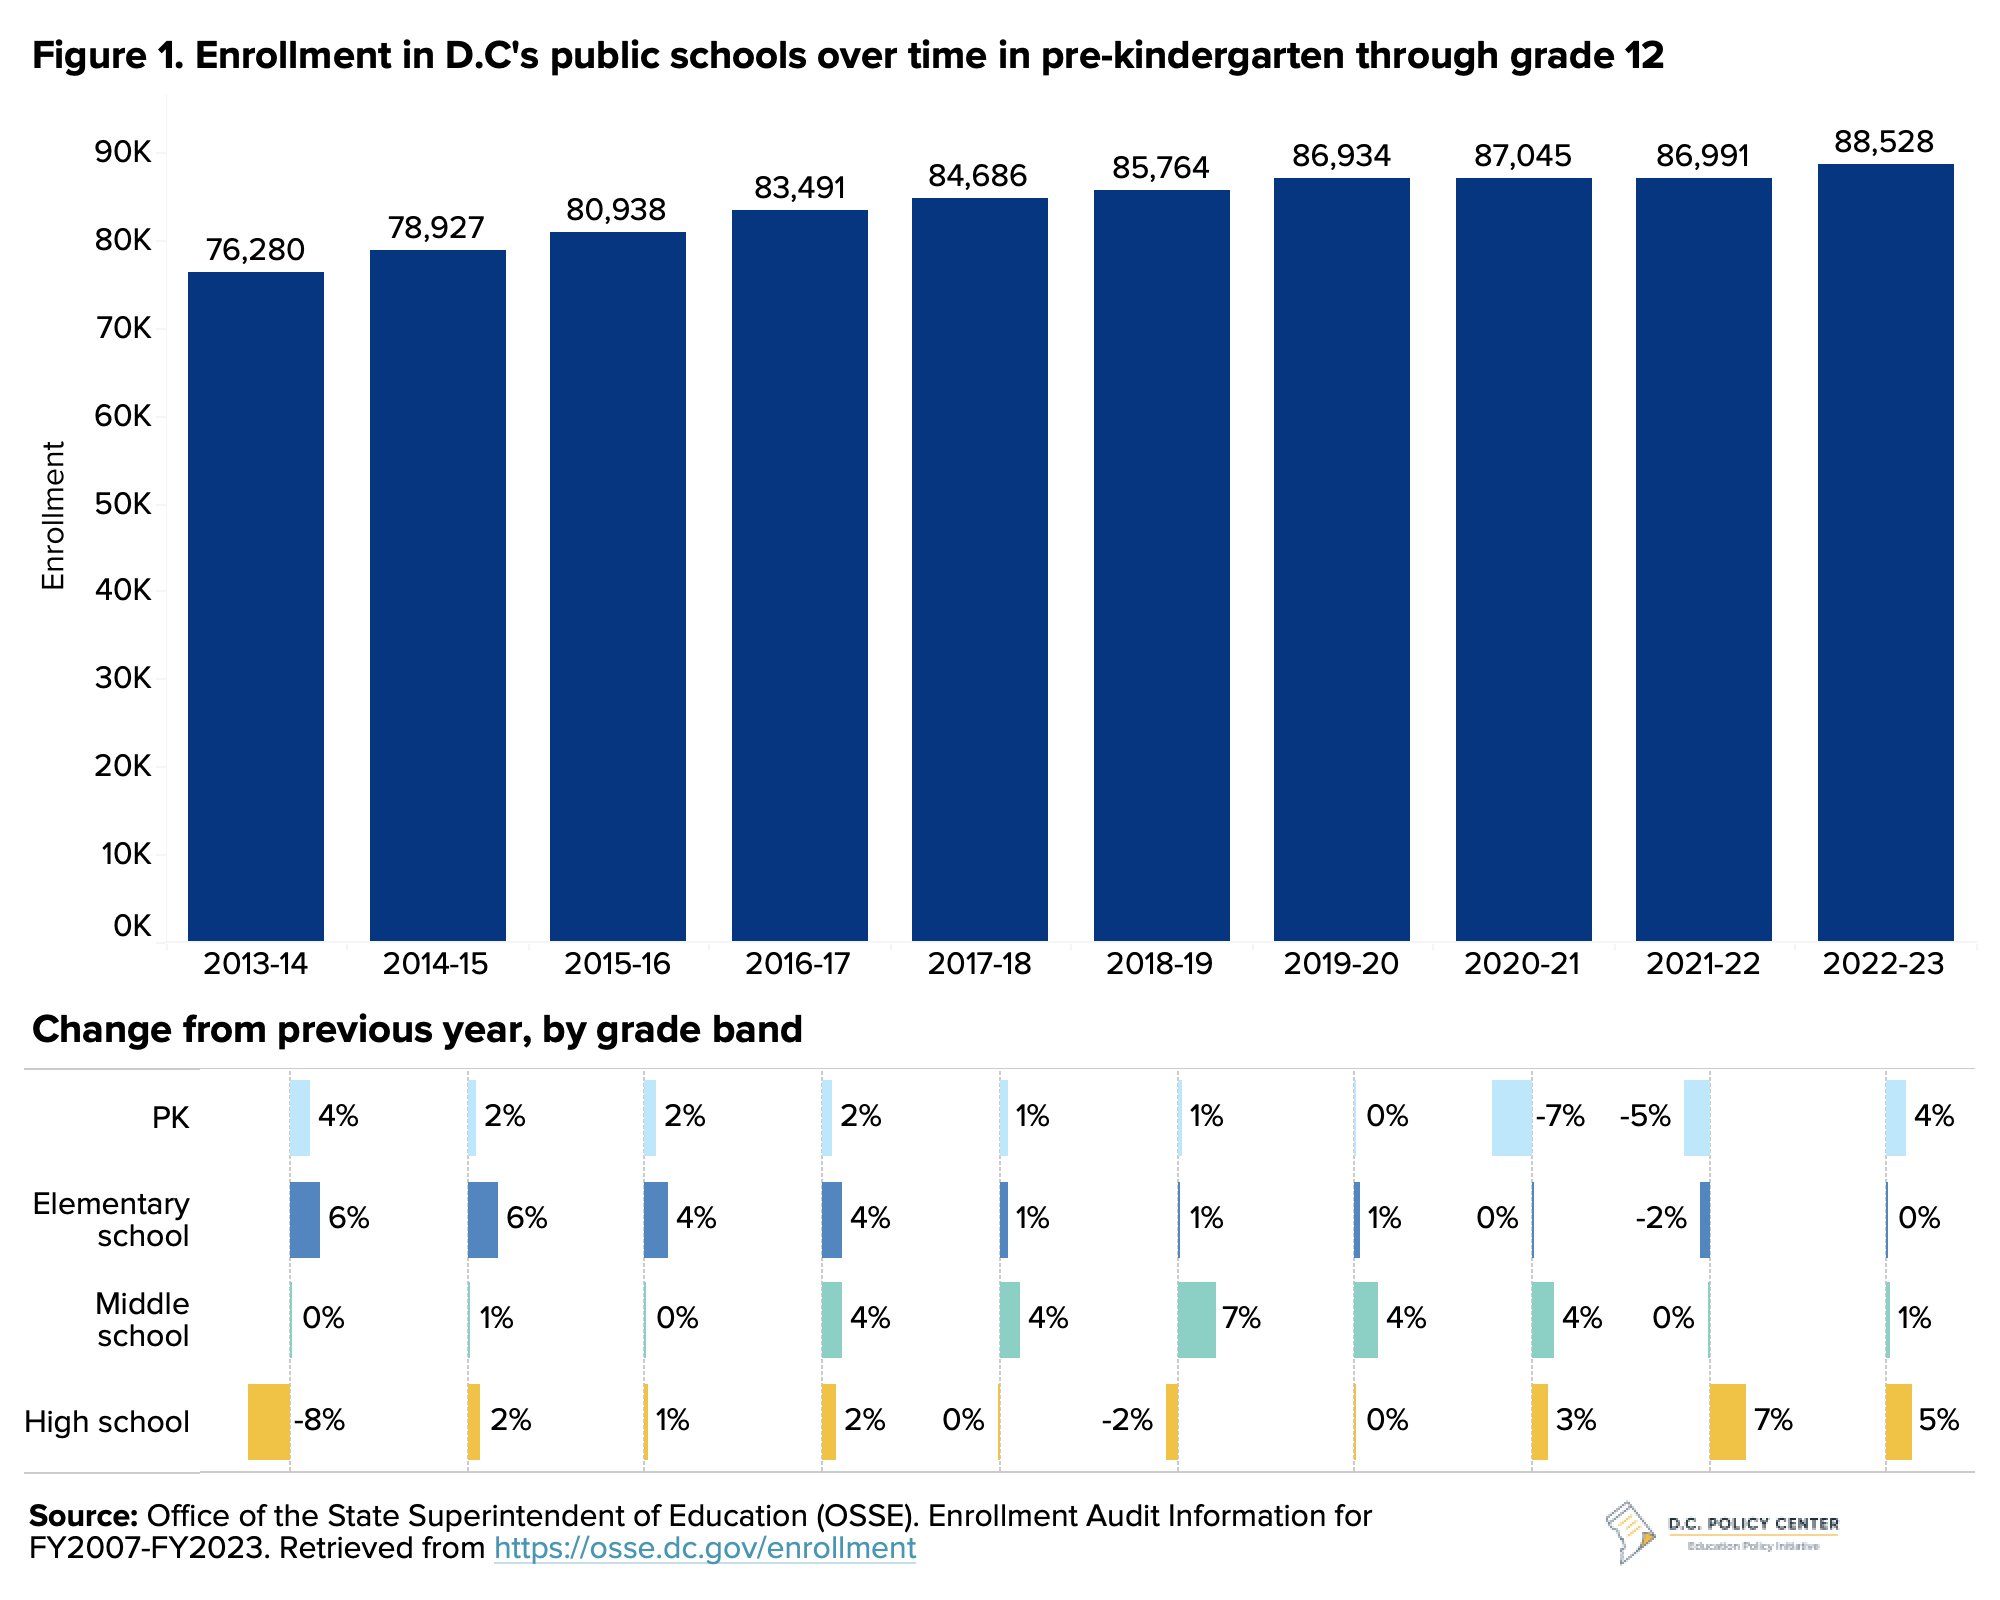
There were 88,528 pre-kindergarten through grade 12 students enrolled in school year 2022-23, with growth for the first time since the beginning of the pandemic and a larger increase in high schools. The profile of D.C.’s student population didn’t change much, but there was an uptick in the proportion of students who are designated as “at-risk” to 52 percent. Students are designated as at-risk if they meet one of the following criteria: experience homelessness, are in the foster care system, qualify for Temporary Assistance for Needy Families (TANF) or Supplemental Nutrition Assistance Program (SNAP), or are at least one year older than the expected age for their high school grade.2
Enrollment changes from previous school year
In school year 2022-23, enrollment in pre-kindergarten through grade 12 grew by 1,537 students, or 2 percent (see Figure 1). Over the same period, enrollment in Maryland’s public schools remained flat and enrollment in Virginia’s public schools grew by 1 percent.3 ,4 This was the first year that enrollment grew in a meaningful way since the beginning of the pandemic. Higher enrollment—especially an enrollment increase of 401 students (4 percent) in pre-kindergarten classes for 3- and 4-year-olds—is an important sign of recovery and a return of trust to D.C.’s public schools. Enrollment in these non-compulsory grades declined during the pandemic, in part due to lower births and in part due to lower demand.5
Enrollment across high school grades grew by more than other grade bands at 840 students (5 percent). This is linked both to larger cohorts aging up and lower 9th grade repetition rates that may have resulted in lower dropout rates.6 Elementary school enrollment came to a standstill, and middle school enrollment grew at 1 percent. These lower enrollment growth rates at earlier grade bands suggest enrollment could decline as the larger cohorts the city began building in early 2010s cycle through high school.
Enrollment by ward
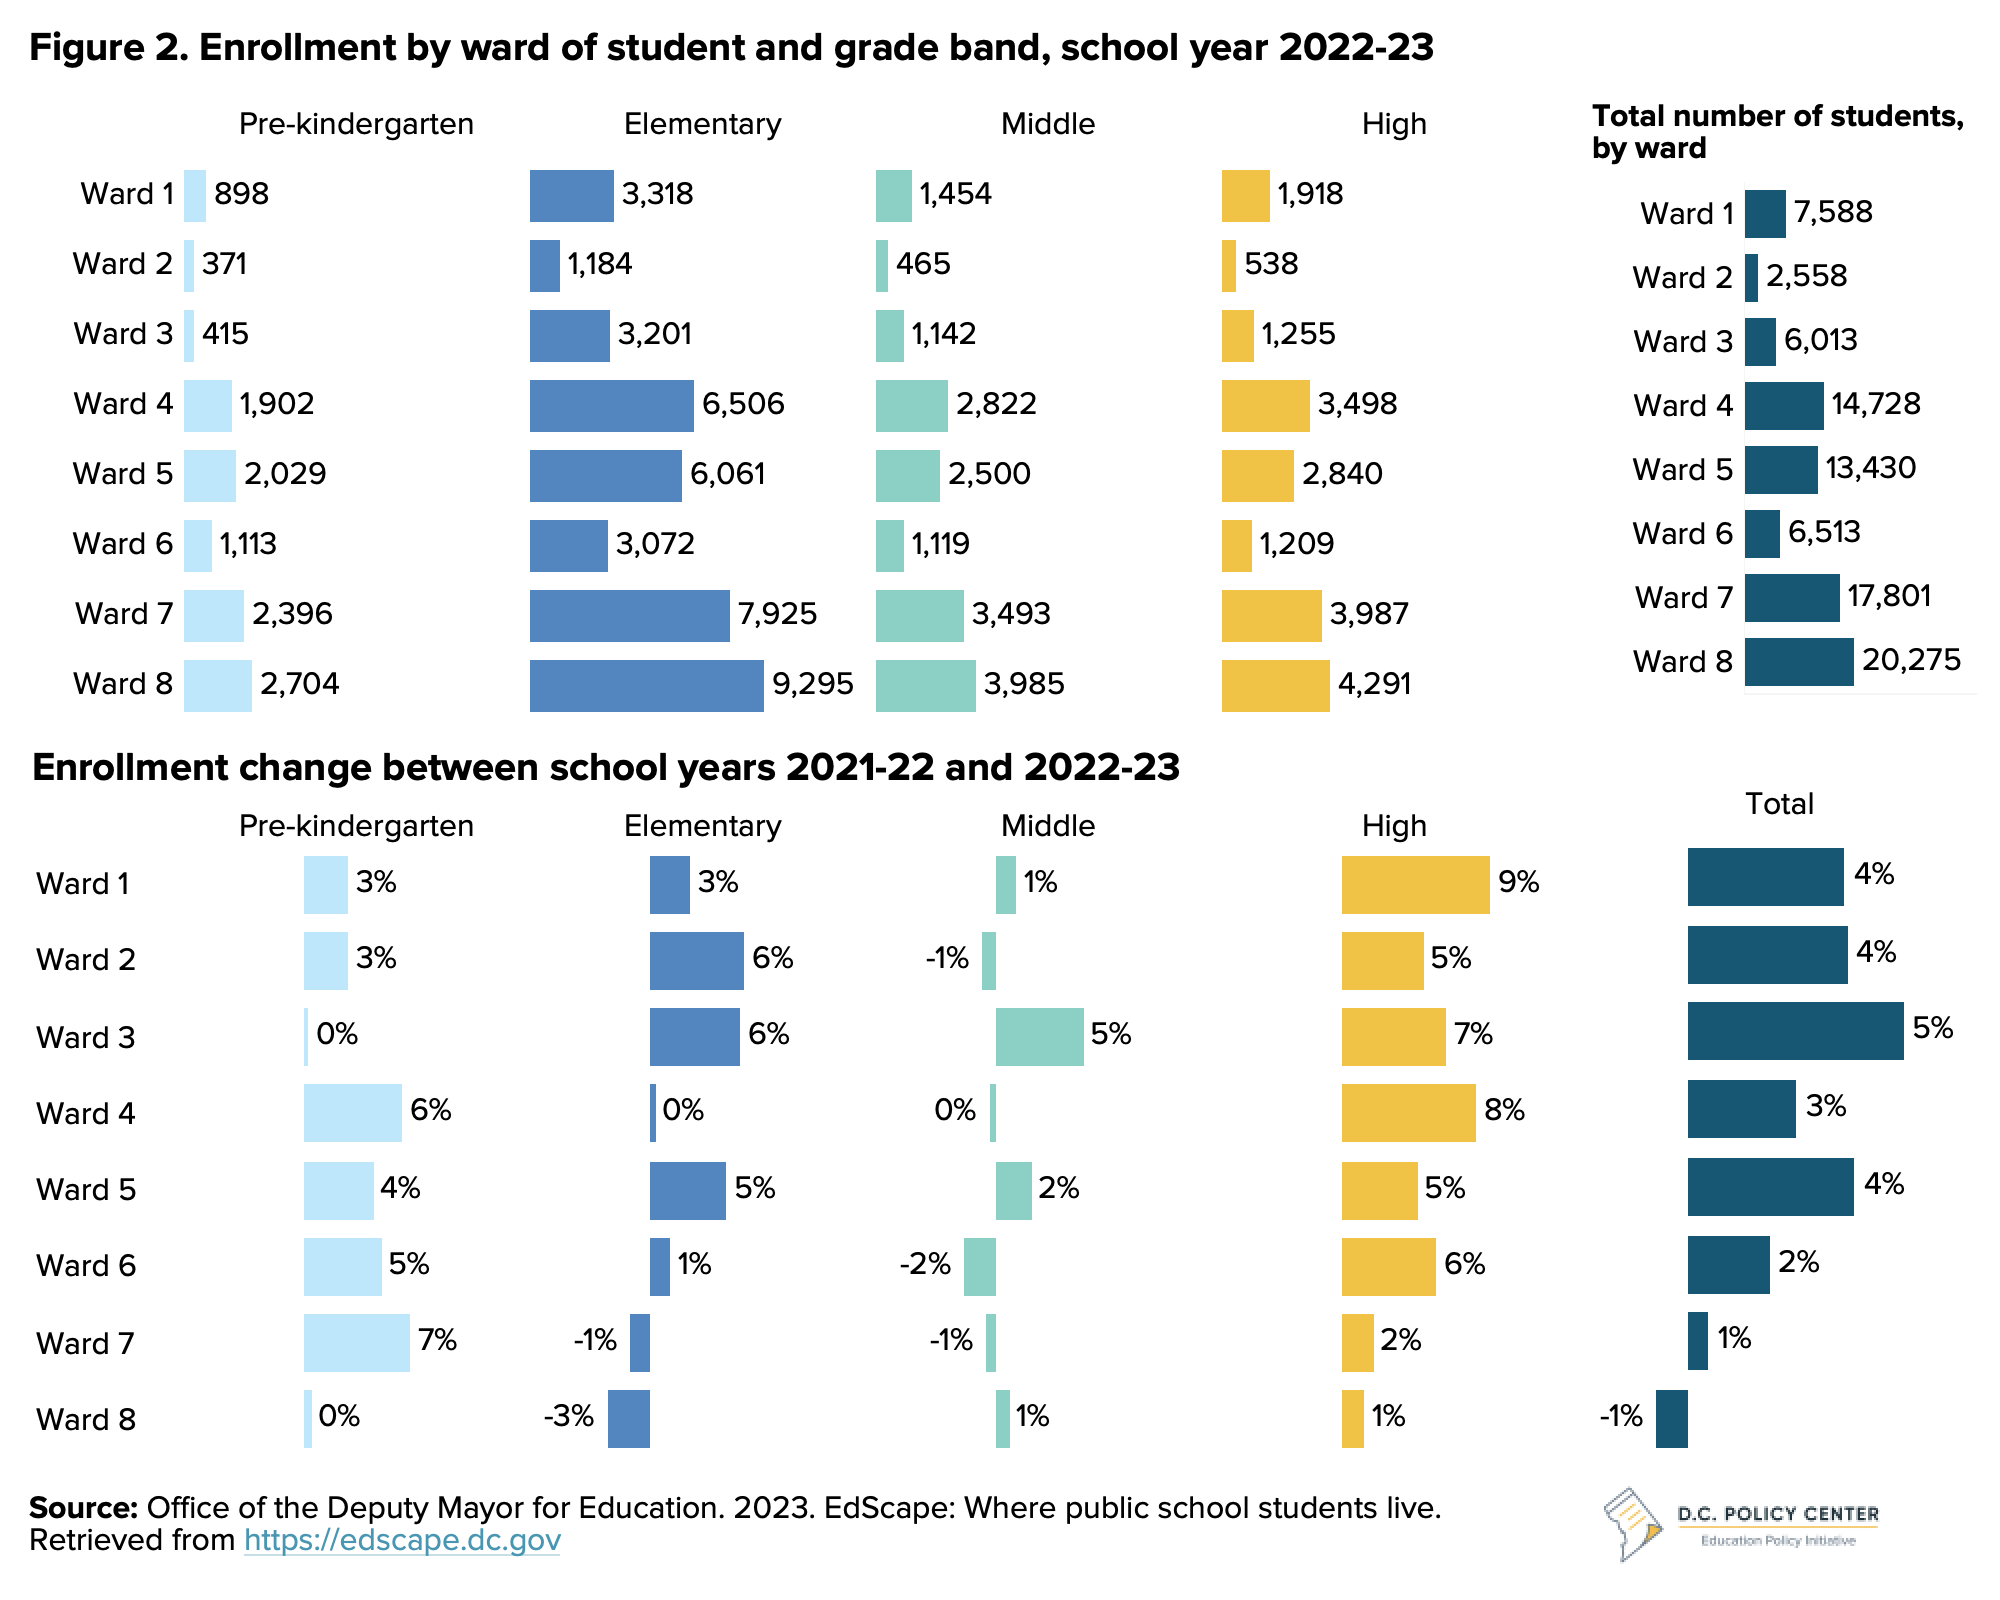
While 42 percent of D.C.’s public school students live in wards 7 and 8, enrollment growth is not fastest in these wards (see Figure 2). In Wards 1, 2, 3, and 5, enrollment grew by at least 4 percent, or twice the rate of overall growth across the entire city, between school years 2021-22 and 2022-23. Over this same period, enrollment in Ward 7 grew by 1 percent and enrollment declined by 1 percent in Ward 8.
One bright spot for Ward 7 is pre-kindergarten enrollment, which grew by 7 percent. Elementary school enrollment grew fastest in Wards 2, 3, and 5. Ward 3 experienced a 5 percent increase in middle school enrollment, growing five times the city average, and Wards 1, 3, and 4 experienced the highest enrollment growth at the high school level.
Special populations
In D.C., Local Education Agencies (LEAs) receive additional funding for certain populations, including students who are designated as “at-risk,” students who are English learners, and students with disabilities.
In school year 2022-23, 52 percent of D.C.’s public school students were designated as at-risk for academic failure, an increase of 3 percentage points from the previous school year (see Figure 3). Growth in the share of at-risk students is partly driven by more students being eligible for SNAP and TANF benefits; between school years 2021-22 and 2022-23, the percent of students in this category increased by 3 percent.7
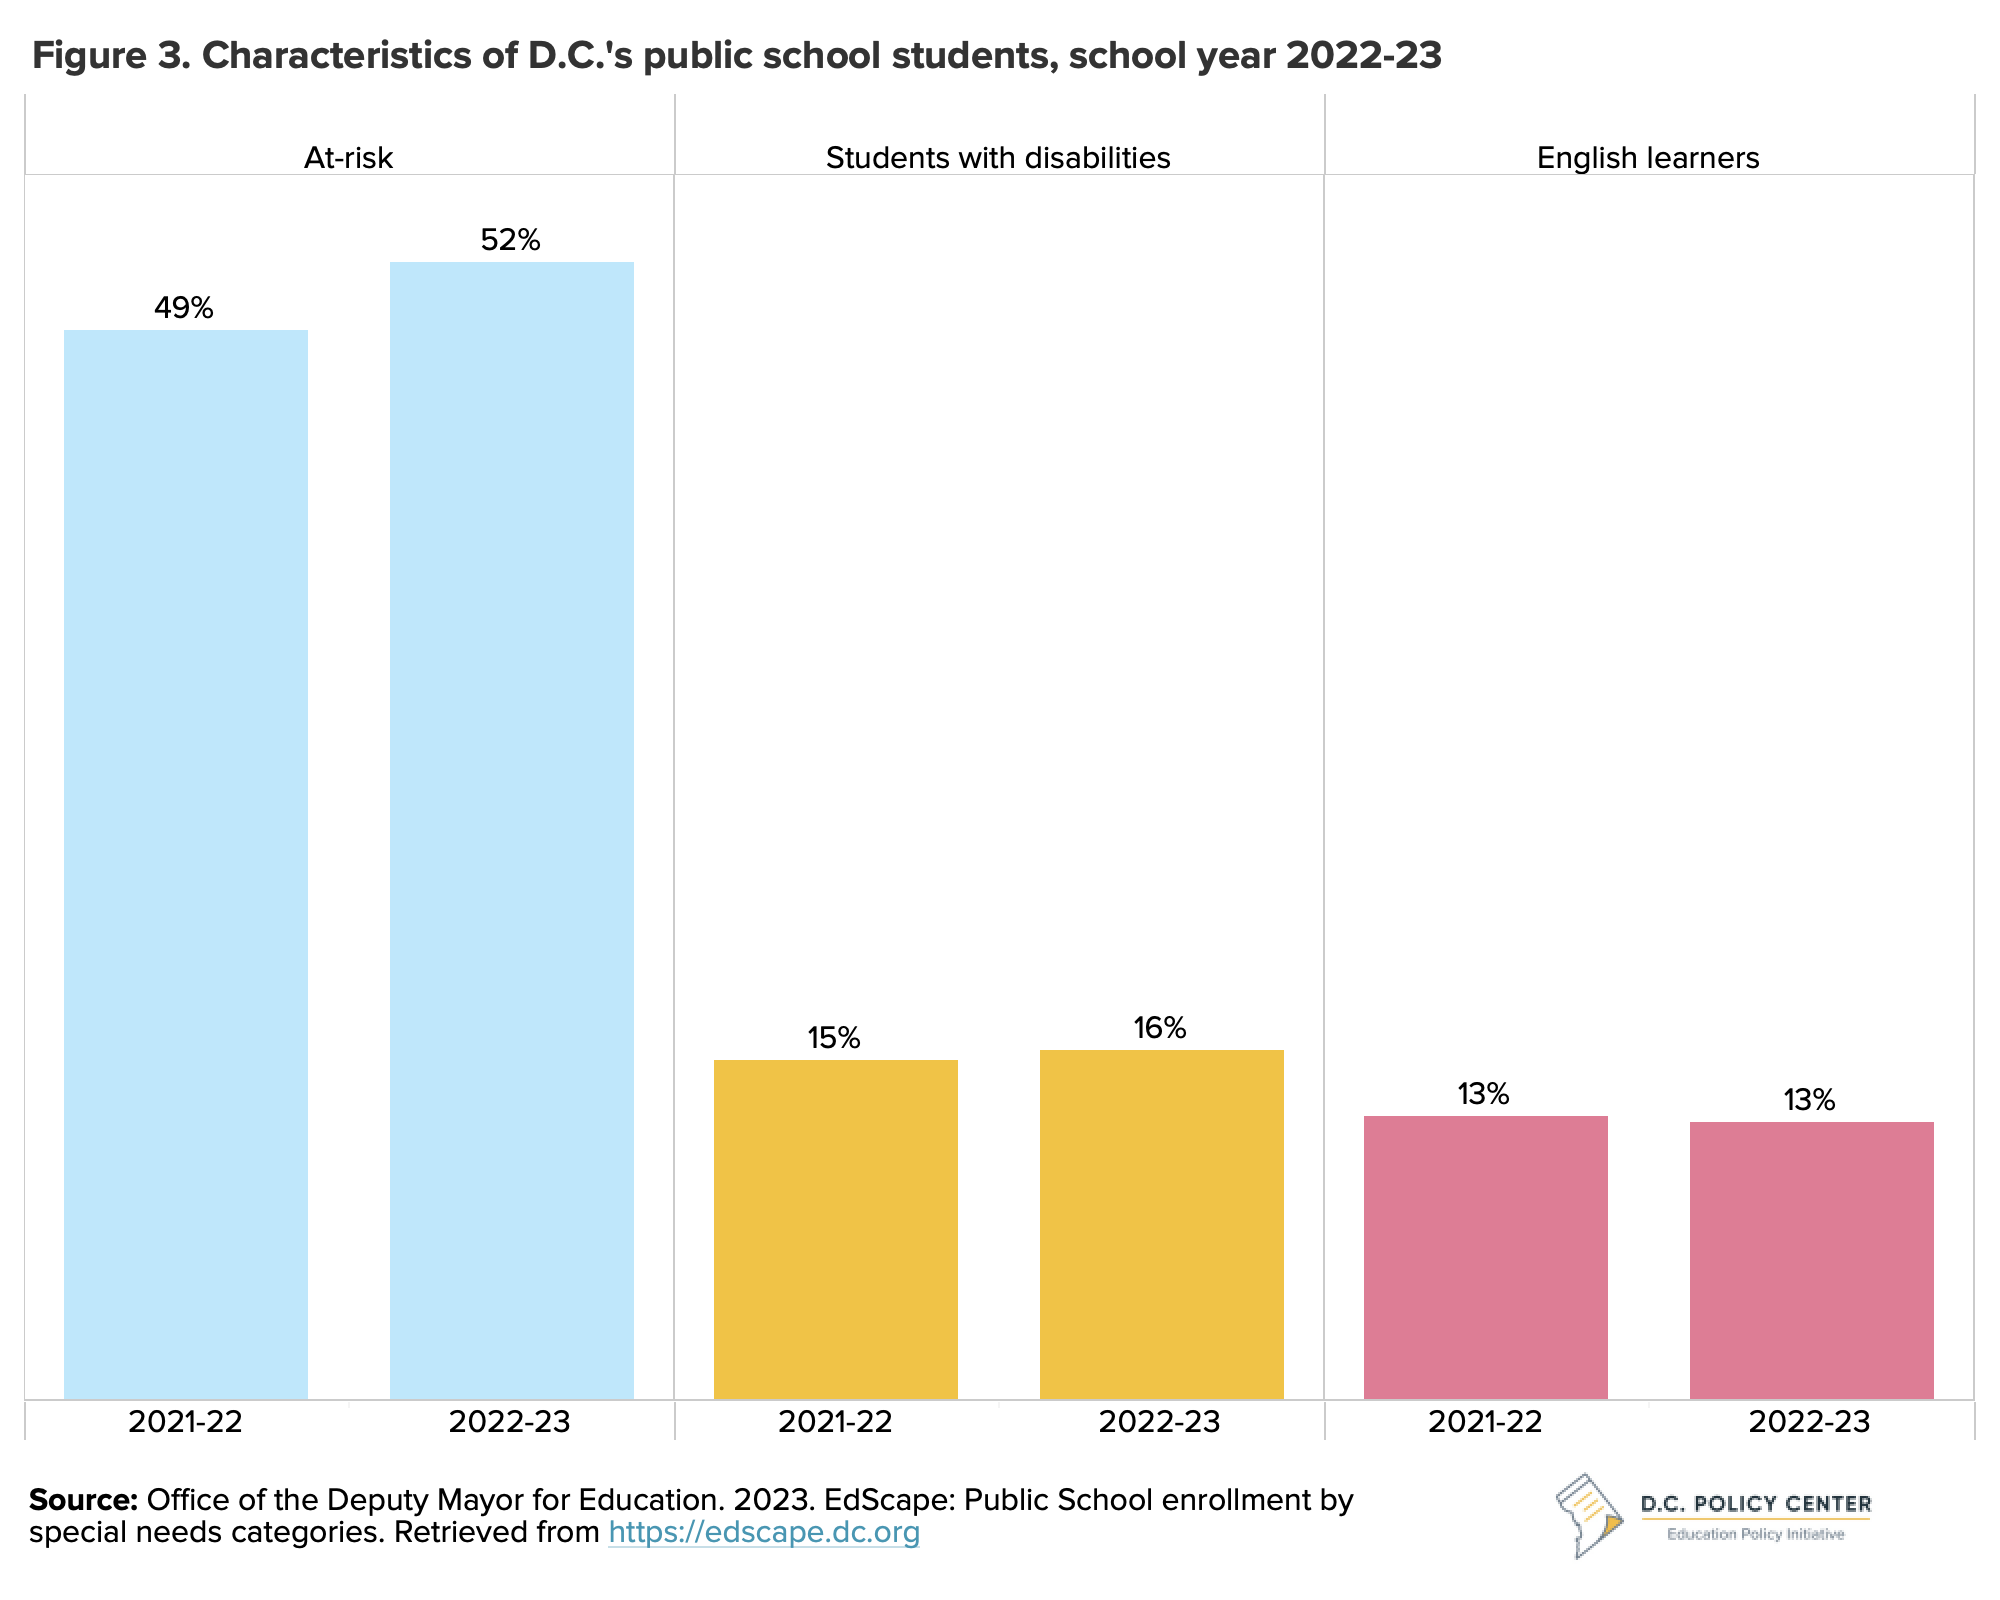
In addition, students with disabilities made up 16 percent of the D.C. school population in school year 2022-23, an increase of 1 percentage point over the previous school year. This slight increase could be due to the first year of implementation of OSSE supports and professional development required by the Addressing Dyslexia and Other Reading Difficulties Amendment Act of 2020,8 which may have helped to earlier identify students with reading disabilities. It could also be the result of the return to in-person learning, which makes it easier to identify some special needs.
Lastly, the share of students who are English learners remained steady at 13 percent. But there was a change in how these students move out of English learner status. Previously English learners had to score a 5.0 on the ACCESS assessment to exit English learner status.9 School year 2022-23 was the second year after OSSE adopted modified exit criteria for English learners to need a 4.5 score on the ACCESS assessment to exit the English learner program.10
Race and ethnicity
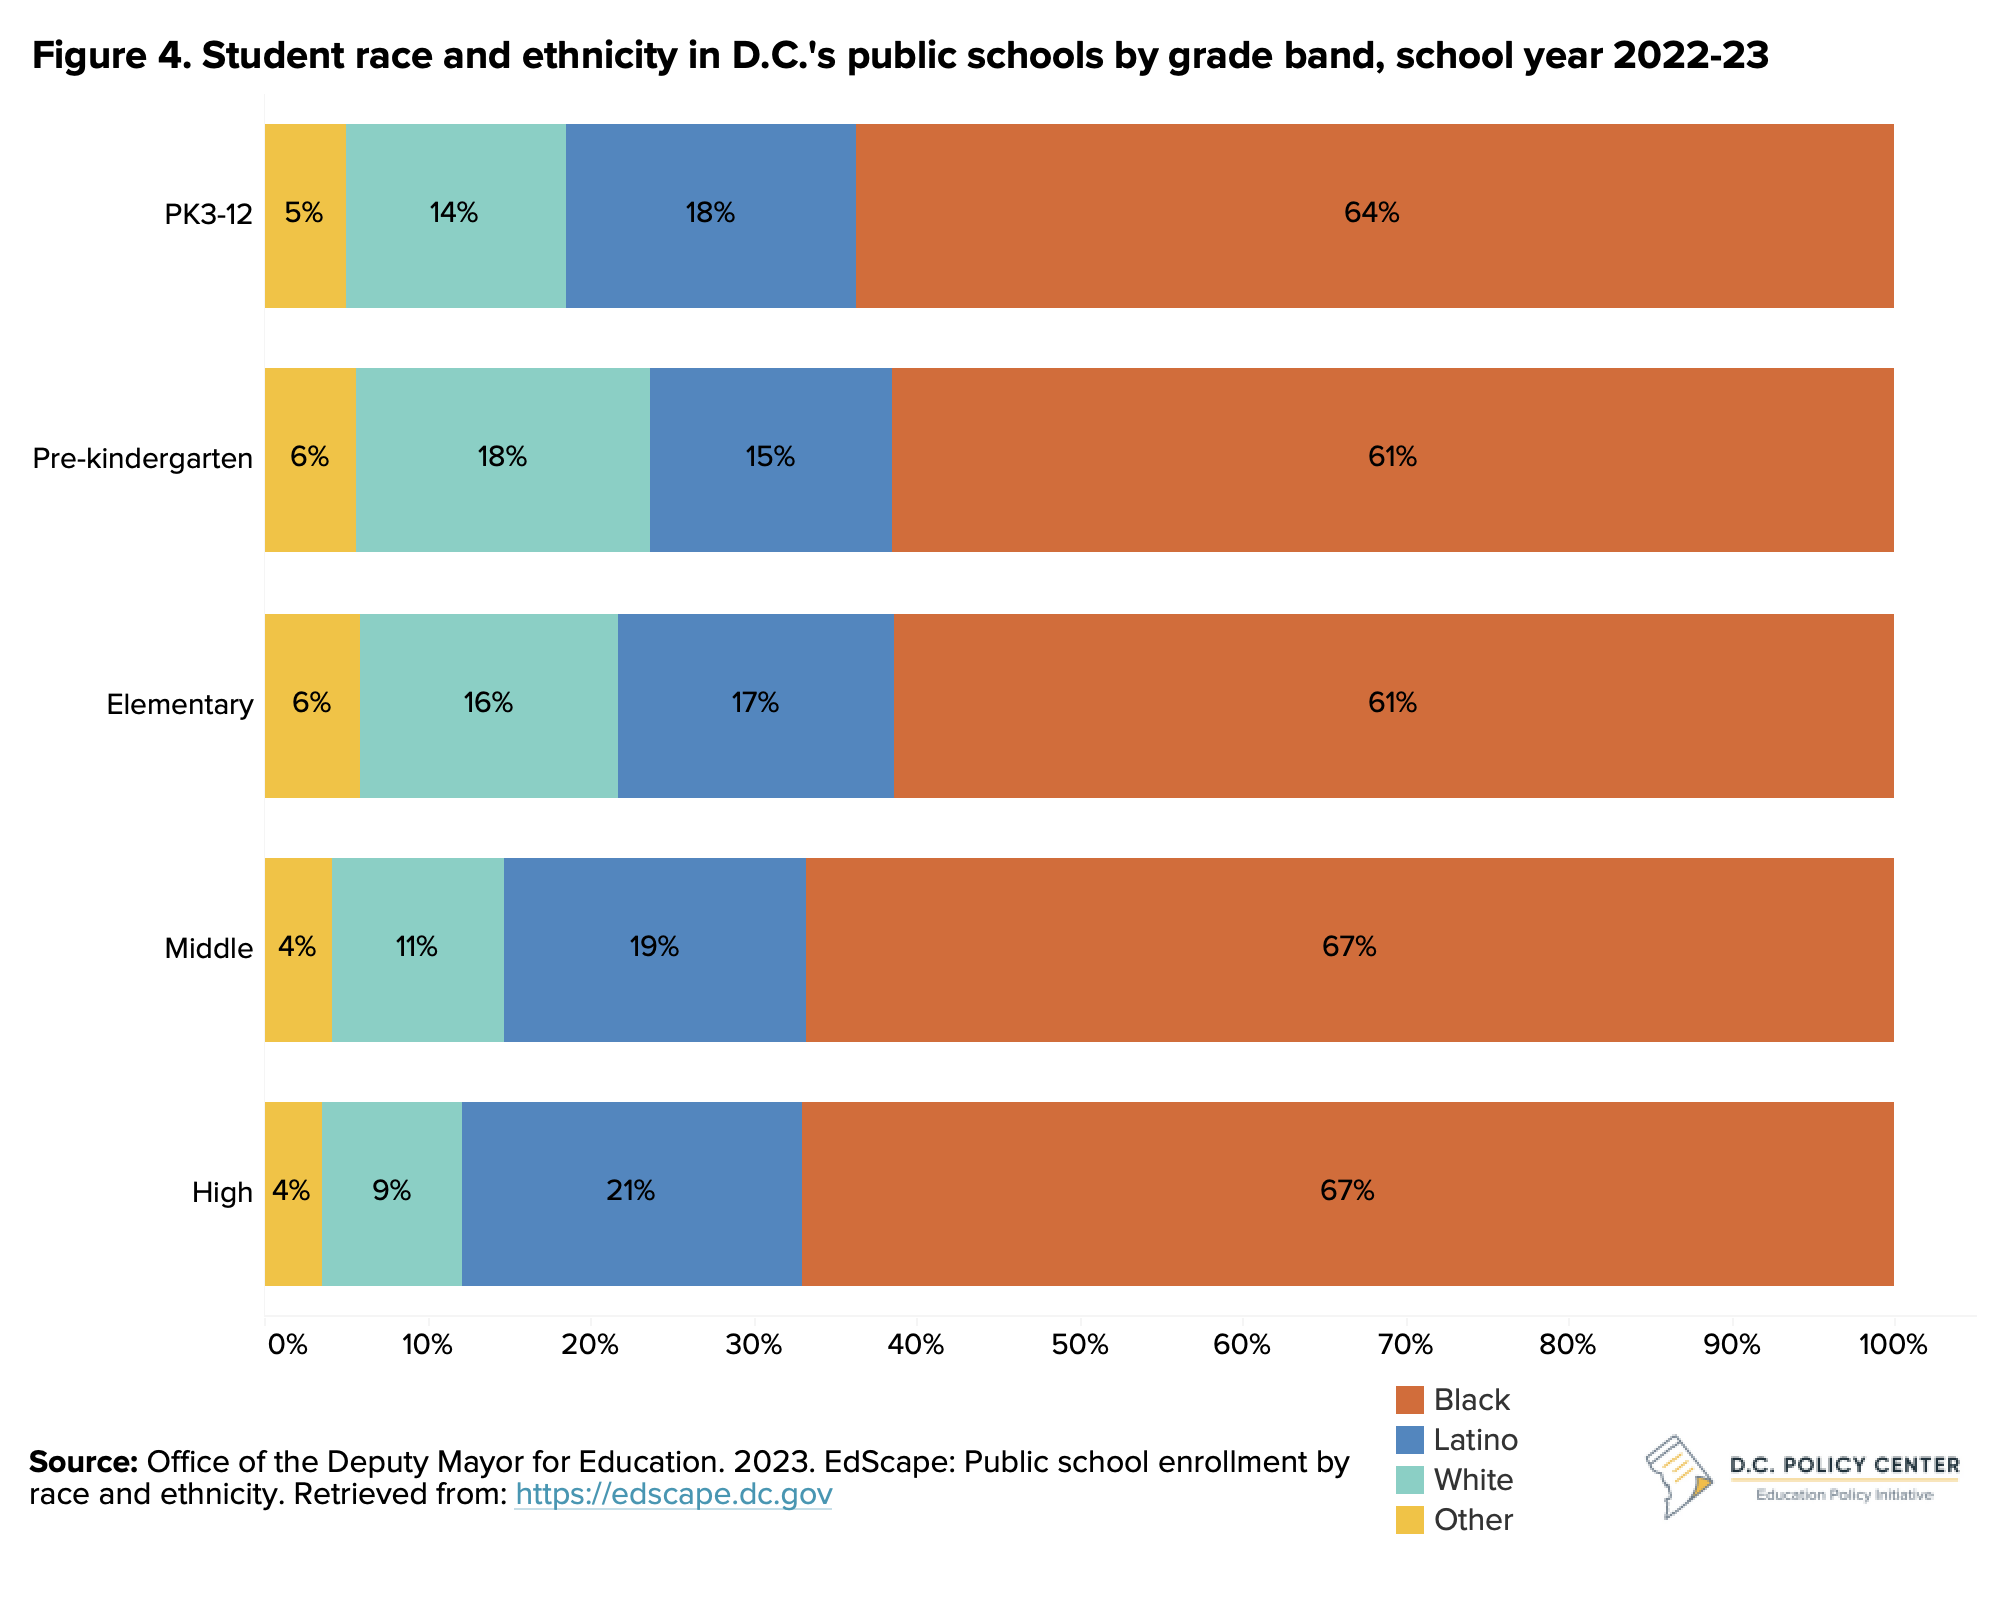
In school year 2022-23, schools served mostly students of color (see Figure 4) in similar proportions to the previous year. Across all grades, 64 percent of students were Black (1 percentage point decrease), 18 percent were Latino (1 percentage point increase), 14 percent were white (increase of 1 percentage point), and 5 percent were other races or ethnicities (including two or more races, Asian, and Native Hawaiian or other Pacific Islander).11 Pre-kindergarten had the largest share of white students (18 percent), but this share decreased to 9 percent in high school.
Enrollment by sector
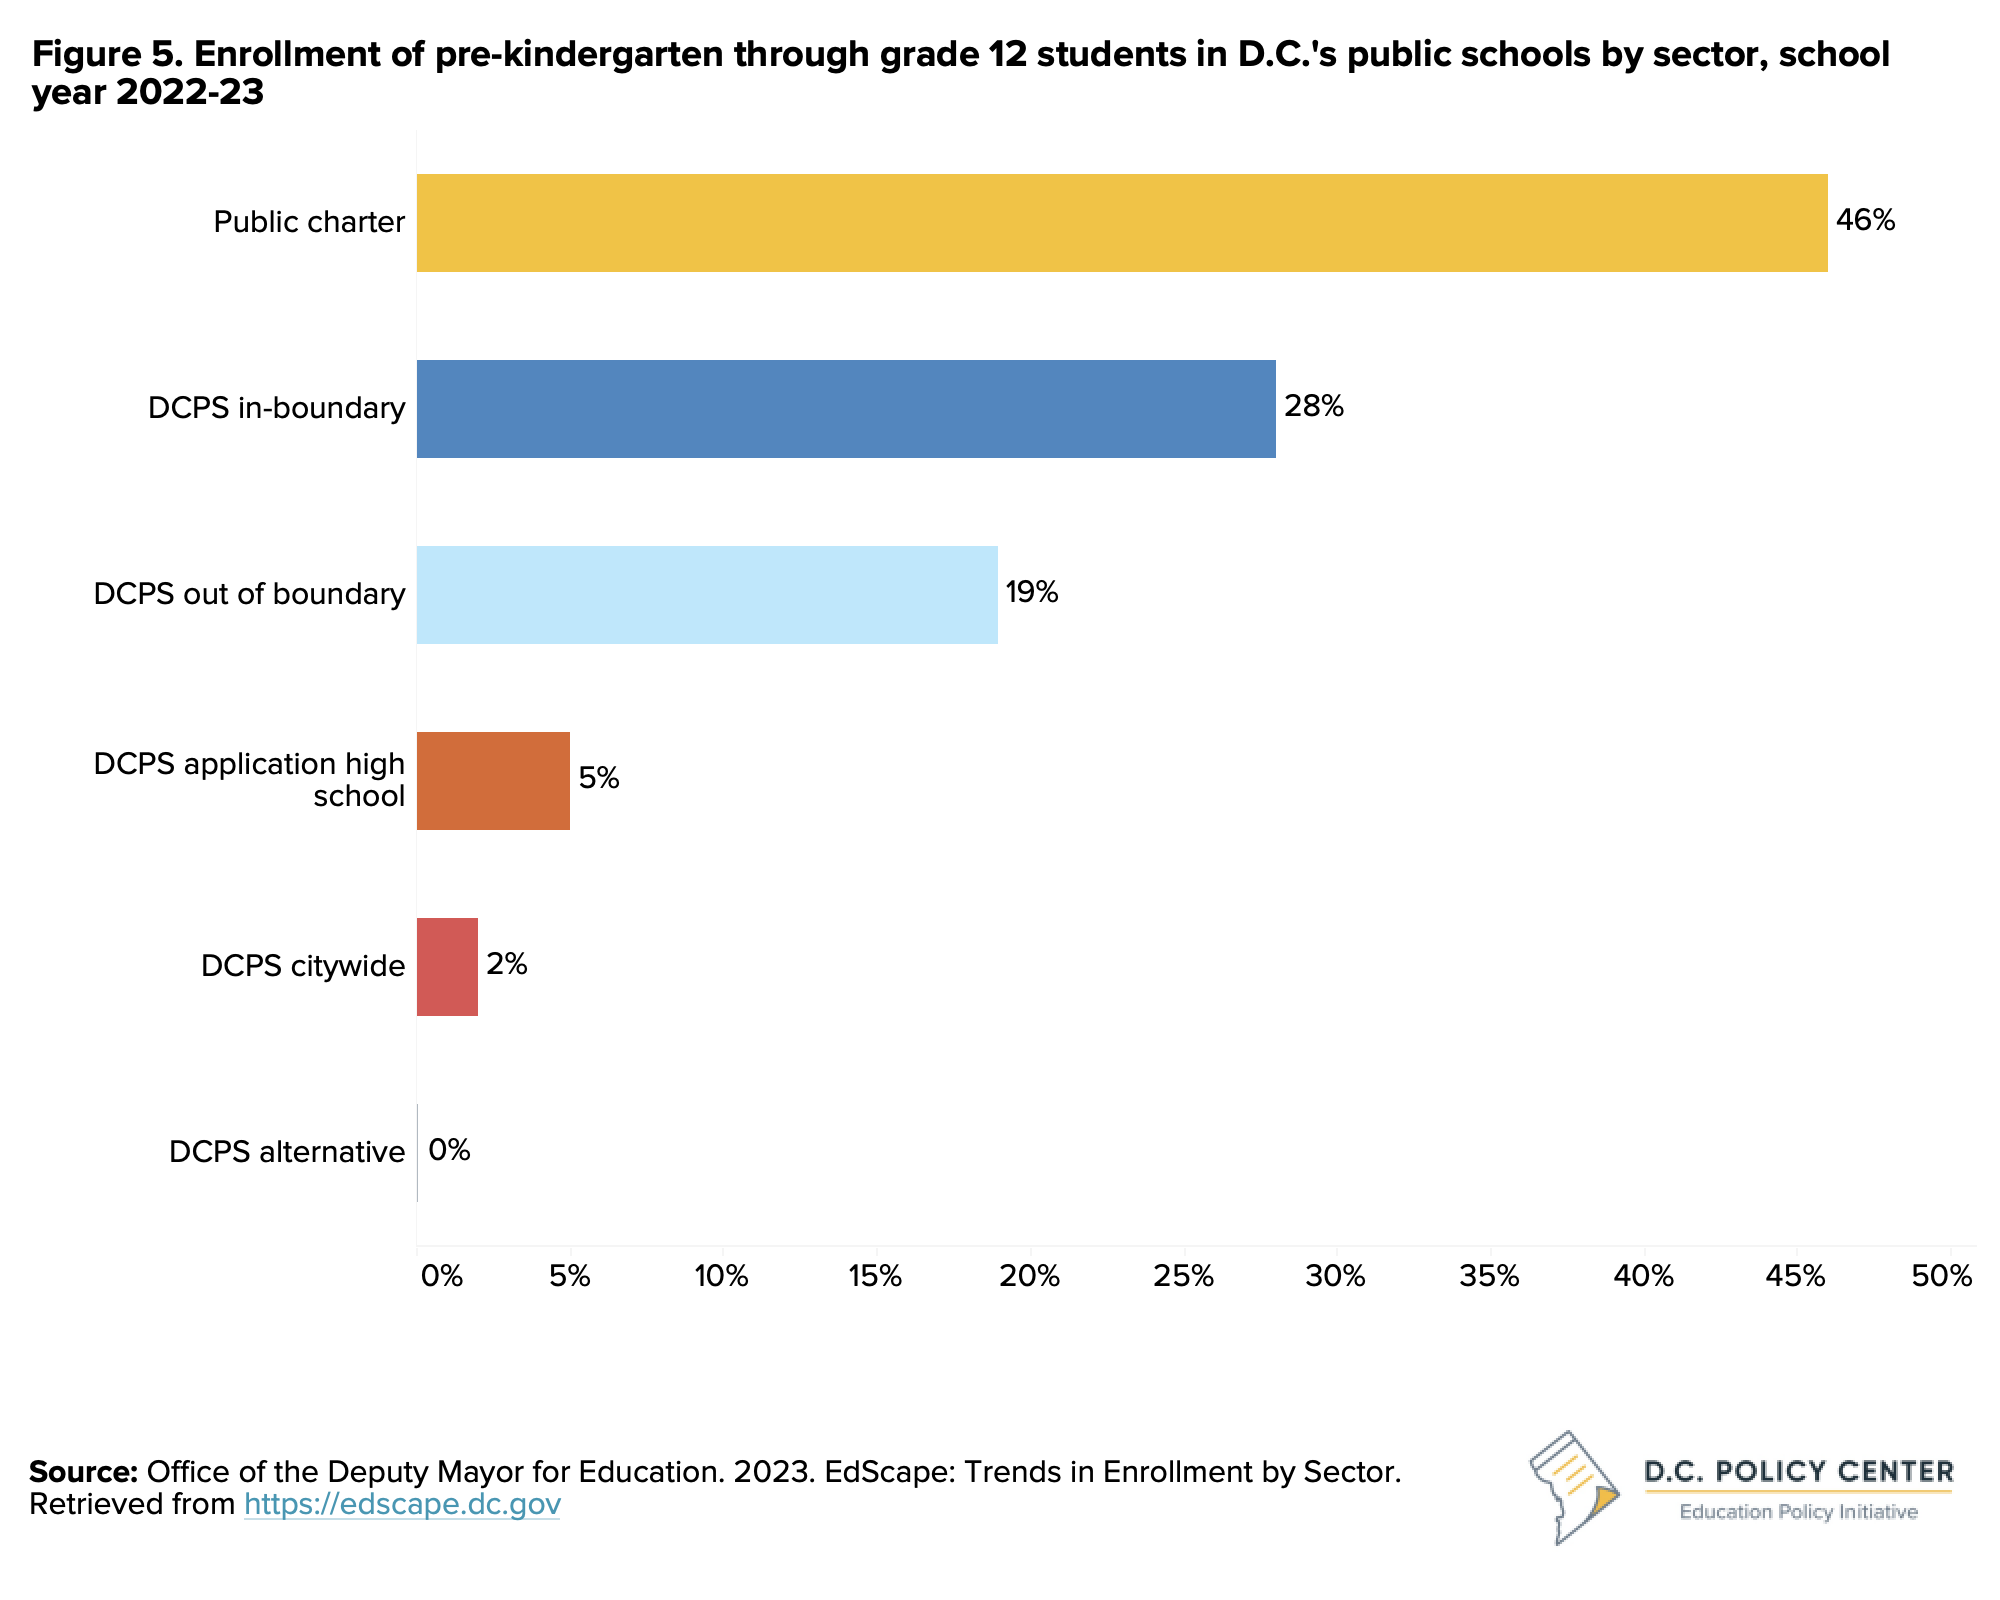
In school year 2022-23, 46 percent of pre-kindergarten through grade 12 students were enrolled in public charter schools. This was identical to the share in the previous year. The remaining 54 percent enrolled in District of Columbia Public Schools (DCPS) schools, with 28 percent of students attending their by-right school as determined by residence, 19 percent attending a DCPS by-right school as an out-boundary student, 5 percent attending a DCPS application high school, and 2 percent attending a DCPS citywide school (see Figure 5).
Adult, alternative, and special education school learners
D.C. publicly funds 14 adult and alternative public schools comprised of 11 public charter schools and three DCPS schools that provide opportunities to earn high school degrees, gain English language skills, or enroll in workforce training.12
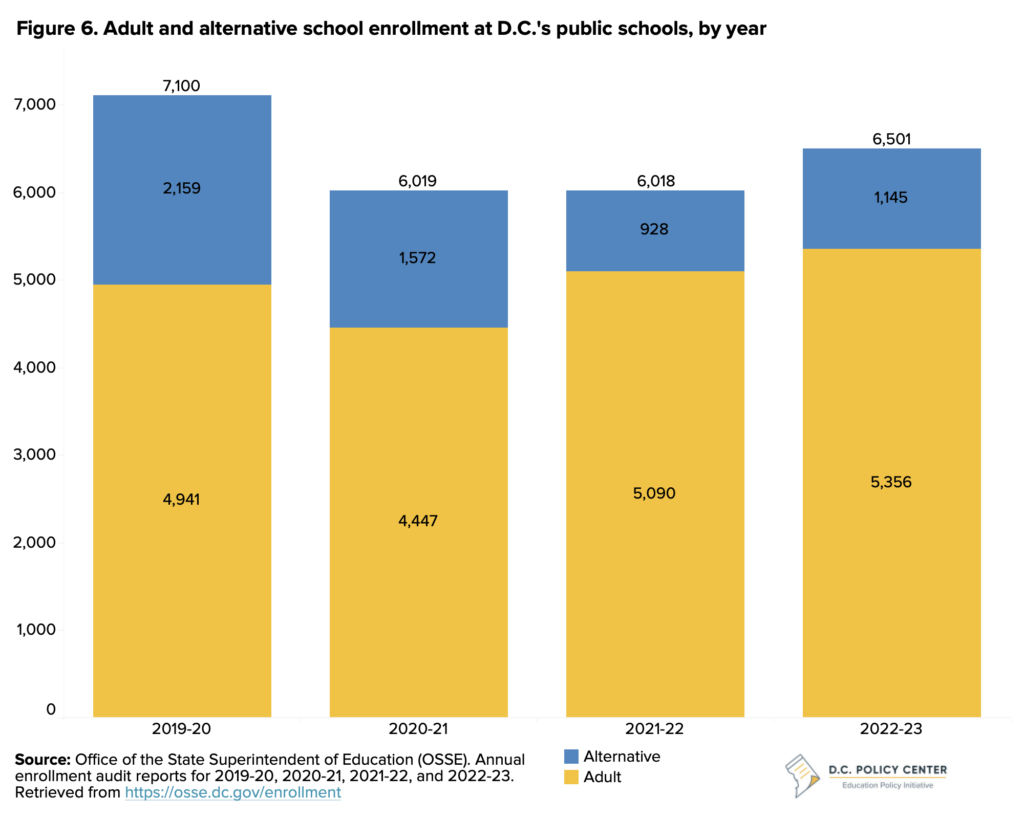
In school year 2022-23, 6,501 adult and alternative learners were enrolled in D.C.’s public schools, reflecting an 8 percent increase over the previous year. However, this number is still 599 below pre-pandemic levels (see Figure 6). Most learners were Black or Latino, resided in Wards 4 and 8, and reported speaking a language other than English at home.13
In addition to schools for adult and alternative learners, D.C. has two specialized schools that serve special education students with greater levels of need (St. Coletta PCS and River Terrace Education Campus). Enrollment for special education students at these schools has increased to 366 students—a 4 percent increase from the previous school year.
Outcomes
Post-pandemic student outcomes are mixed, with increases to learning achievement and postsecondary enrollment that remain below pre-pandemic levels, and high school graduation rates that continue to increase. New student-level data on postsecondary completion showed that of every 100 9th graders in school year 2011-12, 18 completed postsecondary education within six years of graduating high school (by the spring of 2021). For a national comparison, as of 2022, 47 percent of the population age 25 or older had at least an associate’s (10 percent) or bachelor’s degree or higher (37 percent).14
New School Report Card
OSSE implemented a new school report card in school year 2022-23, with new metrics of five-year graduation rates, high school student growth to proficiency, and AP/IB/Dual Enrollment participation rates.15 In addition, the “at-risk” student group has been replaced as “economically disadvantaged” students, defined as students who qualify for TANF or SNAP, have been homeless during the academic year, and/or are under the care of the Child and Family Services Agency (CFSA or “foster care”). It excludes the overage and in high school group included in the at-risk designation. The new approach also replaced school ratings with a summative score.
ELA and math learning outcomes
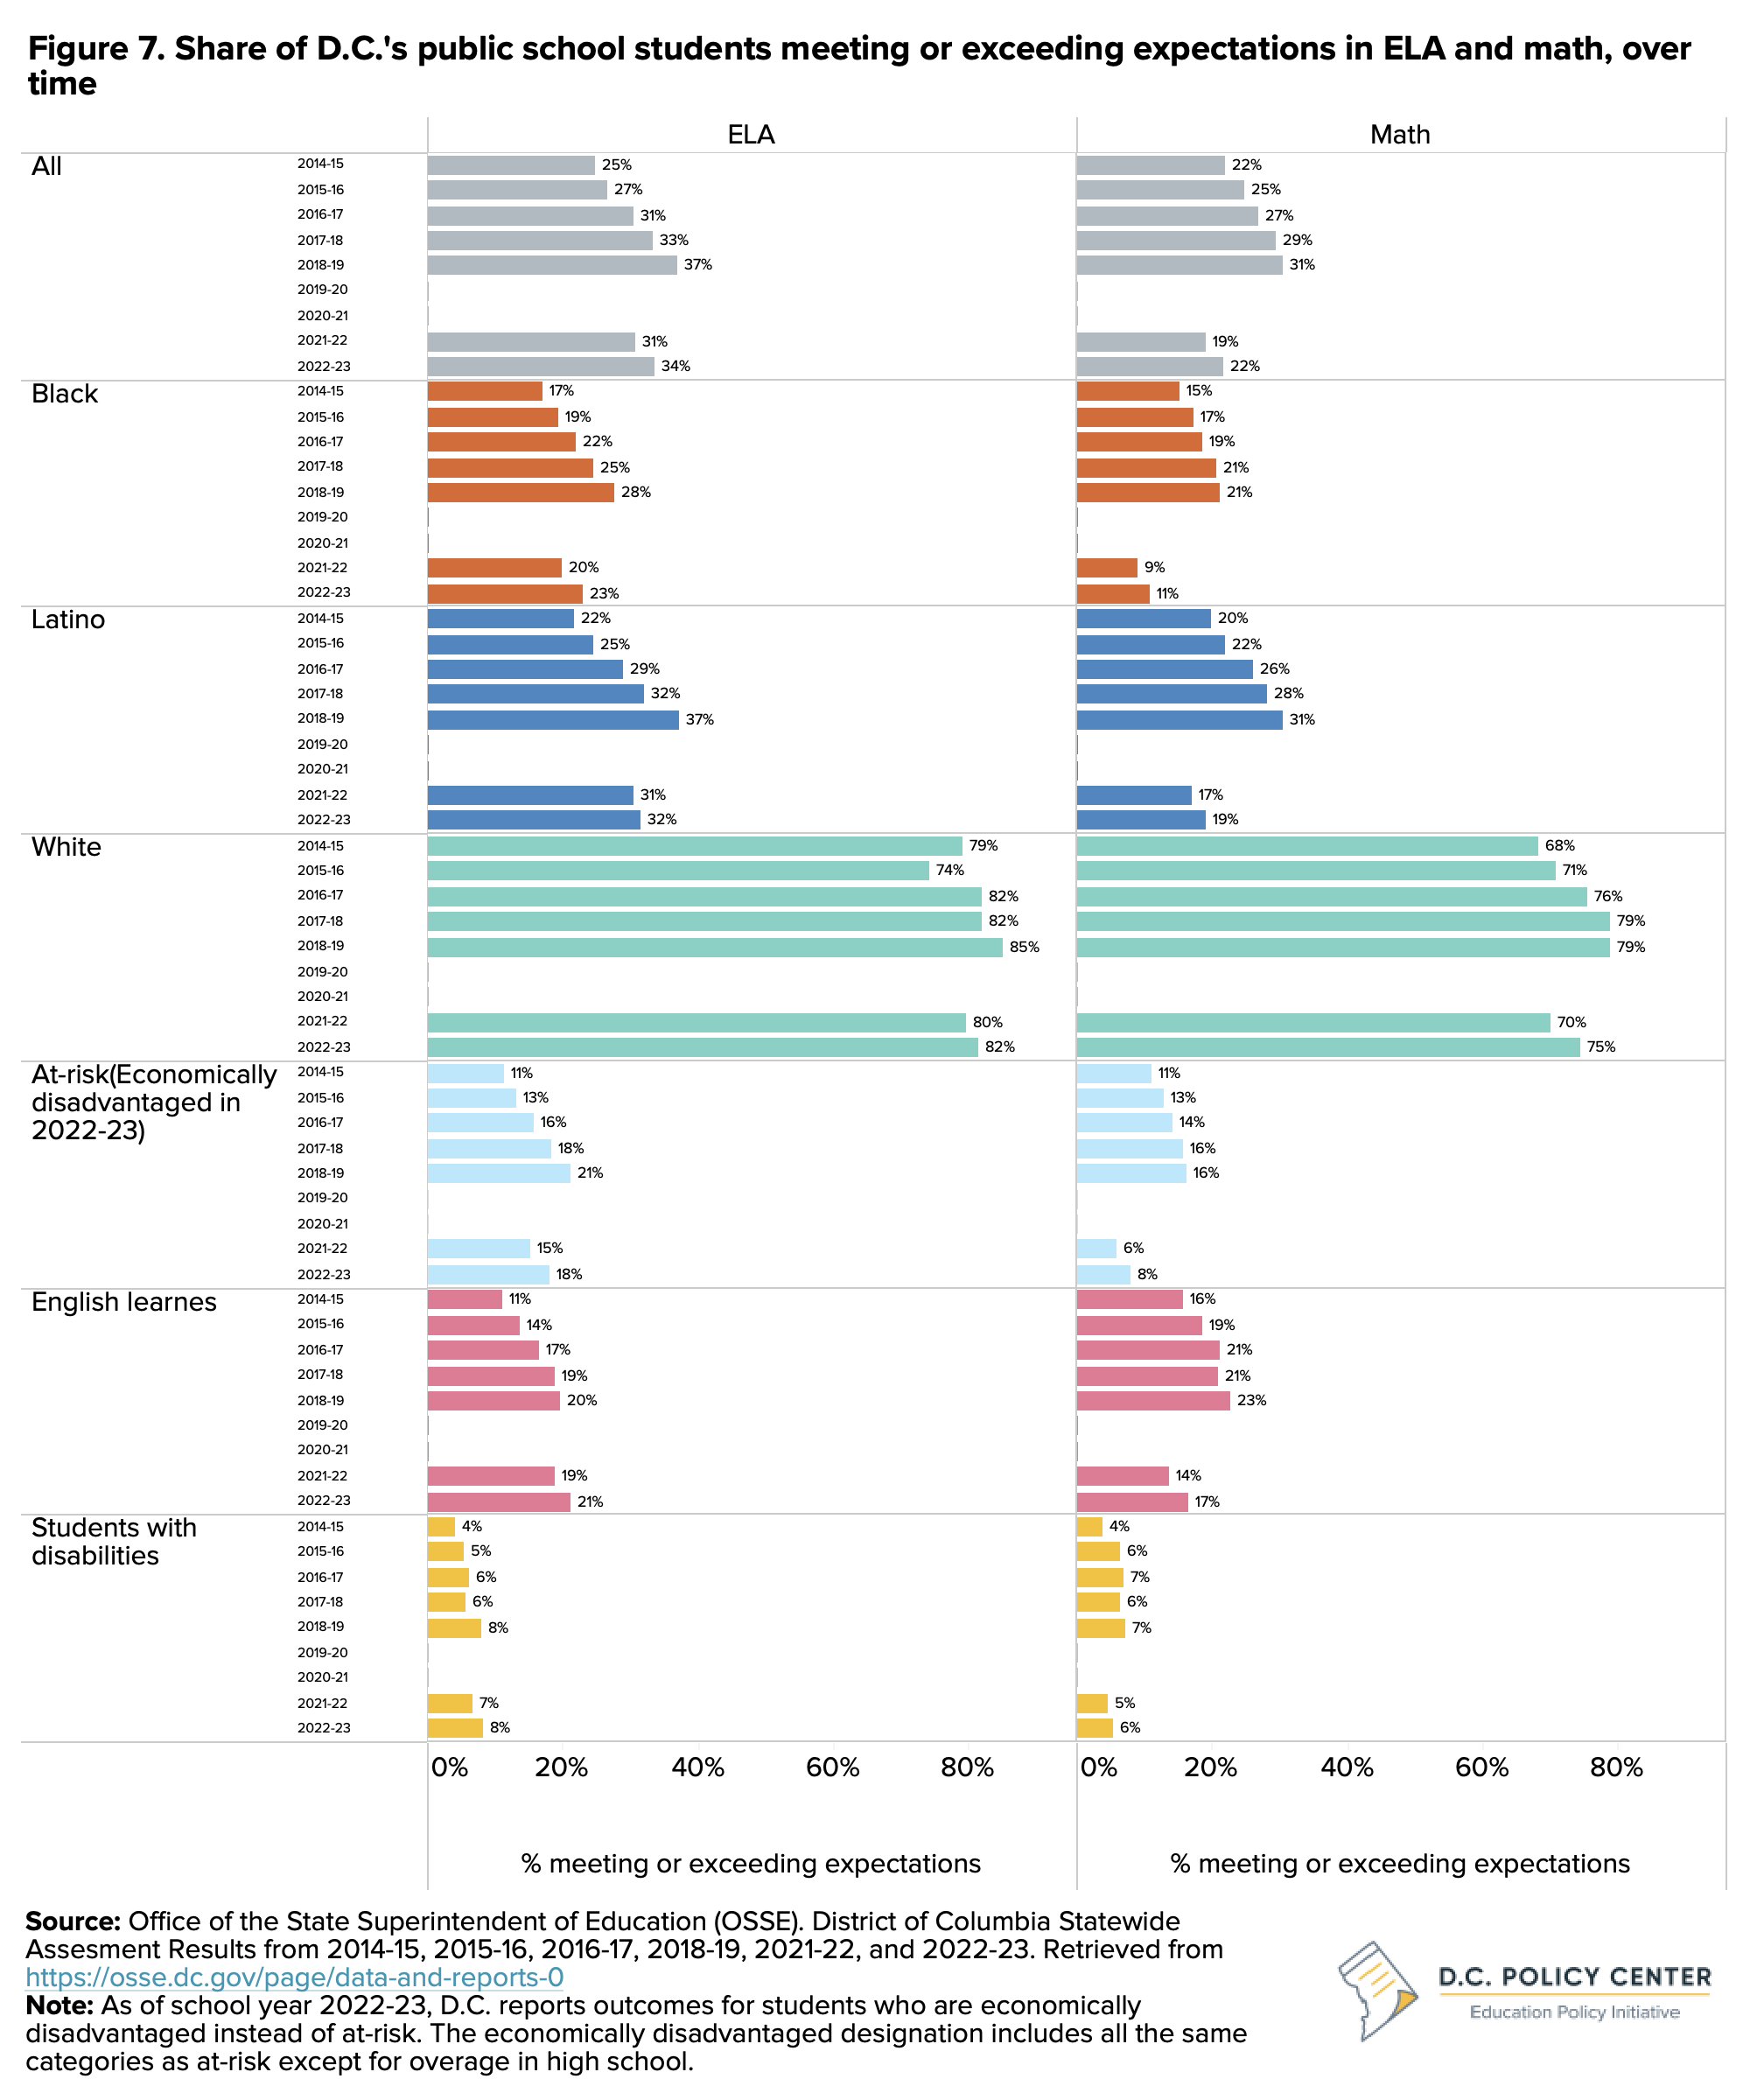
In school year 2022-23, D.C. administered the state assessment, the Partnership for Assessment of Readiness for College and Careers (PARCC), for the second time after a two-year pause during the pandemic. Between school years 2021-22 and 2022-23, the share of students meeting or exceeding expectations increased by 3 percentage points in both ELA and math (see Figure 7).
These assessed gains are on par with annual pre-pandemic gains (an average of 2.5 percentage points) but not enough to make up for the learning loss students experienced during the pandemic. For example, ELA scores increased from 31 percent to 34 percent for all students, but they are lower than the pre-pandemic high of 37 percent in school year 2018-19 and returning to the levels of five years ago. For math, students gained 3 percentage points to reach 22 percent, but these results are 9 percentage points lower than pre-pandemic highs. In fact, they have returned to the levels of eight years ago.
Learning outcomes were lowest for students with disabilities. Among this group, only 8 percent met or exceeded expectations in ELA, and only 6 percent in math. Among economically disadvantaged students (a narrower category than at-risk from previous years for high school students), 18 percent of students met or exceeded expectations in ELA and 8 percent met or exceeded expectations in math. More so, achievement gaps increased for Black and Latino students when compared to white students in math and for Latino students in ELA. In addition, Latino students had similar achievement levels to all students pre-pandemic and are now behind the D.C. average.
DCPS 6th grade academies
In school year 2023-24, the District of Columbia Public Schools (DCPS) launched 6th grade academies, a new initiative to support the transition from elementary to middle school.16 These new academies are built upon D.C.’s summer bridge program, a week long program sixth graders participate in where they attend field trips, participate in scavenger hunts and team building exercises, and build relationships with other students and teachers.17
The 6th grade academies will launch in 11 schools, serving 1,400 students all attending Title I schools. The goal of this program is to increase attendance, academic success, and students’ sense of belonging. Each participating school will have an assistant principal working exclusively with 6th grade students and staff. Students will engage in specialized learning experiences and create close community among students and staff.18
Academic growth
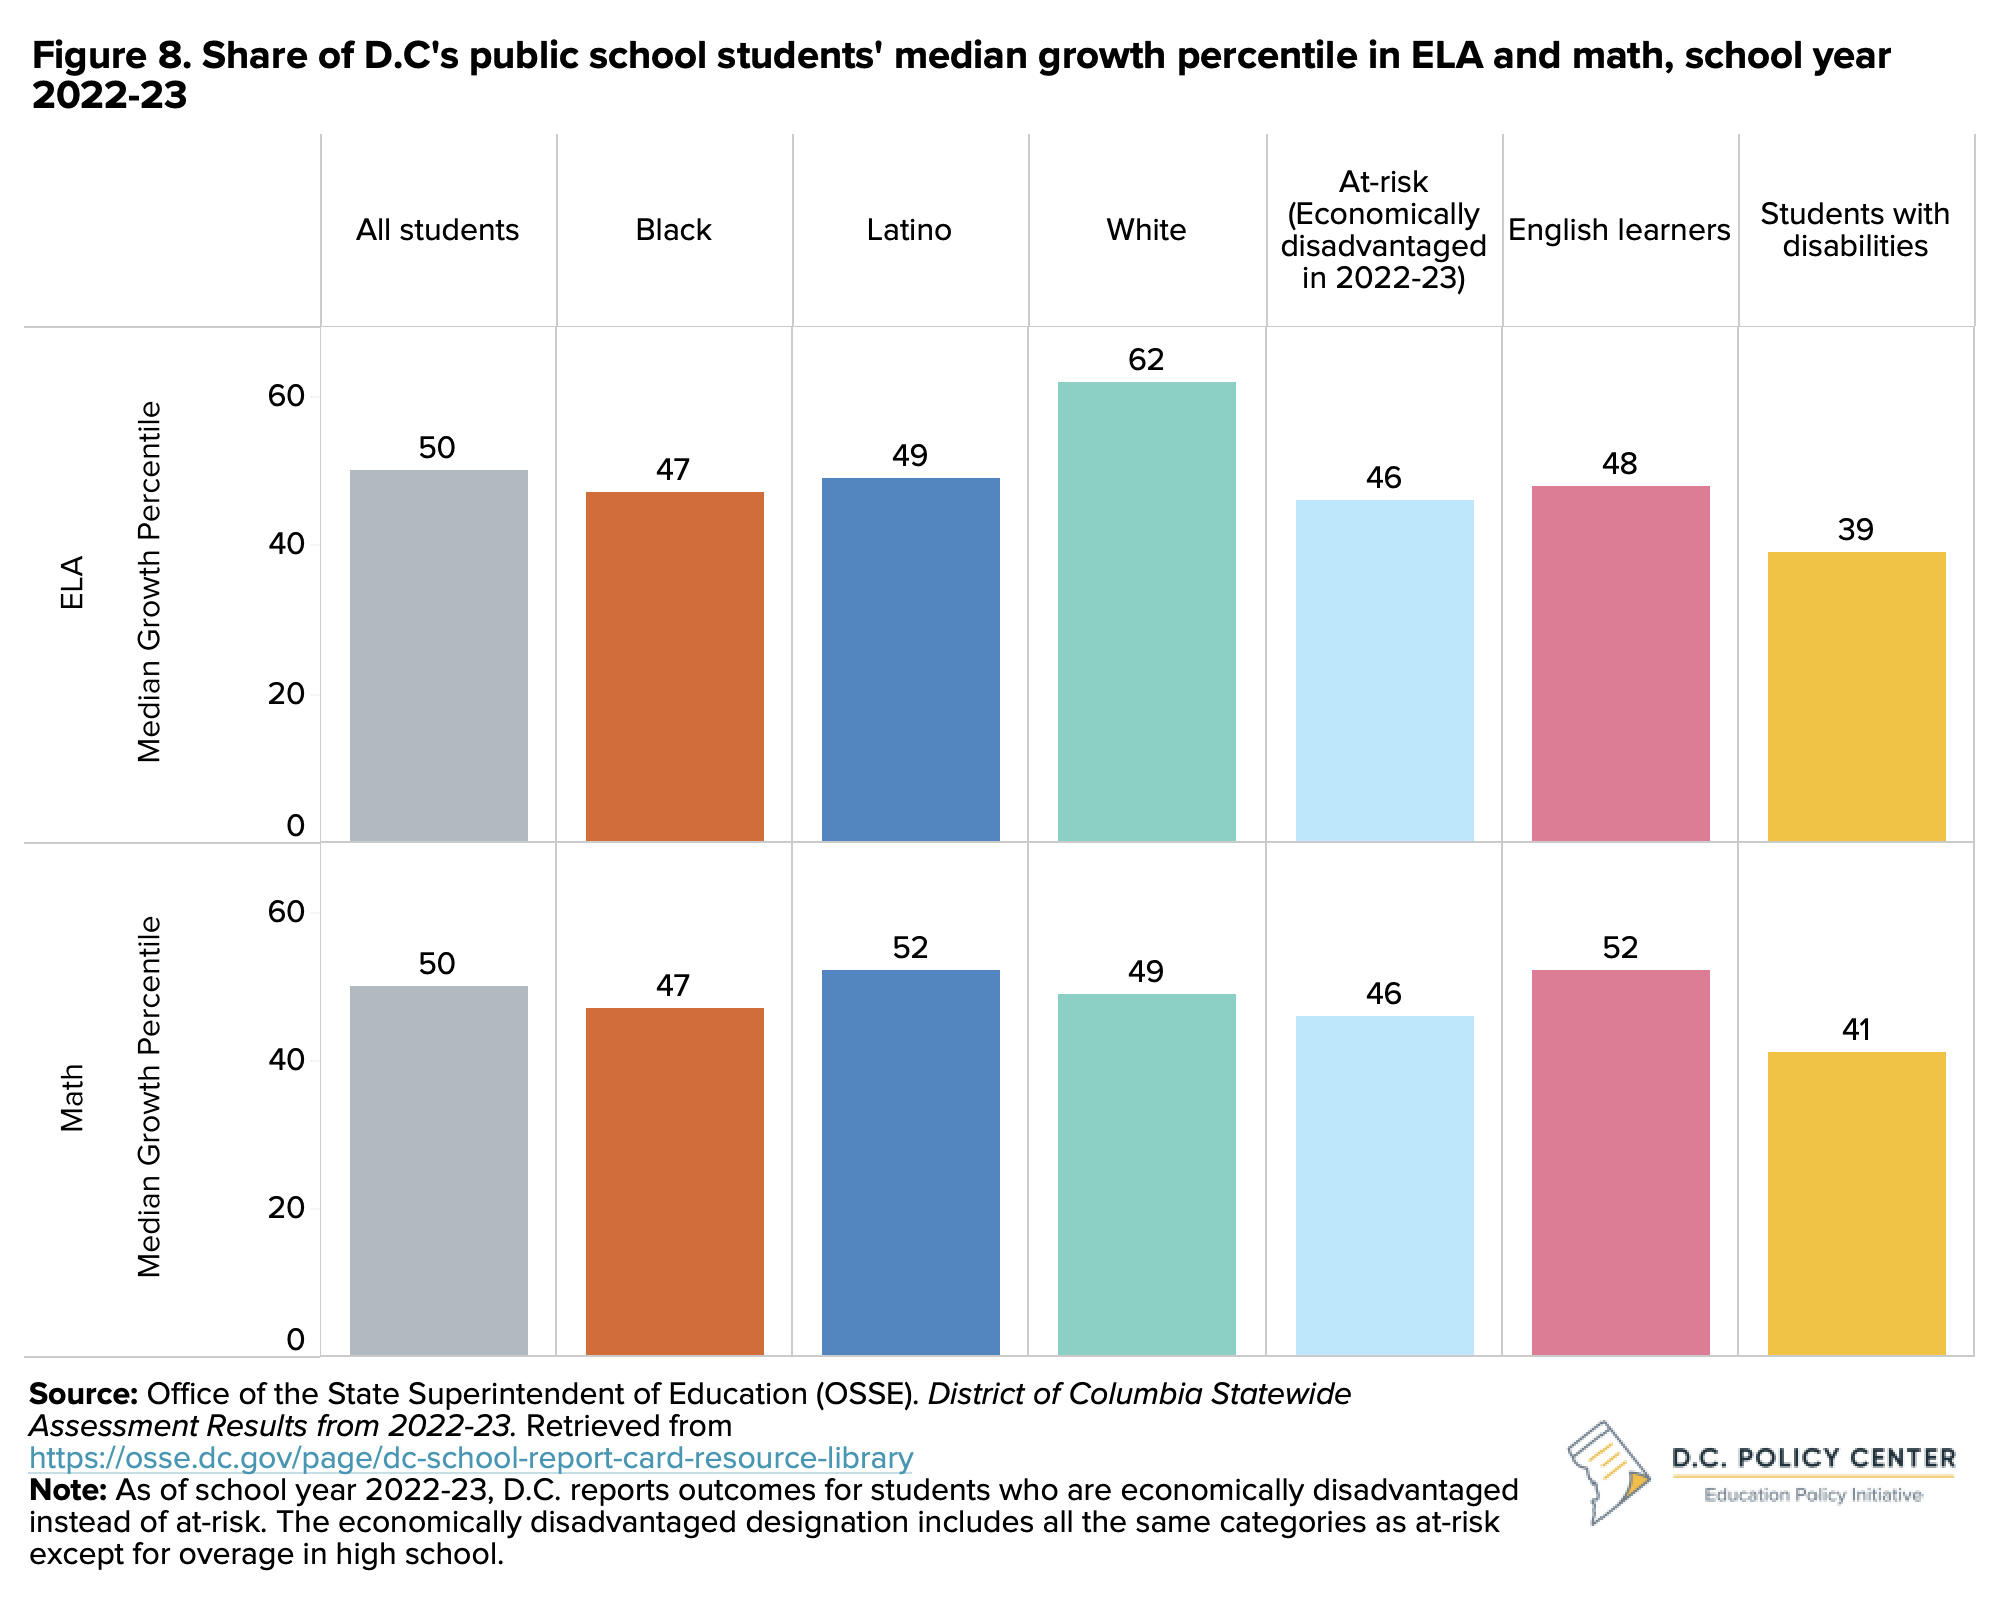
Due to the pandemic pause in statewide assessments, school year 2022-23 was the first year since 2018-19 that academic growth measures were available for D.C.’s students. Academic growth is typically measured by Median Growth Percentile (MGP), calculated by ordering student growth percentiles for all students from smallest to largest and selecting the MGP as the percentile in the middle of that list. This means that half of students in the group have a student growth percentile above the MGP, and half of the students in the group have a student growth percentile below the MGP.
Strong strategies to drive learning
Identified as a Bold school by EmpowerK12, DC Prep PCS Anacostia Middle attributed their strong academic gains to utilizing data to inform intervention in small groups, coming back the DC Prep model and culture systems to ensure that school is a place where students care about their growth and learning, and investing in developing teachers through live coaching and collaborative planning meetings. Also identified as a Bold school, Rocketship Infinity PCS said their strong academic results came from considering the needs of the community, including families and staff, to ensure they were able to focus on academics. They also heavily invested in professional development, about 300 hours per year for coaching, modeling, and co-teaching by assistant principals.
In the past, the MGP was calculated across all students in all school districts that participated in the PARCC exams. Because many other school districts have left the PARCC consortium, MGP only includes D.C. students and the median for one district is by definition 50—and therefore not comparable to previous years. MGP in math is highest for Latino students (see Figure 8). Students who are economically disadvantaged and students with disabilities had lower MGPs, meaning their achievement improved by less compared to similar students.
Literacy outcomes
In school year 2022-23, D.C.’s public schools invested significant resources in improving literacy rates, in part due to the implementation of the Addressing Dyslexia and Other Reading Difficulties Amendment Act of 2020. OSSE offered professional training to kindergarten, first grade, and second grade educators on recognizing reading difficulties, screening for reading difficulties, and implementing instruction that meets the needs of students with reading difficulties. In addition, educators across all grade bands received awareness training on reading difficulties.
D.C. Reading Clinic
The D.C. Reading Clinic was established in 201819 and offers two specific programs to DCPS educators: the InSchools program and the CityWide program. The InSchools program allows D.C. Reading Clinic InSchools coaches to partner with DCPS elementary schools to provide training to teachers, co-teachers, supporting coaches, and school leadership to ensure the development of K-2 students in early literacy skills.20
The CityWide program provides educators with professional development and coaching where they learn to implement research-based structured literacy instruction.21 Educators receive a stipend and DCPS professional learning units for participation in the program.22
To identify and track reading challenges over a school year, many schools in D.C. use Dynamic Indicators of Basic Early Literacy Skills (DIBELS), a teacher-administered assessment focusing on the acquisition of foundational literacy skills. Using a sample of approximately half of all kindergarten through grade 2 students, an EmpowerK12 analysis found that 59 percent of students met benchmarks by the end of school year 2022-23, surpassing 49 percent in the previous year and 55 percent in the pre-pandemic school year 2018-19. Outcomes for DIBELS in this sample are also better than the pre-pandemic levels for at-risk students (48 percent meeting the benchmarks) and students with disabilities (37 percent meeting the benchmarks).23
However, EmpowerK12’s analysis of a computer-based test’s results on a similarly sized sample of students shows reading comprehension for these grades remains below pre-pandemic levels. In school year 2022-23, 50 percent of students performed at or above grade level for reading comprehension. This is 17 percentage points lower than the share of students that performed at grade level in 2018-19 (67 percent). At-risk students (39 percent) and students with disabilities (25 percent) also had lower reading comprehension than before the pandemic.24
Early Literacy Task Force Report
In 2022, OSSE convened an early literacy task-force to discuss major investments in early literacy, strategies for supporting literacy educators, and actionable recommendations to improve literacy outcomes for students. The findings included four key recommendations towards integrating more science based literacy instruction in schools: mandatory competency instruction for all K-5 general education teachers, English learner teachers, reading specialists and interventionists, and K-12 special education teachers; structured literacy training for administrators and instructional coaches; on the job support with a walkthrough, observational tool; and OSSE publishing a list of instructional materials established in the science of reading.25
High school graduation
Four-year graduation rates have steadily increased since the pandemic began and rose again by 1 percentage point in school year 2022-23 to 76 percent (see Figure 9). Graduation rates improved the most for economically disadvantaged students, with a 5 percentage point increase from 63 percent to 68 percent. However, this rate is compared to at-risk students in previous years, and now excludes students who are overage and in high school, which may have boosted graduation rates. English learners and students with disabilities also had large increases of 4 percentage points in graduation rates.
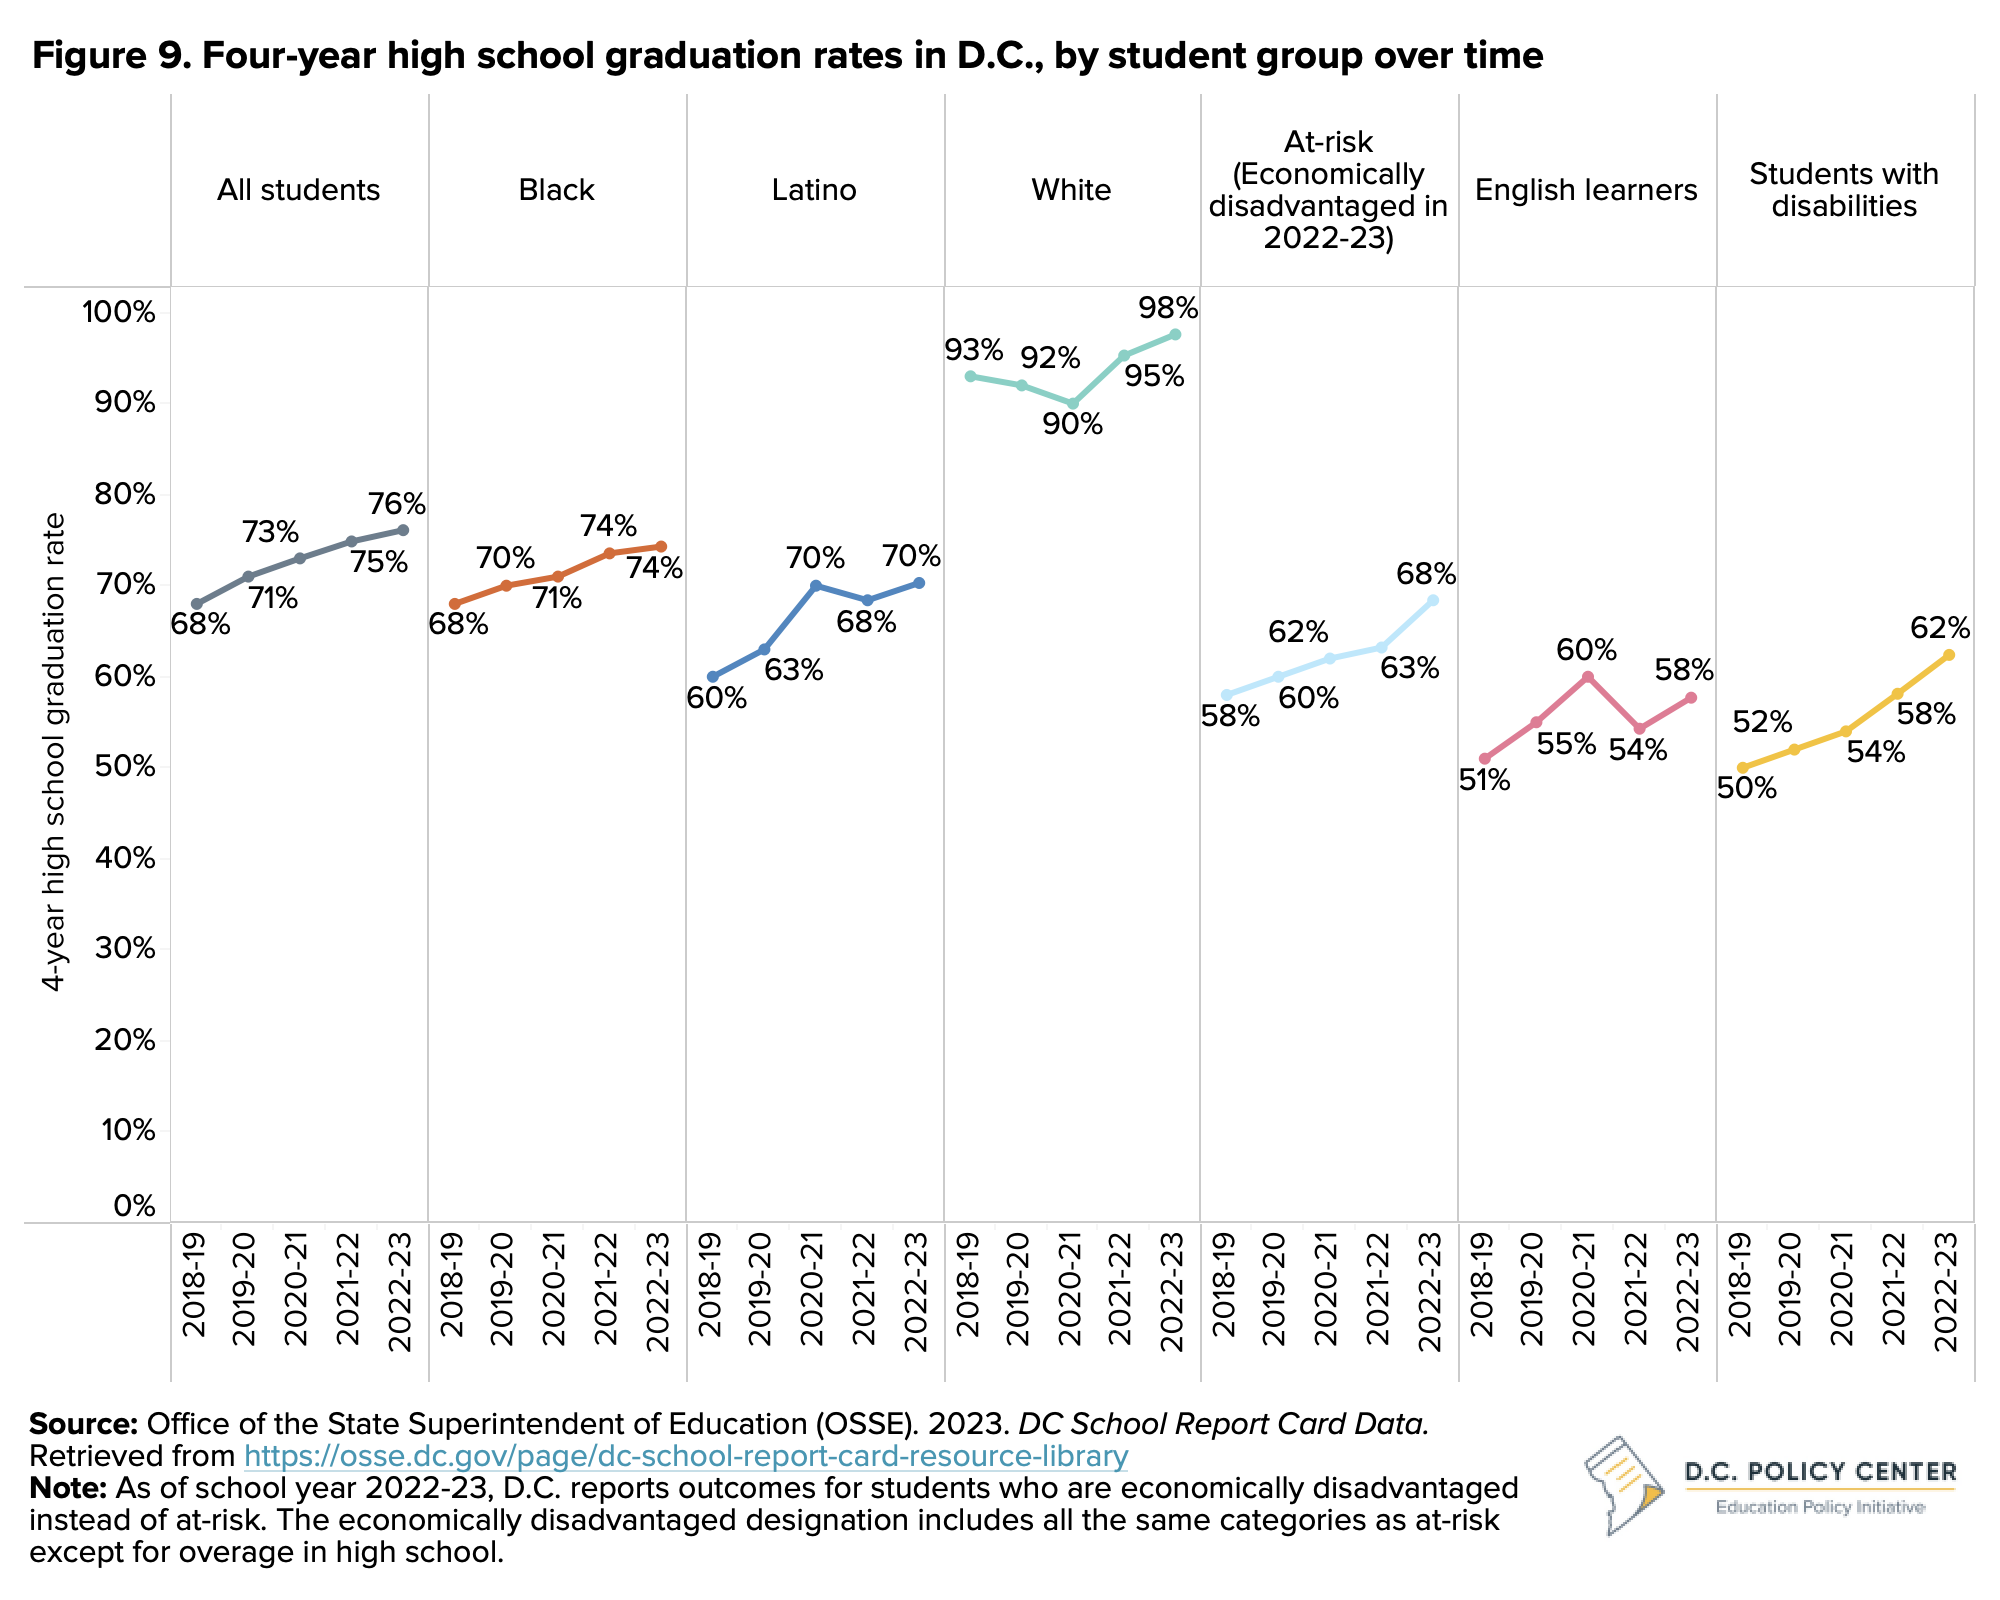
While a higher graduation rate is a positive outcome, it is not associated with improved learning outcomes. Assessment results show no improvement in ELA nor math for high school students in post-pandemic years. Importantly, math outcomes are lower than pre-pandemic, with 11 percent of high school students meeting or exceeding expectations in school year 2022-23 compared to 18 percent in school year 2019-20.26 In addition, this graduating cohort (who started 9th grade in 2019-20) was the first to experience a lower than usual 9th grade repetition in school year 2020-21. This may mean a larger share of students have been moving on to upper grades than in previous years, resulting in higher graduation.
9th grade repetition
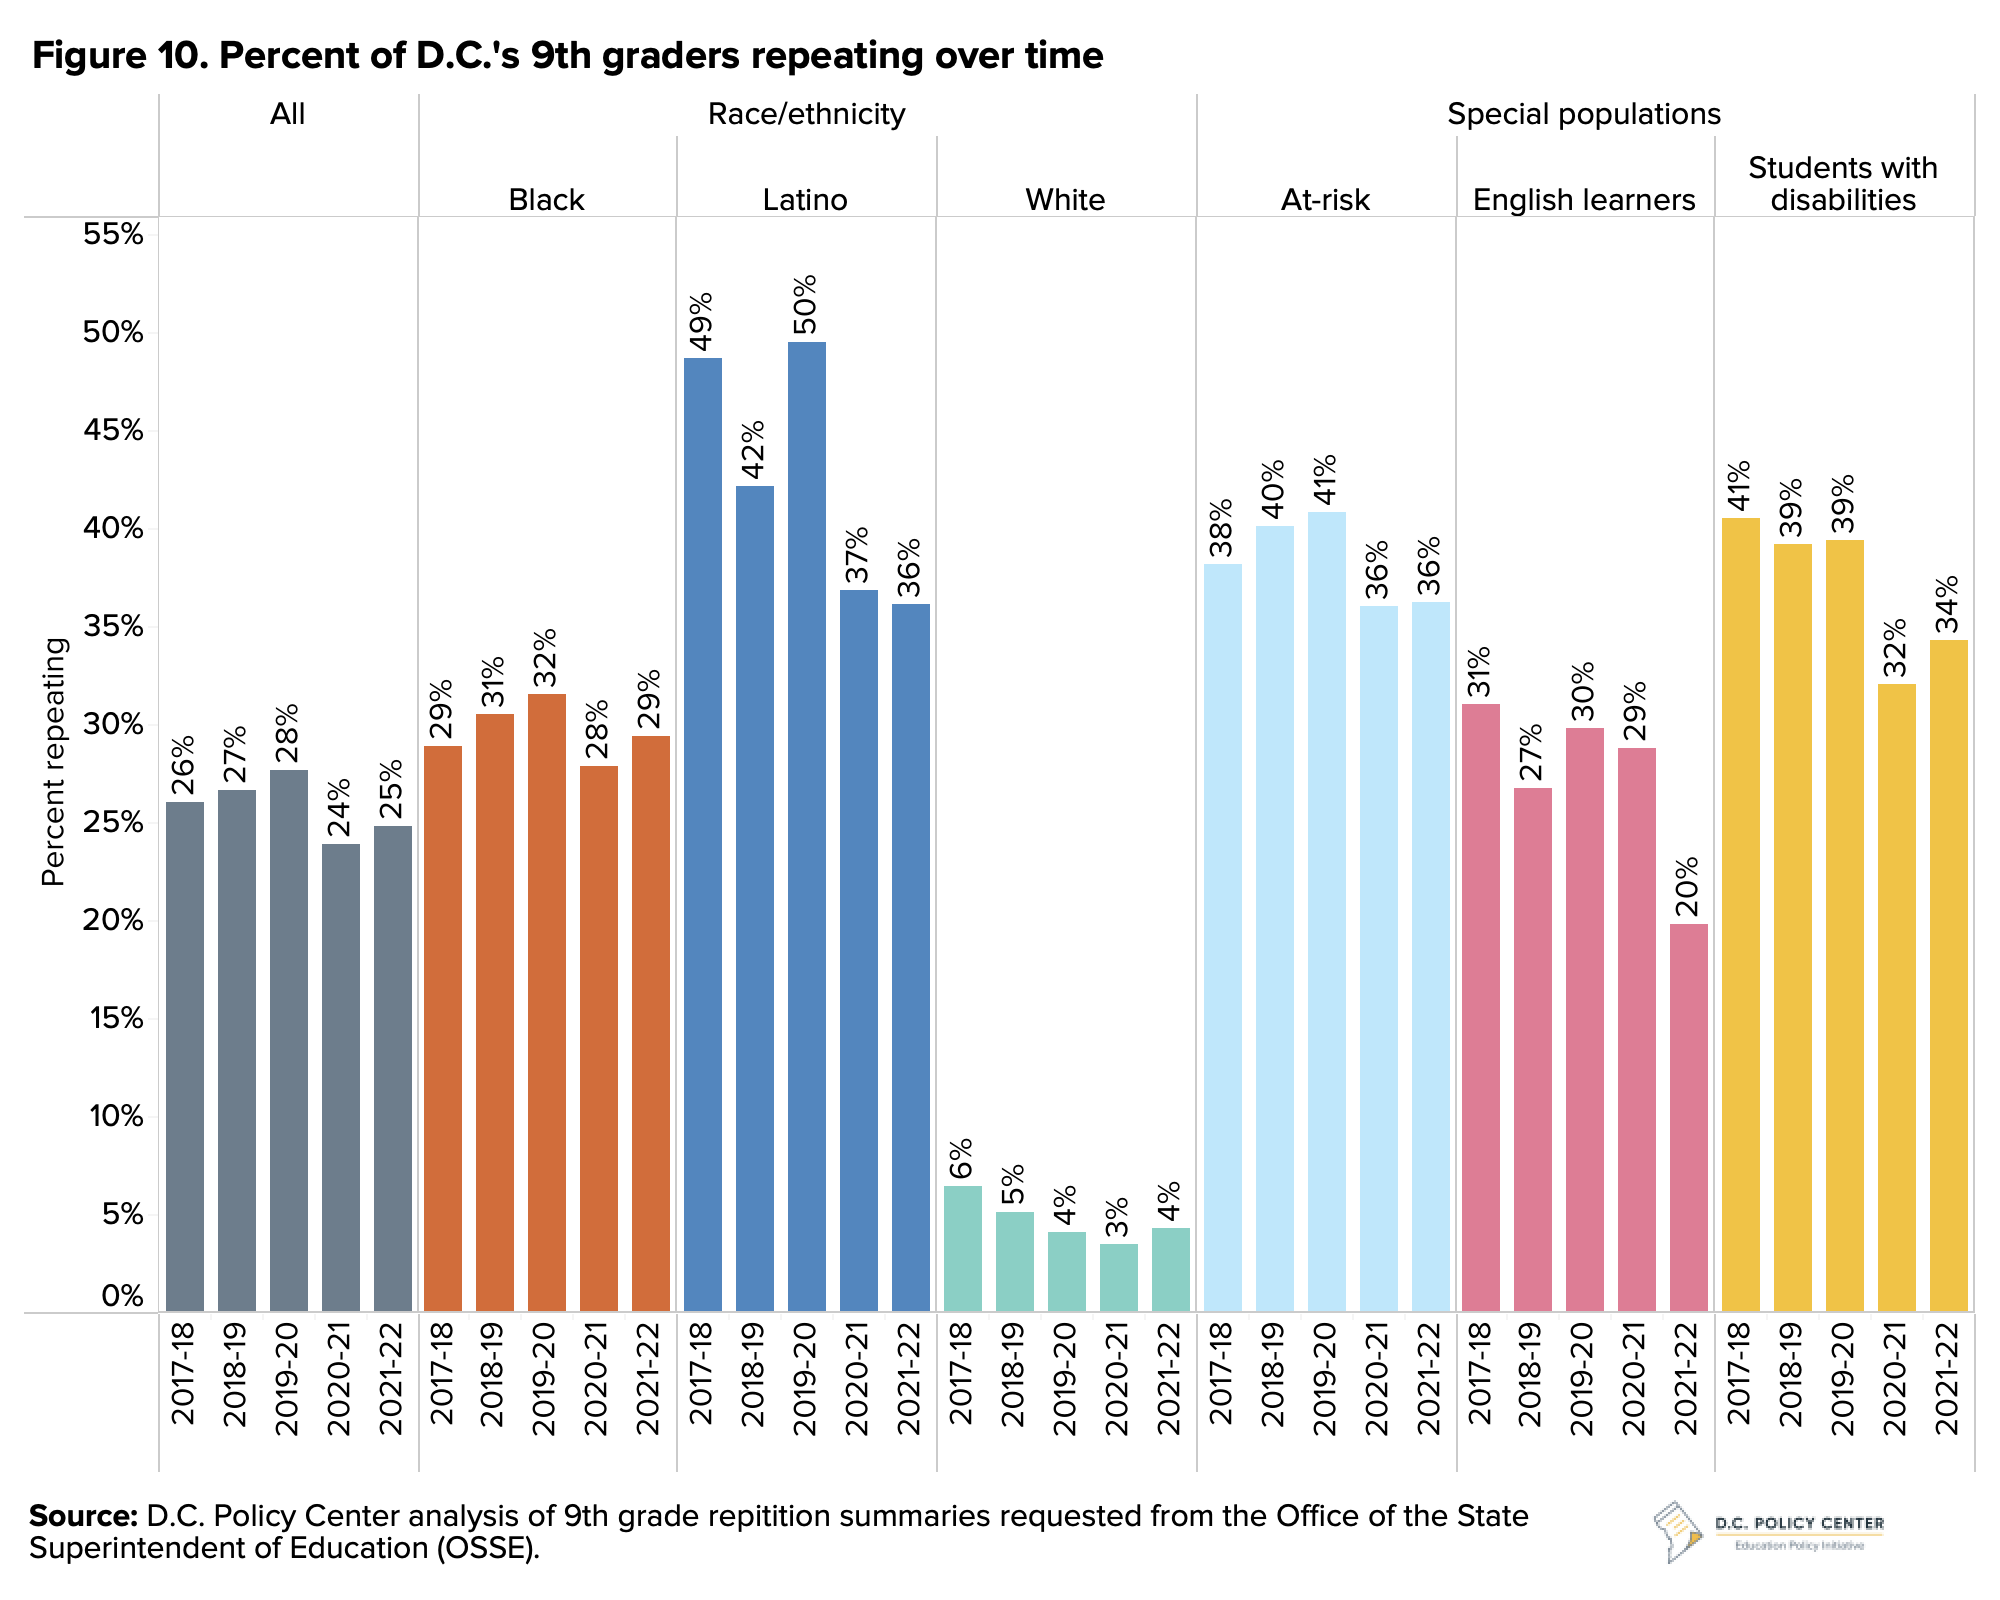
Before the pandemic, 9th grade repetition was on the rise at 28 percent of 9th graders being a repeater in school year 2019-20 (see Figure 10).27 However, in school year 2020-21, when the graduating cohort for 2022-23 would have been in 10th grade, 9th grade repetition declined to 24 percent. Latino students and English learners had the sharpest declines in repetition. On the surface, more students passing 9th grade is a positive outcome, but given the lack of progress in PARCC scores, it did not necessarily mean better learning outcomes.
Postsecondary college enrollment
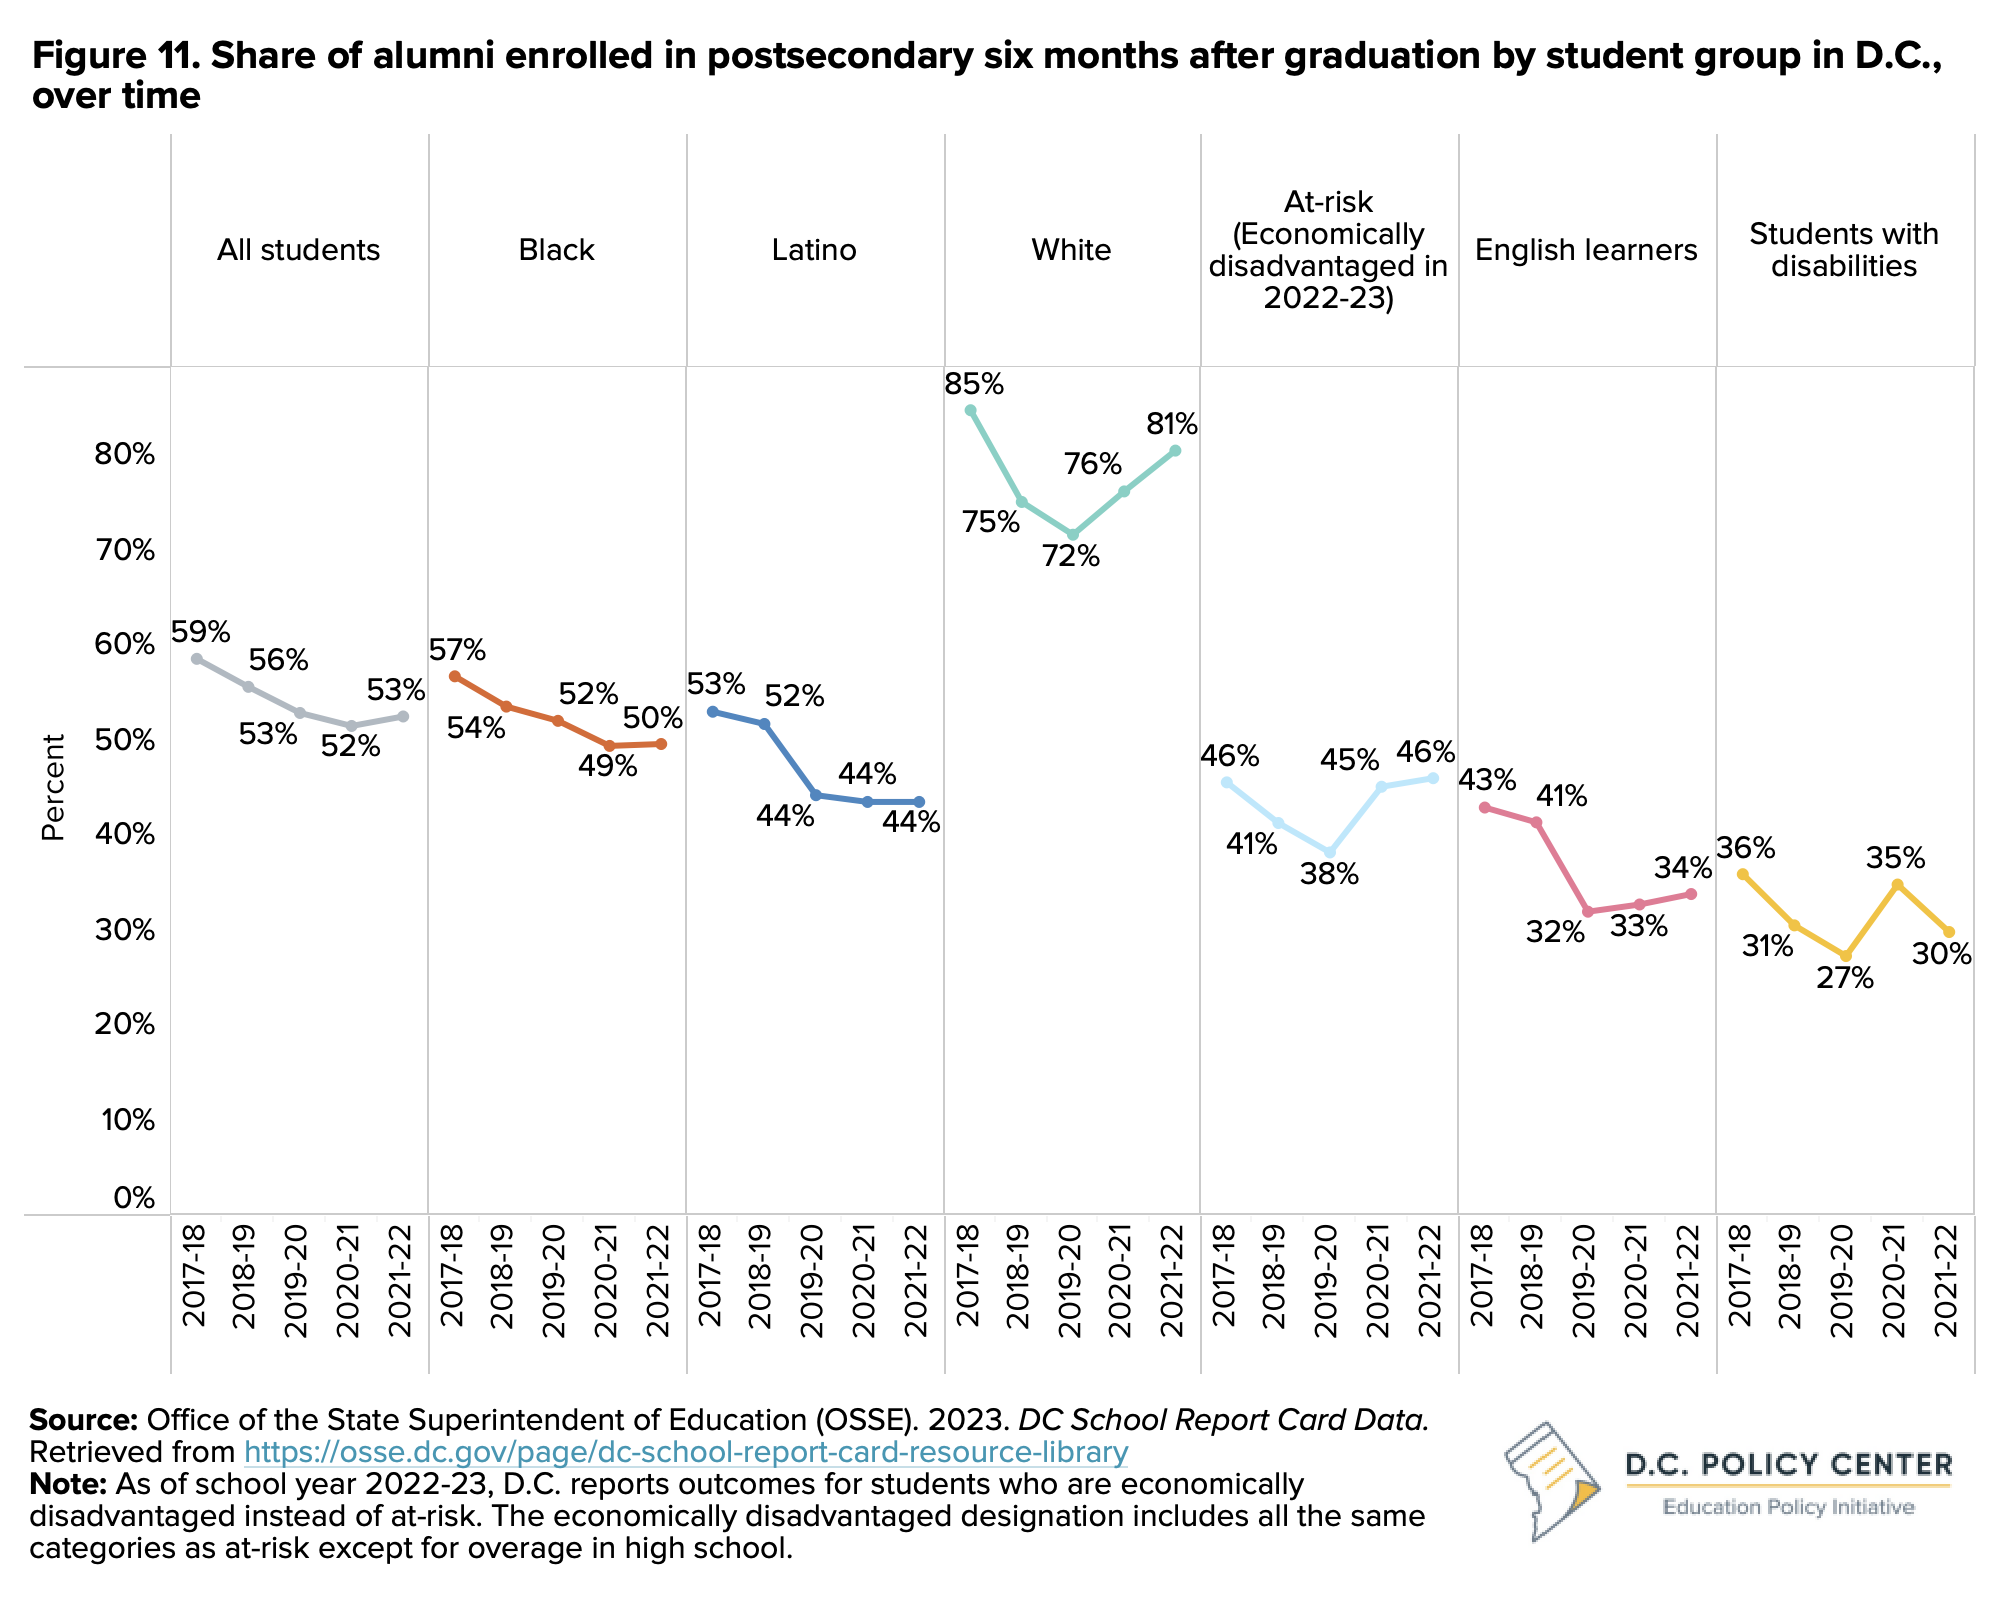
The most recent postsecondary enrollment data for the class of 2022 shows 53 percent of students who graduated high school enrolled in a higher education institution within six months (see Figure 11). This is a slight uptick after the drop for the class of 2021; however, it is still below the pre-pandemic level of 56 percent in school year 2018-19. White students had the highest postsecondary enrollment at 81 percent. Among this graduating cohort, 50 percent of Black students, and 44 percent of Latino students enrolled in postsecondary within six months. Students with disabilities had the lowest enrollment at 30 percent.
Postsecondary completion
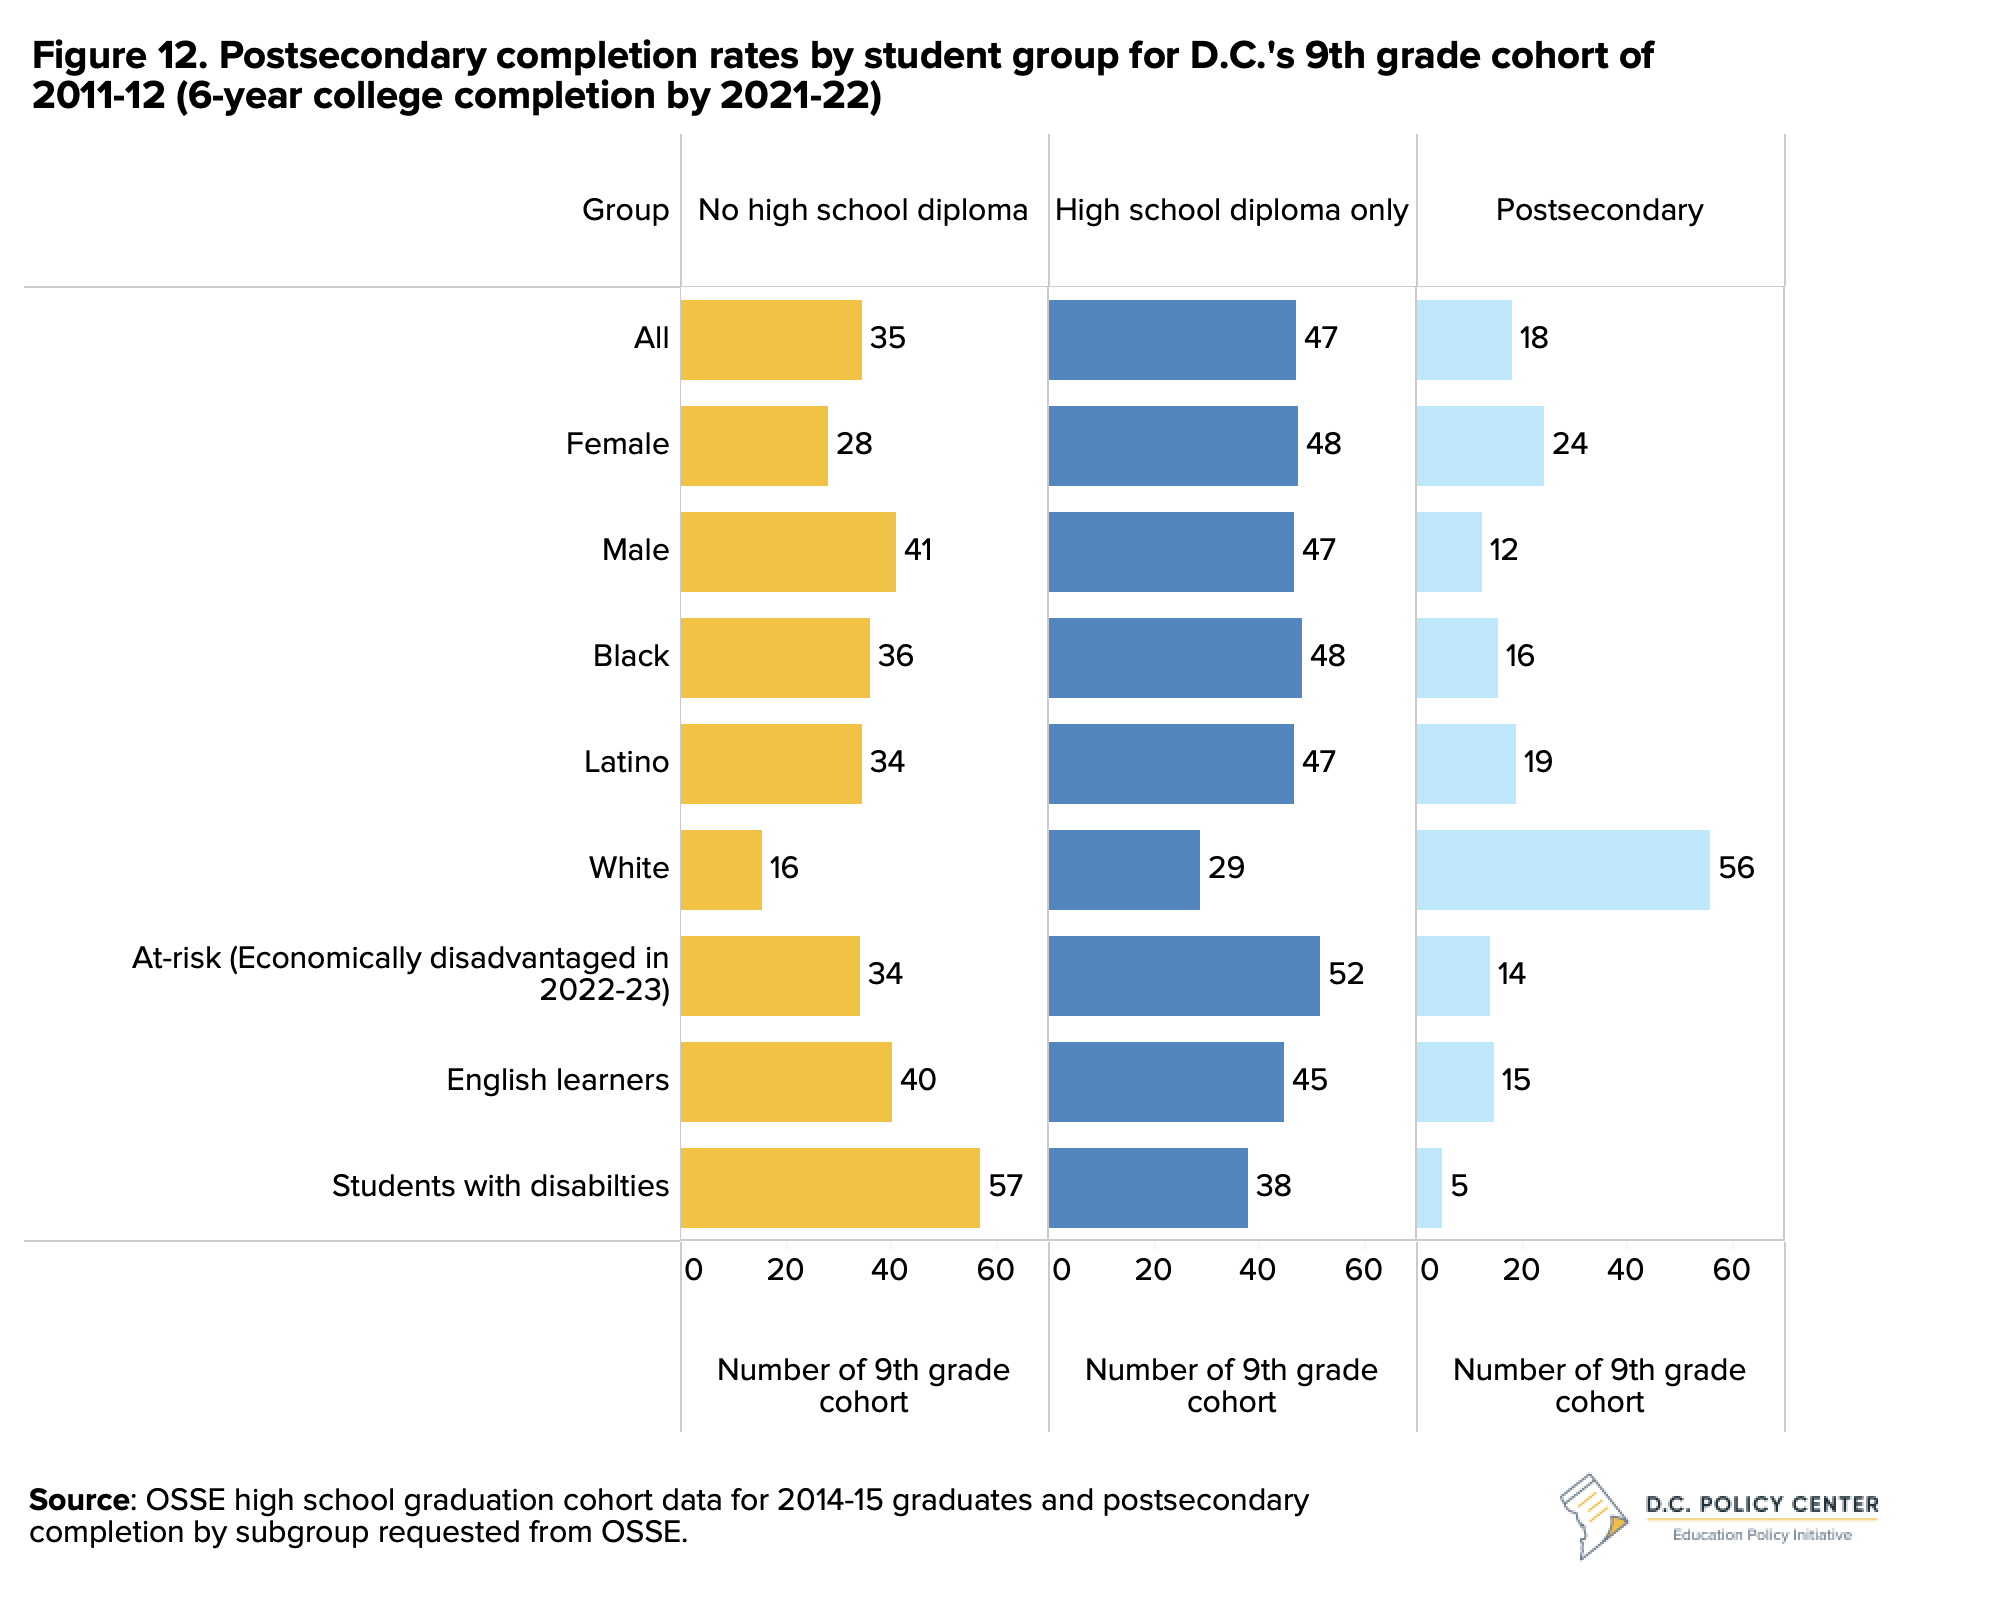
Based on cohort data shared by OSSE for the 9th grade class of 2011-12, out of every 100 students that started 9th grade together, 18 completed a postsecondary degree within six years of high school graduation (see Figure 12). This is a different and more precise number than previous D.C. Policy Center estimates that combined publicly available data for multiple cohorts.
In this cohort, female and white students have the highest postsecondary completion (24 and 56 out of 100 completing, respectively), and students with disabilities have the lowest (5 out of 100 completing). Students who are economically disadvantaged have the largest number of students who end their education with a high school diploma (52 out of every 100), while students with disabilities are the most likely to not complete high school (57 out of 100).
College and career connections in D.C.’s high schools
D.C. invests in building connections to college and career for D.C.’s high schoolers, and pandemic related federal fiscal aid allowed the city to invest in more programs, and more broadly. Many students mentioned they wanted a comprehensive approach where all students at all schools have equal access to these programs through better information.
“I said I wanted to do forensic psychology and a teacher recommended a dual enrollment class to be sure that’s what I wanted.” – Student
“It is important to emphasize trade schools and other options that aren’t college. Schools like the 100% acceptance rate statistic, but who cares if this isn’t what kids want to do. We need all sorts of resources and support to make a decision.” – Student
For school year 2022-23, there were many investments in college and career pathway supports, including the College Rising dual enrollment and mentorship program, the DC Futures Tuition Assistance program, Advanced Internship Program, the Youth Earn and Learn Program which serves out-of-school youth, and a new Advanced Technical Center which offers classes in high-wage, high-demand occupations such as nursing and cybersecurity.28 The city also budgeted additional resources for the Marion Barry Summer Youth Employment Program. These are in addition to many programs at OSSE, DCPS, DME, DOES, and public charter schools, including career and technical (CTE) education programs, dual enrollment opportunities, DC TAG scholarships, and other work-based learning opportunities.
School spotlights
DCPS College and Career Programs include Career Prep Programs (internships, tenacity professional skills curriculum, apprenticeships, for example), DCPS Goes to College (college tours, dual enrollment, financial aid supports, SAT testing and prep), DCPS Persists (college orientations, one-on-one coaching, DCPS alumni network access), and Career and Technical Education (NAF Academies, CTE industry-recognized credentials, work-based learning, early college credits, middle school CTE, among others).
KIPP Forward is a part of the broader KIPP Foundation, and they specifically work with students on college and career guidance and resource provisions to ensure they have a successful future.29 KIPP Forward provides college support to their alumni by providing financial aid workshops, scholarship application support, and personalized counseling for college selection.30 They also have partnerships with colleges and universities to support their alumni by identifying areas of strength and supports to increase graduation rates for KIPP alumni and other first-generation students.31
E.L. Haynes PCS provides alumni with counselors for academic, financial, and emotional support, college support funds, and targeted workshops and networking opportunities.32 E.L. Haynes PCS also has pre-college programs, including international trips, STEM programs, and leadership programs. Participating students receive assistance on resumes, interview preparation, organizational skills, and email etiquette.33
In addition to comprehensive college advising beginning in 9th grade, E.L. Haynes PCS supports students with accessing various programs outside of the school through assistance with resumes, essay writing, interview preparation, and organizational skills. This assistance ensures students can take advantage of various STEM programs, leadership programs and opportunities to study on college campuses during the summer.
E.L. Haynes also facilitates access to career exploration during the 10th grade year by bringing professionals into the school building and providing an opportunity for students to shadow professionals in the work setting. E.L. Haynes supports students once they graduate by offering an emergency college support fund, a quarterly alumni newsletter, and individual support with financial aid challenges when requested. The school focuses on ensuring that first year students make a successful transition to college.
DME Dual Enrollment report
In April 2022, DME and OSSE convened dual enrollment working groups to develop a vision statement for dual enrollment along with recommendations for program design and expansion of dual enrollment. In addition, student focus groups provided feedback to shape recommendations. Their recommendations include but are not limited to: creating more options for dual enrollment during the day and summer, ensuring programs count towards graduation requirements, encouraging institutes of higher education to train instructors for dual enrollment classes, providing orientation and cohort programming to students at each grade level, integrating dual enrollment in the state accountability framework and school report cards, and considering funding for additional staff to manage the Dual Enrollment consortium at OSSE.
School environment
This section looks at recovery efforts and the student experience in D.C. ESSER funding has been an integral part of academic recovery efforts due to the pandemic. According to national reporting as of September 30th, 2023, states and school districts have spent 70 percent of these funds and D.C. has spent 67 percent as of February 2024 (this share is not final and may increase in additional reporting periods).34 While these funds must be used or committed by September 2024 with an extension period for some purposes, they have been critical in hiring additional staff, supporting student and staff well-being strategies, and rebuilding school culture. These funds have contributed to more professional development opportunities, high-impact tutoring and intervention programs, longer school years and days, and additional investments. Despite these investments, chronic absenteeism and wellbeing measures have not returned to pre-pandemic levels.
Investments in recovery and ESSER funding
The school environment in school year 2022-23 has been shaped by continued investment in pandemic recovery and enabled, for the most part, by the large influx of funding from the federal government through ESSER funds.
ESSER spending to date
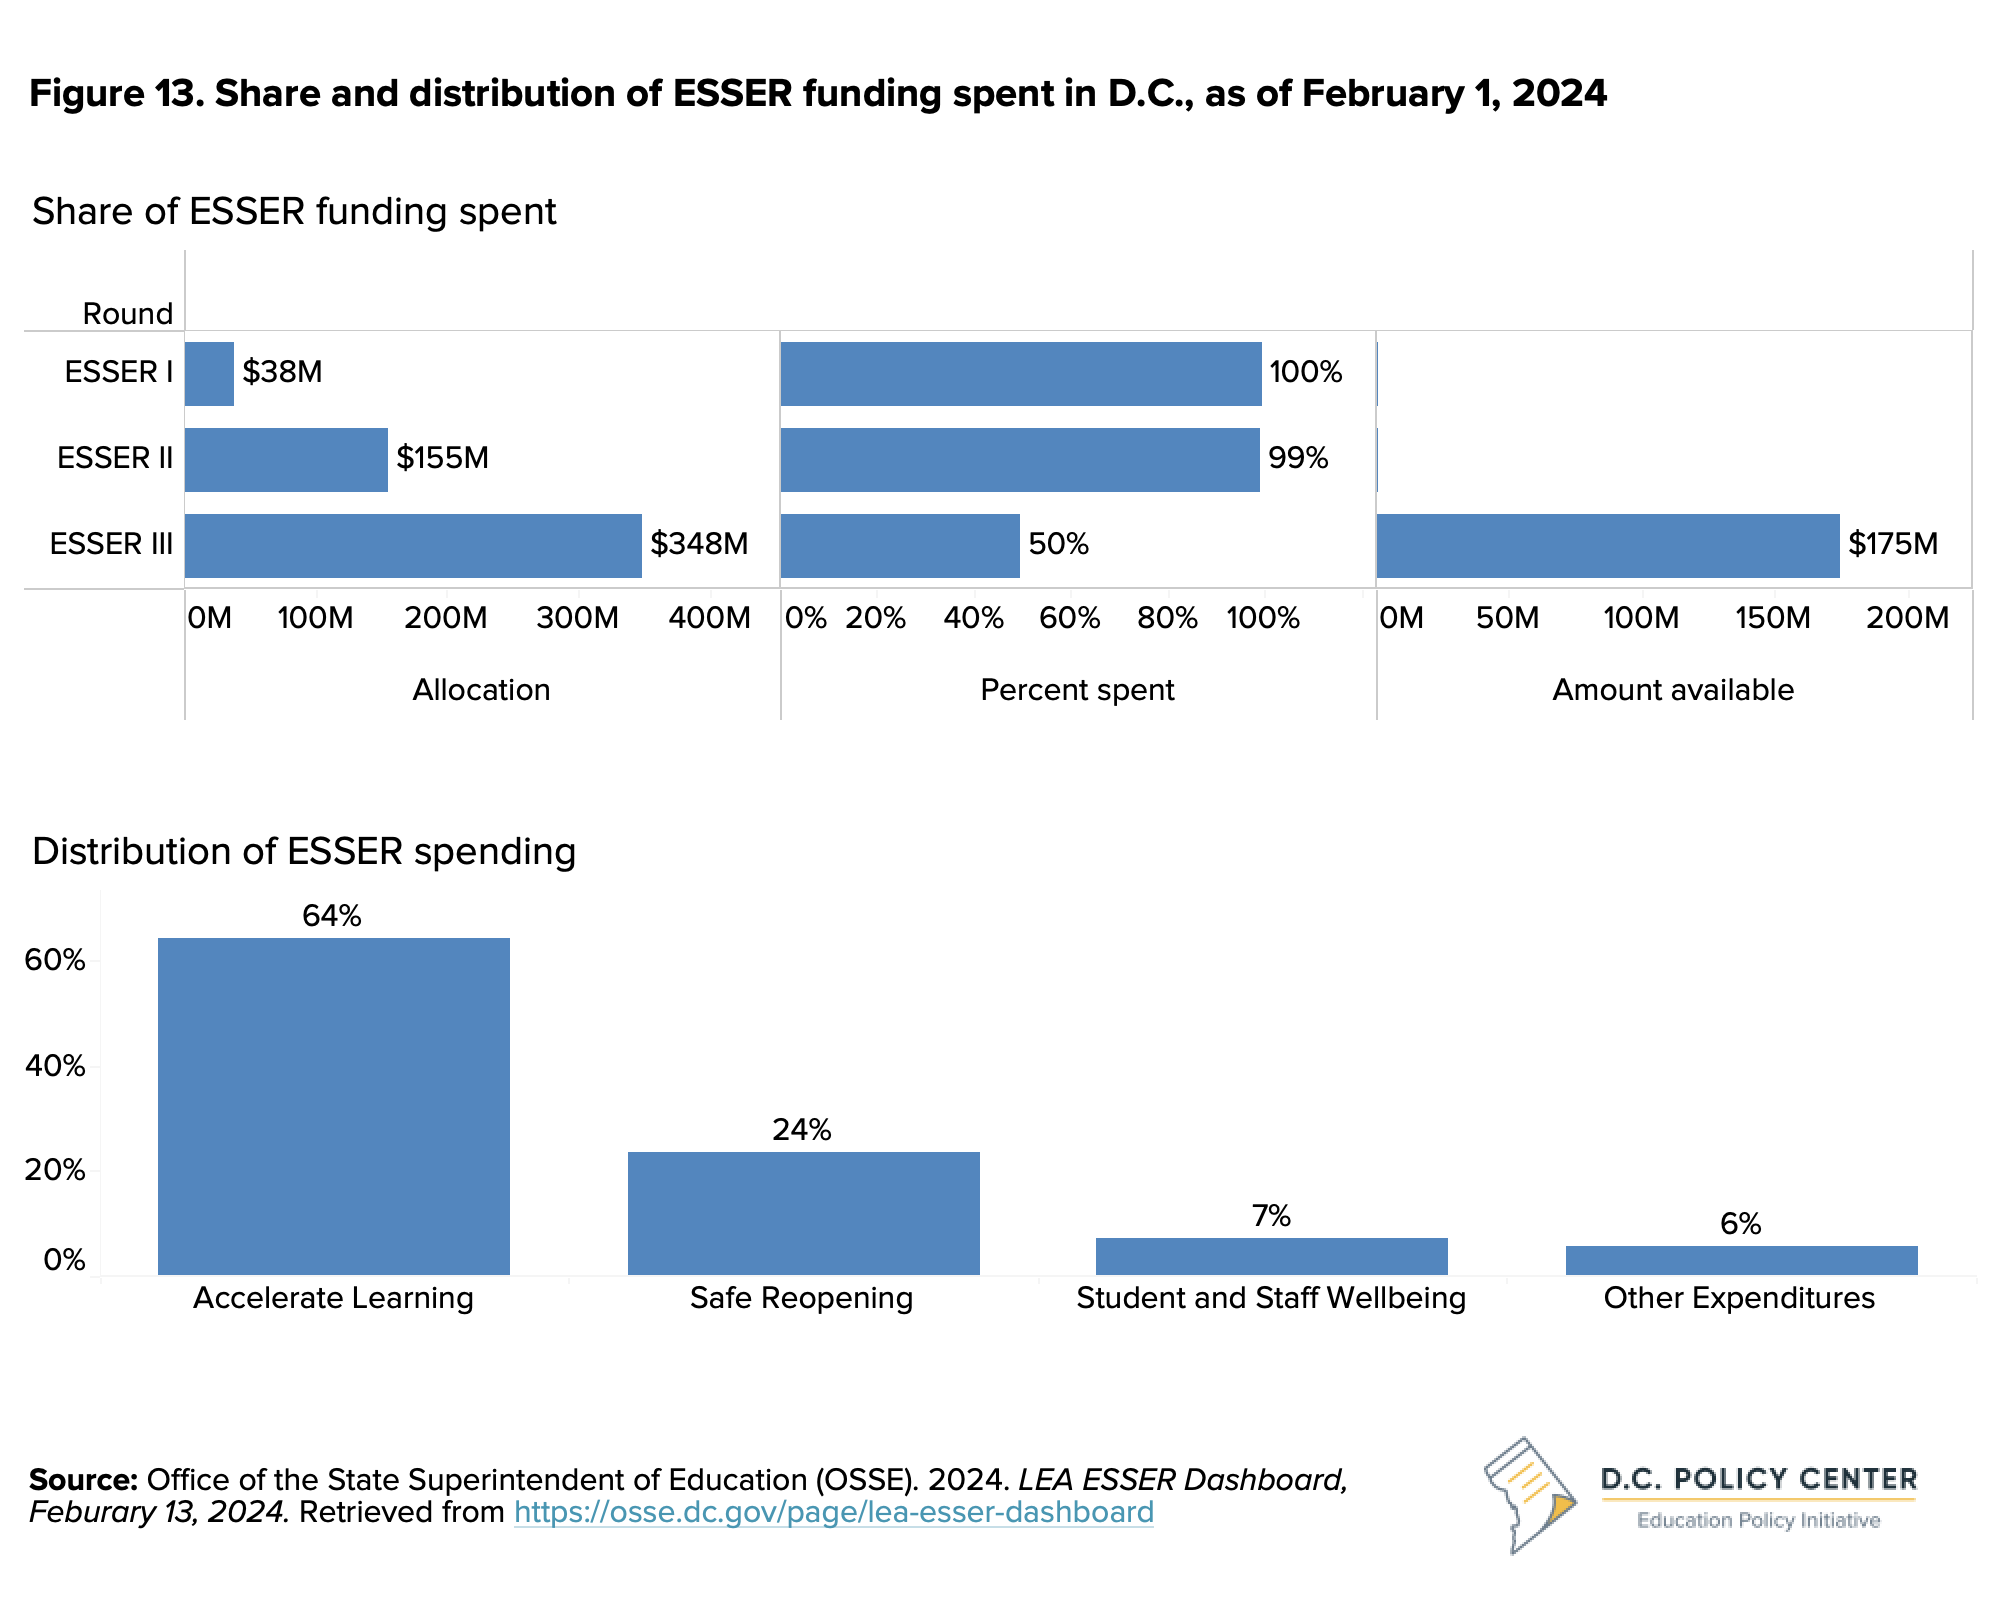
To assist schools in addressing pandemic-induced challenges and interruptions to learning, LEAs were granted $540 million in federal funding in three rounds of ESSER funds, beginning in 2020.35 As of February 2024, after at least three fiscal years when funds were first made available, schools have spent $364 million according to D.C.’s reporting (these numbers may increase with additional reporting and are not final). Accelerated learning was the largest expenditure of ESSER spending, accounting for 64 percent of spending. Of the other allowed expenditures, 24 percent has been spent on safe reopening, 7 percent on student and staff well-being, and 6 percent on other expenditures (see Figure 13). For ESSER III, schools have spent $173 million so far, with $175 million remaining to be spent in school year 2023-24 and beyond with allowable extensions.
Accelerated learning
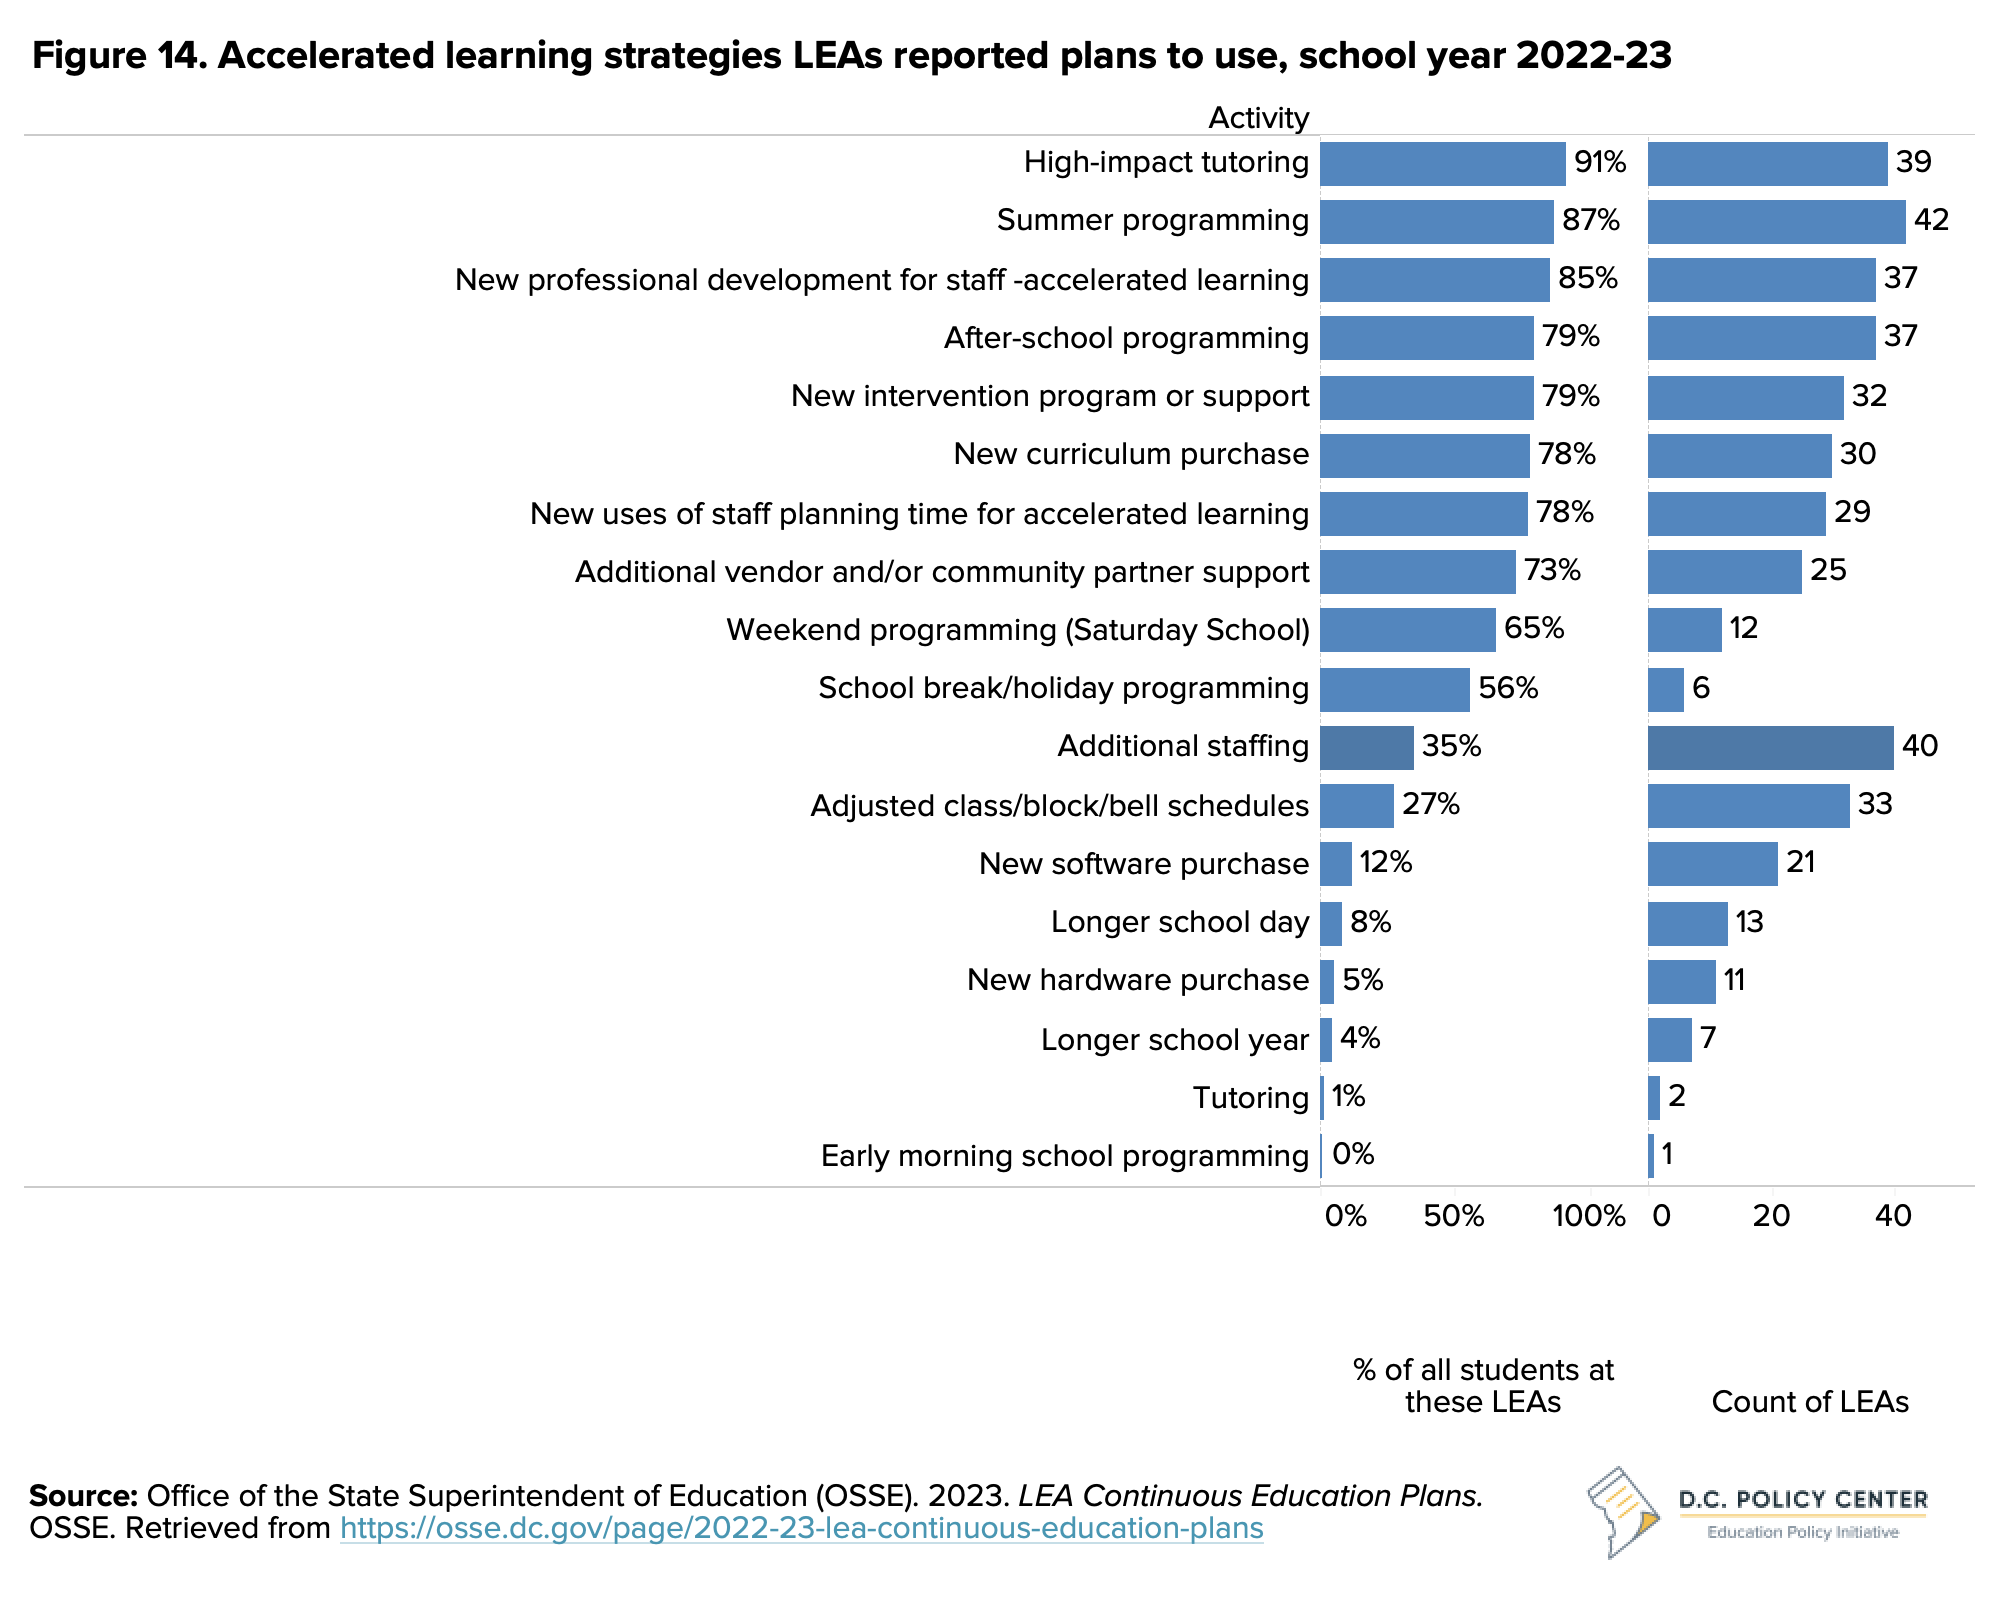
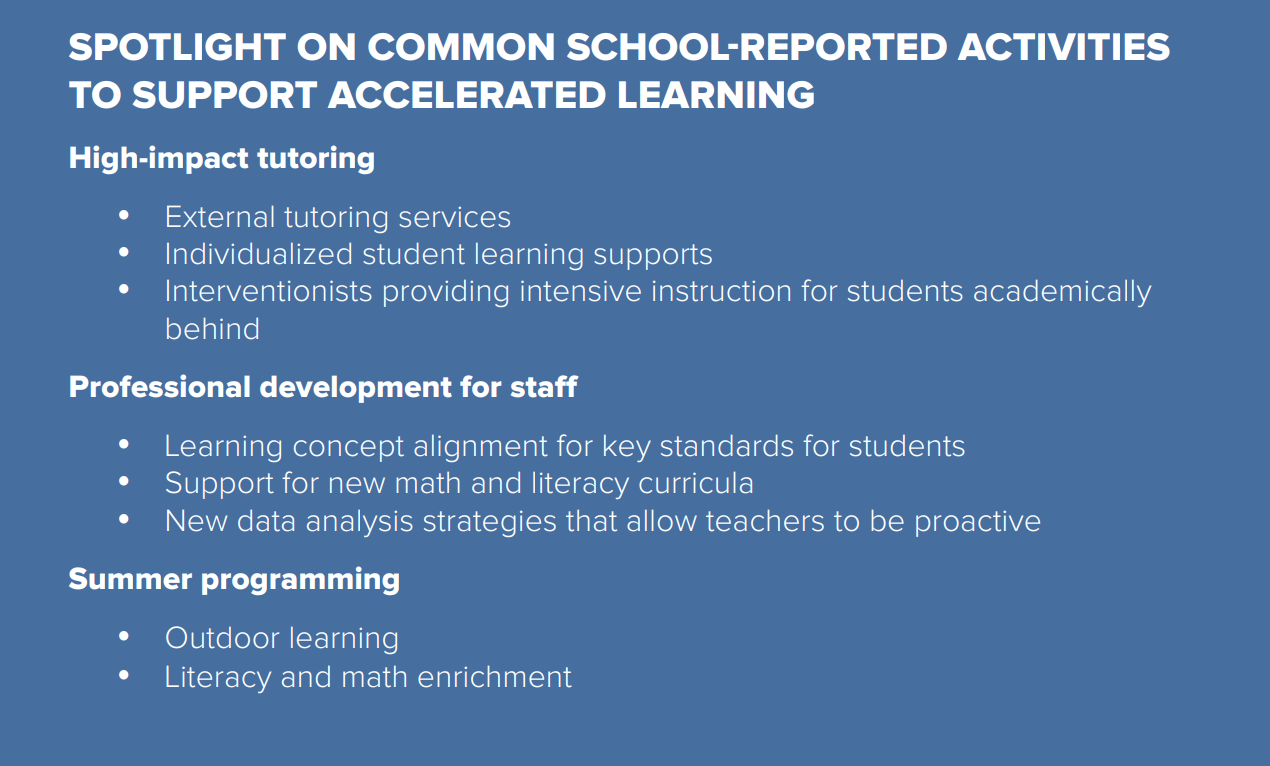
In Continuous Education Plans (CEPs), LEAs outlined their plans for ESSER spending, including their learning acceleration strategies.36 Weighting responses by LEA enrollments, the most common accelerated learning strategies used by LEAs serving at least three-quarters of students are high-impact tutoring, summer programming, new professional development programs for staff, after-school programming, new intervention programs or student supports, new curricula, and new uses of staff planning time for accelerated learning (see Figure 14 below).
In addition to school-level investments, OSSE has made a three-year investment of $35 million to promote and expand the use of high-impact tutoring (HIT). HIT is designed to support students, especially at-risk students, who fell behind academically due to the COVID-19 pandemic.37 The District plans to serve at least 10,000 students through HIT by fall 2024 across 90 percent of priority schools, where there is a great concentration of students who need academic supports.38
Safe reopening
Safe reopening investments included air quality equipment and servicing, changes to facilities and outdoor spaces, supplemental staffing for school operations, Coronavirus testing, personal protective equipment (PPE) and other supplies, sanitation services, and public health consulting services. These investments continued in school year 2022-23, although they were less of a critical priority with COVID-19 cases well below the previous school year (an average of 80 cases per day in school year 2022-23 for all D.C. residents compared to 294 cases per day in school year 2021-22).39
The need for and access to mental health supports
Mental health supports have been a pressing issue for policymakers and school leaders, especially with students and staff returning to school full-time in person. In listening sessions with students, many students reported that they were juggling mental health challenges with the academic workload, in an environment where they perceived schools had higher expectations of student engagement and attendance than the previous year. One change that appears to be more permanent is parents’ attitudes towards attendance. In our listening sessions, parents expressed being more understanding of their students’ mental wellbeing, and more willing to allow their students to take mental health days, especially if schoolwork was being posted online virtually, and students weren’t falling behind academically.
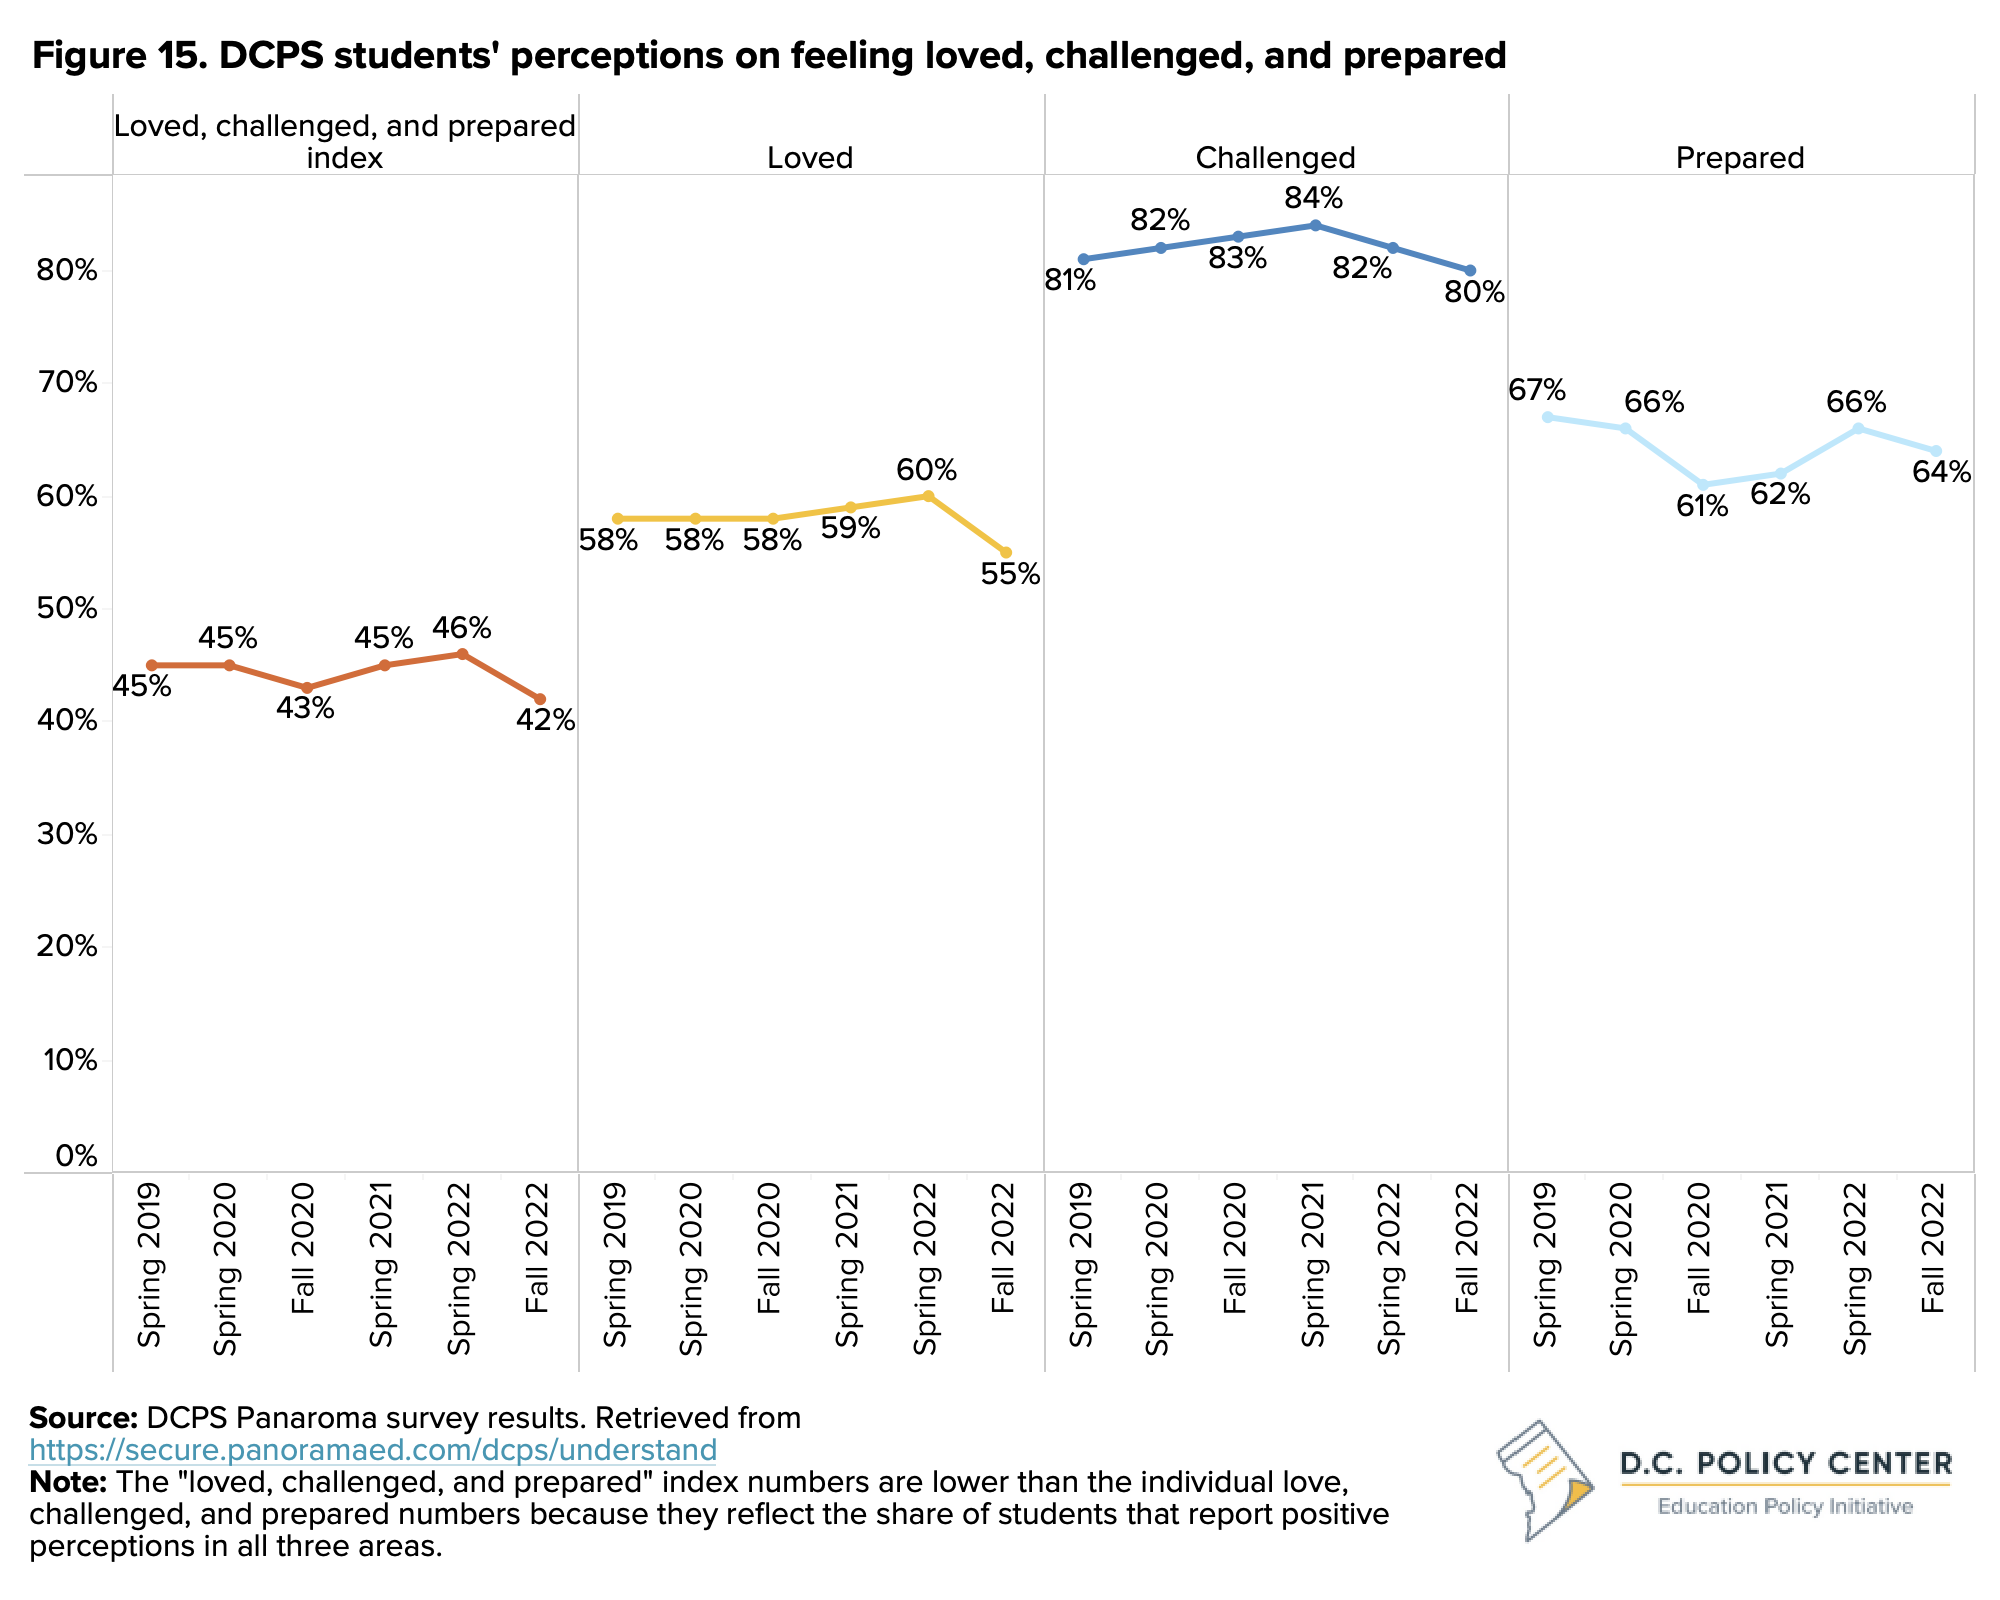
DCPS administers a student survey called Panorama across all students in grades 3 through 12 to track student perceptions about being loved, challenged, and prepared. Panorama survey findings do not show much progress since the fall of 2020 when the schools only offered virtual instruction (see Figure 15). The overall index is down by one percentage point, and the shares of students who report feeling loved and challenged both declined by 3 percentage points, while the share who report feeling more prepared increased by 3 percentage points in the fall of 2022 compared to 2020.
A study supported by Youth Invest Partners and conducted by Bellwether, a nonprofit education consulting organization, of over 5,000 public charter school students in D.C. using many of the same questions as in the Panorama question bank provides an additional snapshot of student wellbeing in school year 2022-23. The study found that more than 50 percent of students reported valuing school, but less than 40 percent reported feeling engaged in school. In addition, older students scored lower than younger students on indicators of wellbeing.40 Student safety at school was also disconcerting; 24 percent of students reported not feeling safe at school, both physically and psychologically, and 33 percent reported they were likely to be bullied online.41
District of Columbia Public Schools (DCPS) Whole Child Approach
In school year 2019-20, the District of Columbia Public Schools (DCPS) began the Connected Schools model, a whole child, whole school, whole community approach that supports a student’s academic development and their family’s well-being.42 The model is established on six research-based principles: a connected school manager role, authentic community and family engagement, healing centered practices, strong student support systems, place-based support, and academic enrichment.43
In school year 2022-23, 14 schools participated in the Connected Schools model. 215 community partners work within this model, and 2,600 students have been served using the connected schools approach.44
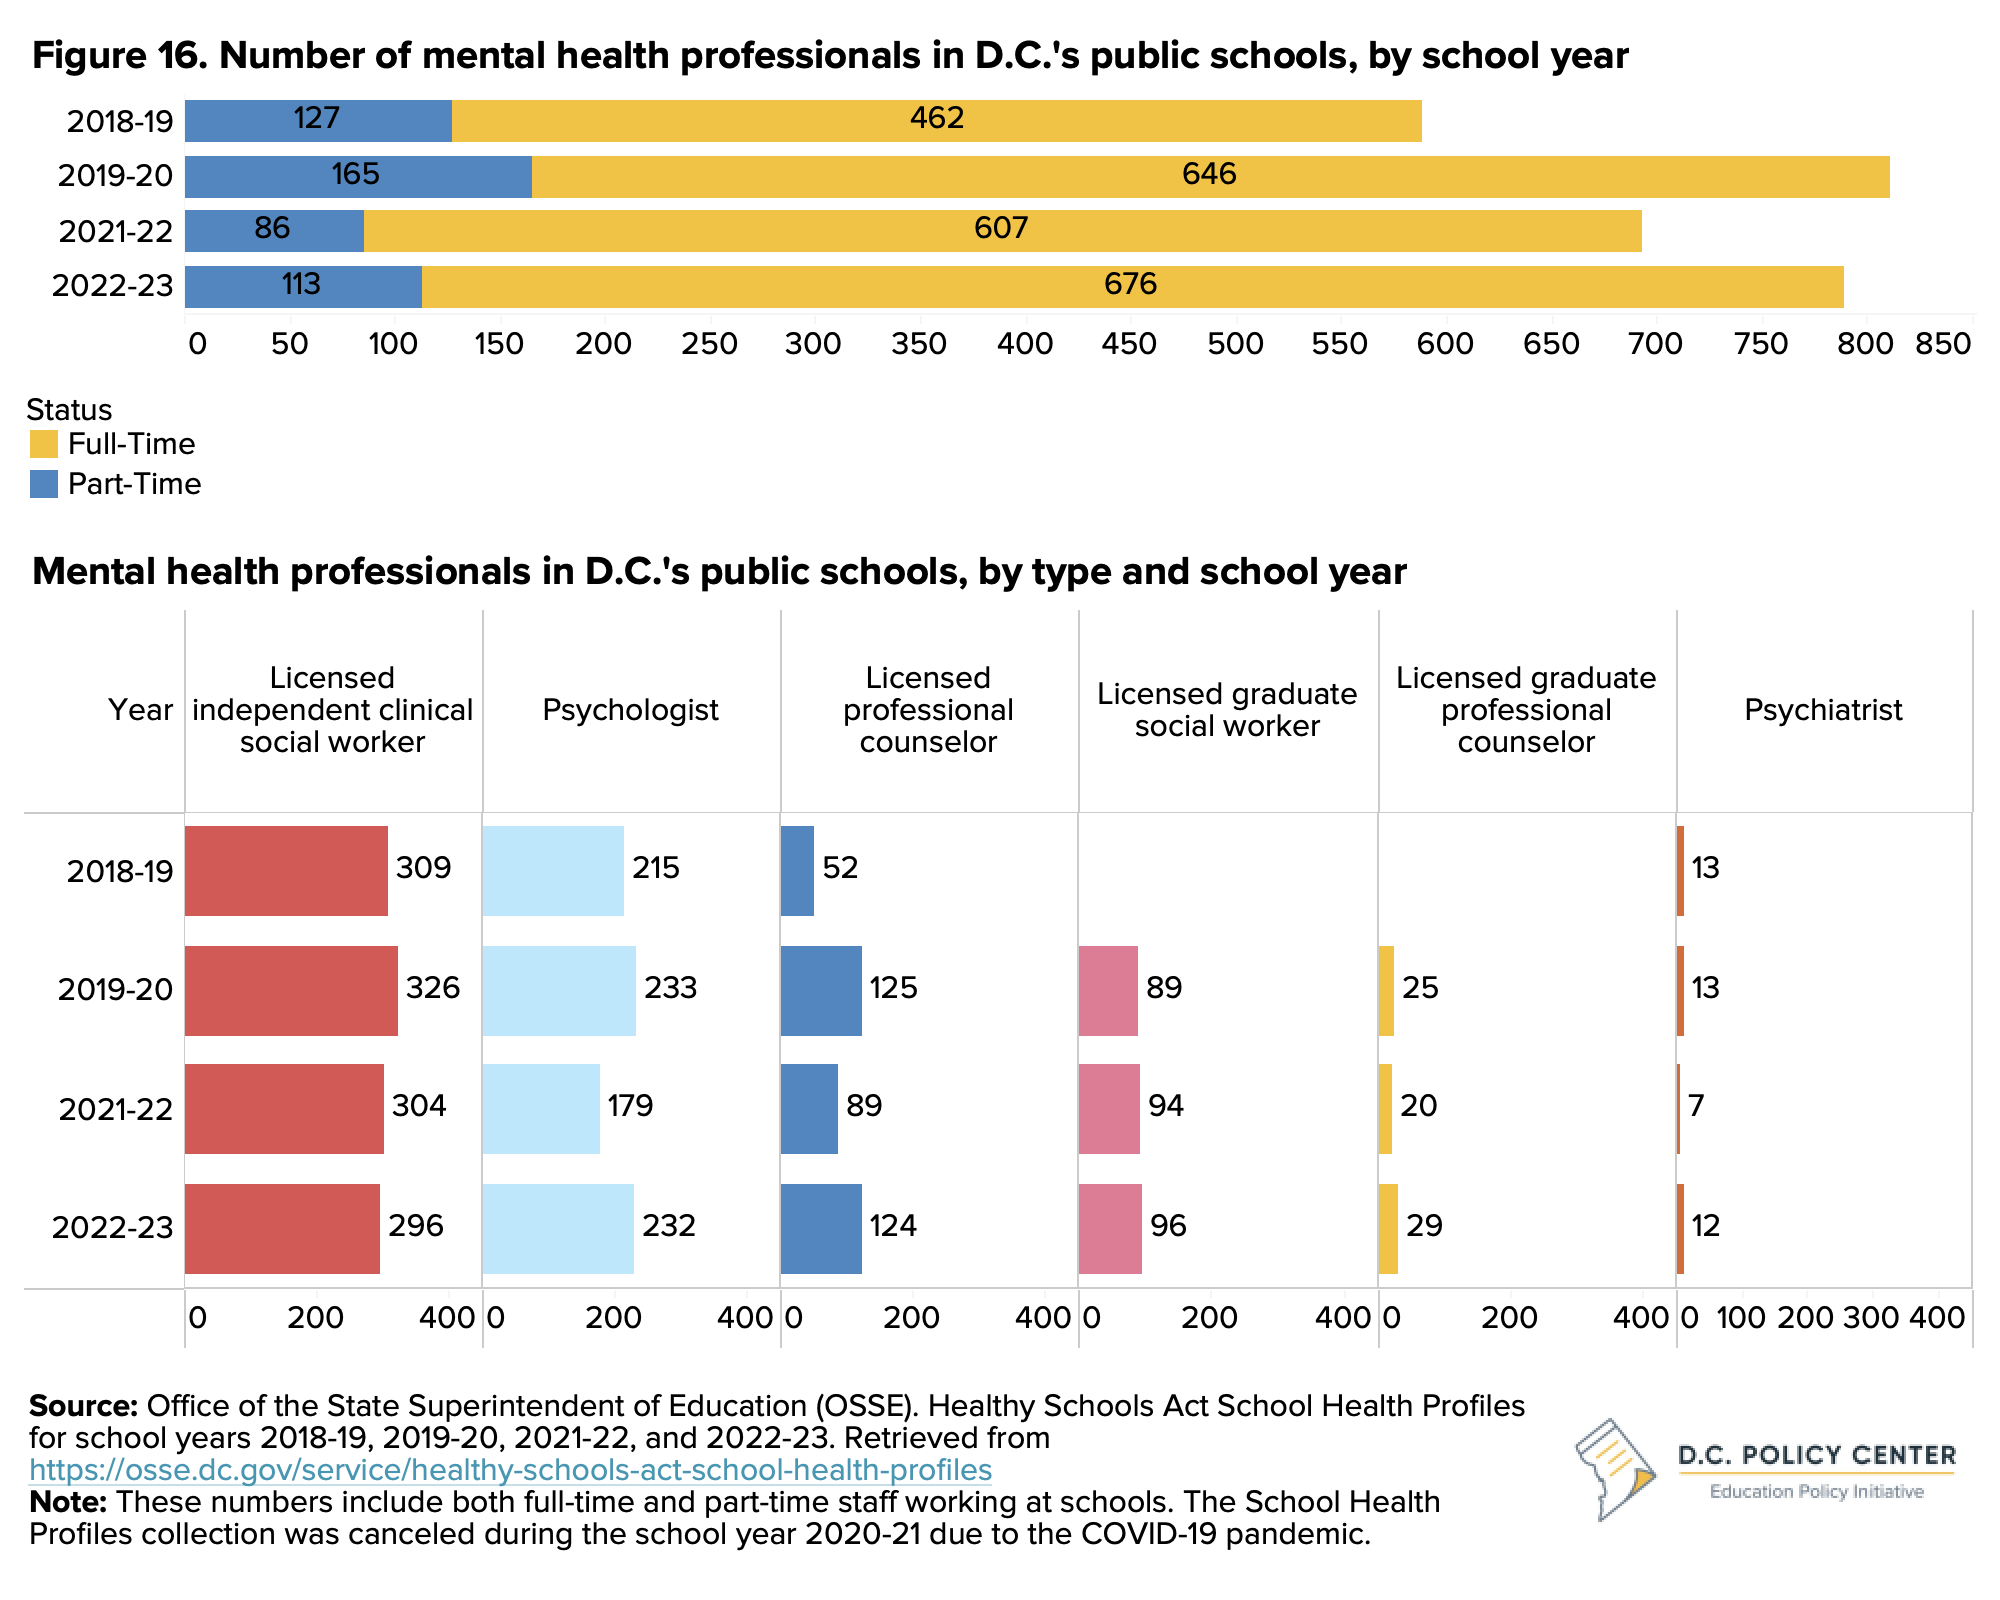
With 7 percent of ESSER funds going toward student and staff wellbeing, schools have invested more in trauma-informed practices, meals, and mental health services and supports, among other interventions. This has supported a shift away from part-time mental health professional staff and toward full-time mental health professional staff. Part-time mental health professionals represented 20 percent of the total in school year 2019-20 and 14 percent in school year 2022-23 (see Figure 16). Licensed independent clinical social workers, who hold a master’s degree in social work, are the most common type of mental health professionals.45
Student experience
Even with recovery investments, chronic absenteeism remains high with 44 percent of students missing 10 percent or more of the school year—14 percentage points above pre-pandemic levels—compared to 29.7 percent nationally in school year 2021-22.46 In contrast, other indicators, such as teacher retention and out-of-school suspensions, have returned to pre-pandemic levels. In school year 2022-23, 70 percent of teachers stayed in the same position at the same school following a brief improvement during the pandemic, and compared to 82 percent nationally at schools where 75 percent or more of students were approved for free and reduced-price lunch in school year 2021-22.47 Additionally, 6 percent of students received an out-of-school suspension.
Chronic absenteeism
Chronic absenteeism, defined as missing 10 percent or more of the school year, remains one of the greatest challenges for D.C.’s public schools, especially at high schools. Chronic absenteeism declined to 43.7 percent in school year 2022-23, a 4.4 percentage point decrease from 48.1 percent in school year 2021-22 (see Figure 17). However, this is still 14 percentage points higher than the 29.4 percent of students chronically absent in school year 2018-19. Importantly, absenteeism undermines all other investments in schools. If students are not consistently present, they are unable to access the academic and social supports provided to them by schools.
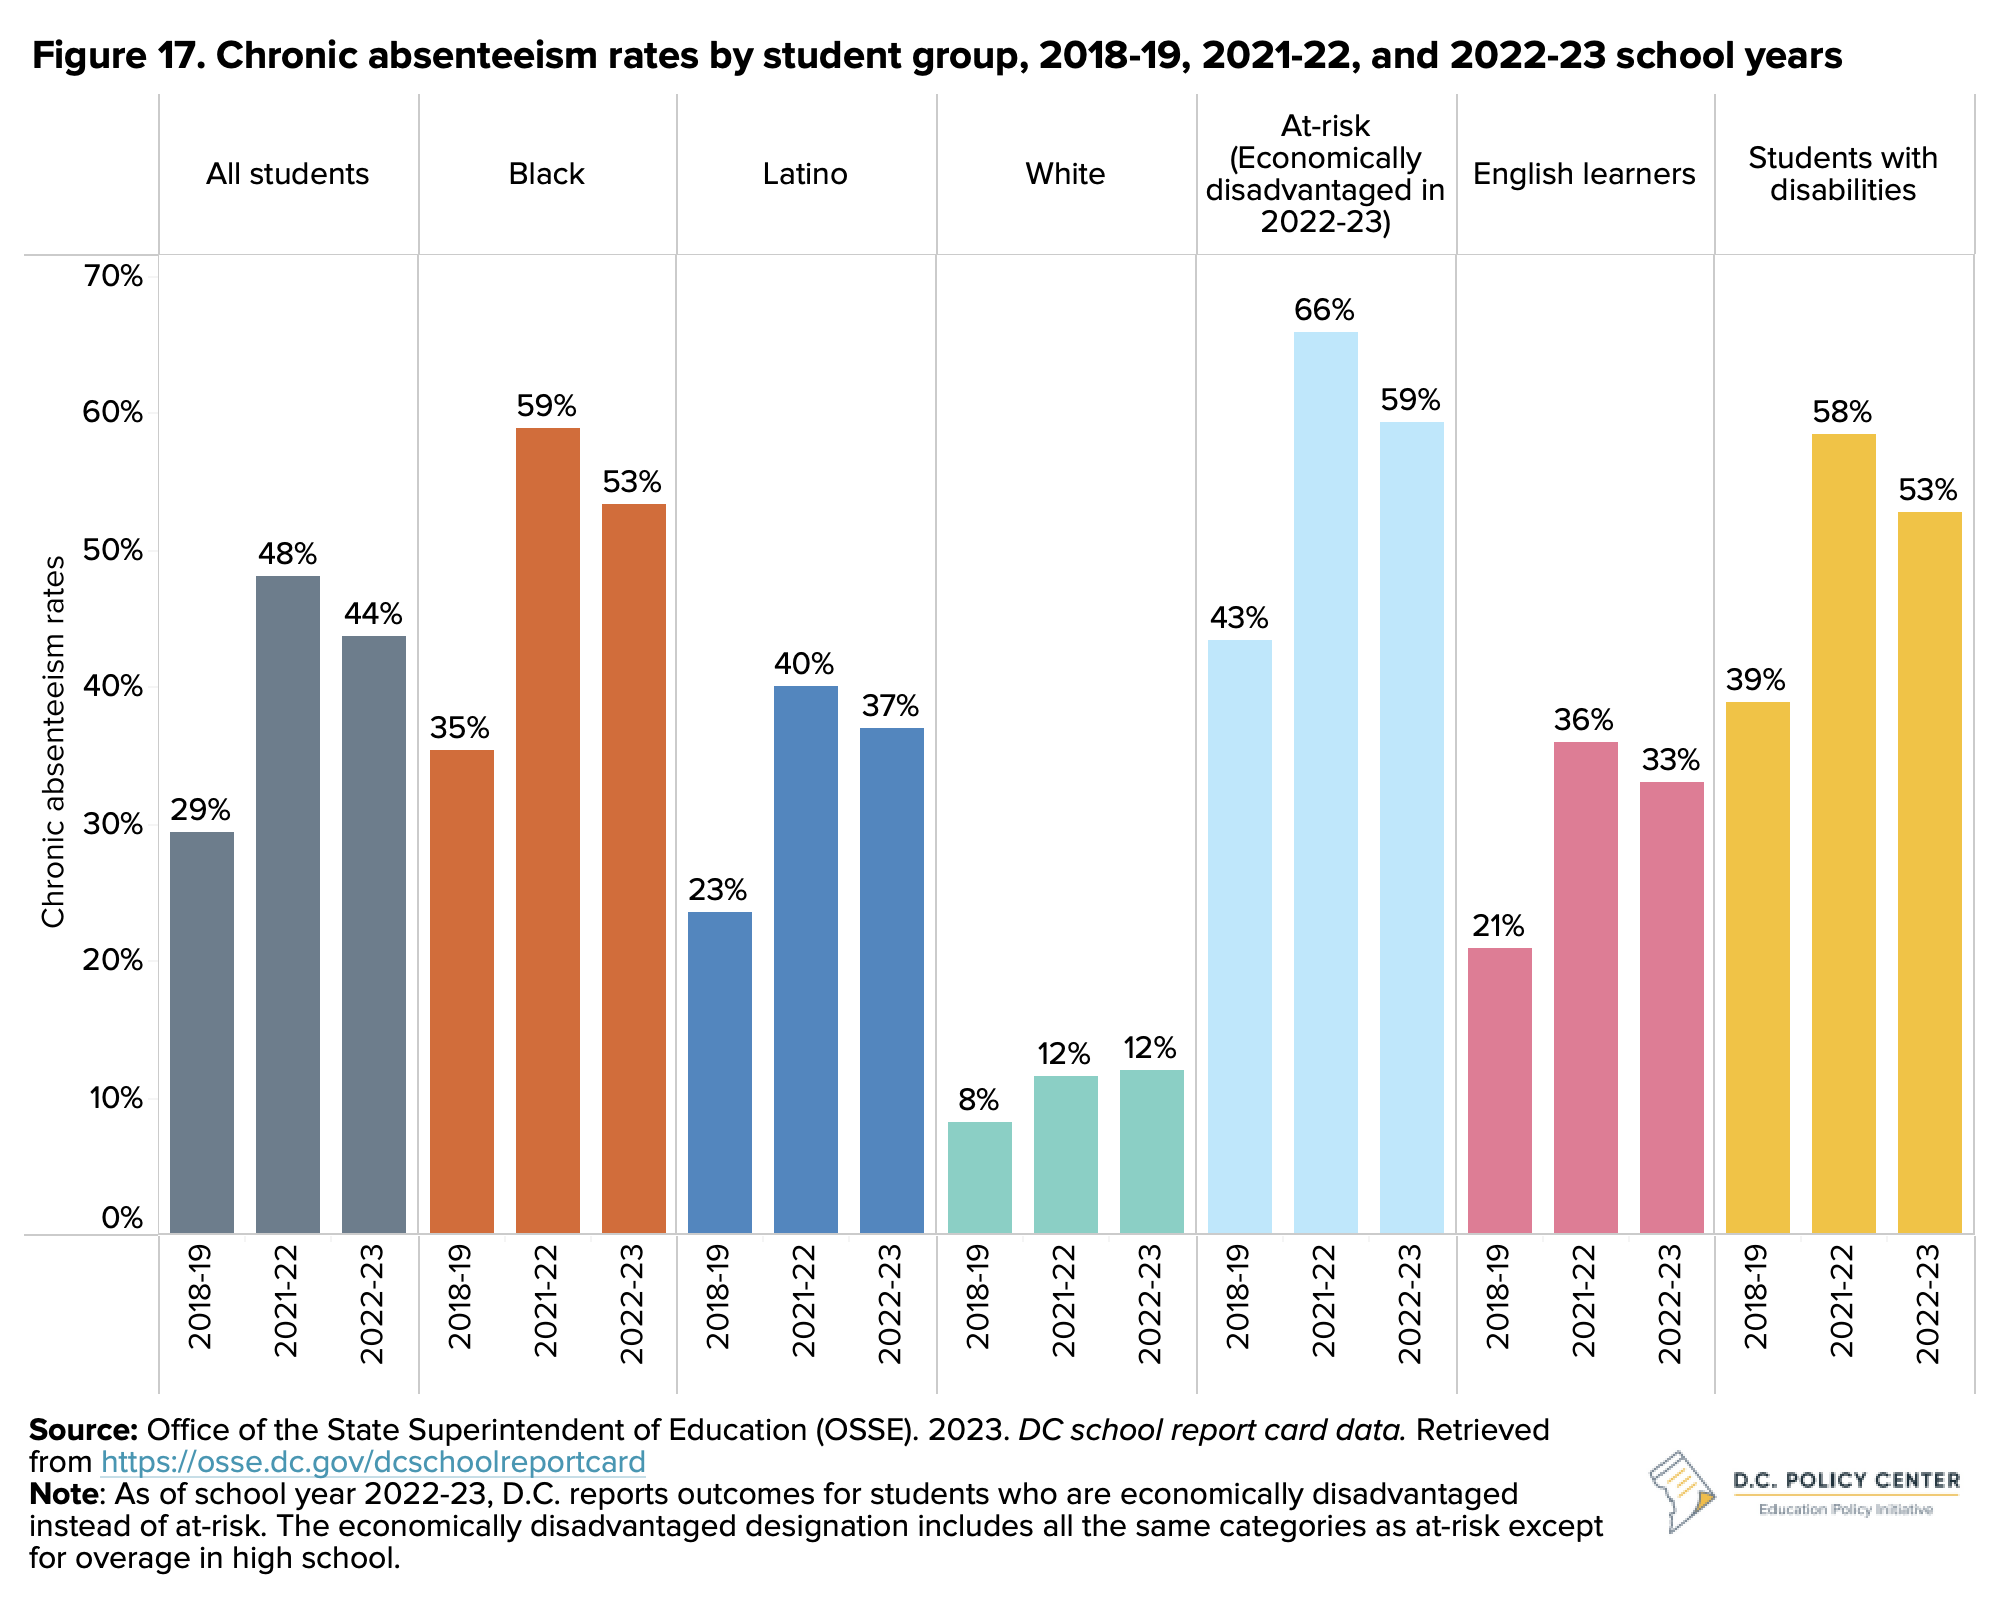
Chronic absenteeism is a particularly big issue in high school, where 60 percent of students are chronically absent. Almost a third of 9th graders start high school with “profound” chronic absenteeism; 31 percent of 9th graders miss 30 percent or more of school days.48
New attendance policy
D.C. implemented a new attendance policy in school year 2022-23, making year to year comparisons tricky. The new attendance policy states that students must attend at least 60 percent of the day, meaning they can miss up to 40 percent of the day without being counted as absent (compared to 20 percent under the old policy). This is a more flexible policy, but it means that students may miss more instructional time. For high schoolers in particular, there is a negative correlation between absenteeism and graduation rates. There are high schools where a majority of students are chronically absent, and a majority graduate.49
DME’s EveryDay Labs intervention
In school year 2022-23, the Office of the Deputy Mayor for Education expanded its partnership with EveryDay Labs (EDL) to offer every public-school serving K-12 students access to this intervention that targets communications to families based on attendance records. In April 2023, DME observed that among 43,629 students who received the intervention, 58 percent improved their attendance rate.
In listening sessions, parents, students, and teachers identified several new factors contributing to the recent rise in absenteeism rates. Illness has become a more common cause. Many mentioned an increase in mental health days, and students and parents are particularly concerned with safety issues when commuting to school especially if students have to drop their siblings off at school which is also contributing to absenteeism and tardiness. Additionally, students reported frequently leaving early.
Participants in listening sessions also shared a noticeable shift in attitudes toward attendance. Both students and families place less importance on physical presence in schools as a requirement for learning, and this is especially true for older students. This shift is attributed to the belief that virtual learning options effectively compensate for missed time in the classroom, thereby diminishing the impact of absences on education. Alongside this, there is a perceived decrease in accountability for attending school.
Successful attendance strategies from Bold Schools
D.C. Policy Center partnered with EmpowerK12 to interview leaders of schools identified as Bold schools that had strong academic results especially among students furthest from opportunity. They mentioned some strategies that were successful in improving attendance.
Making school fun and joyful
– Weekly town halls with Dodgeball, a knockout game, or a shadow boxing competition
– School trips, field experiences or community-based experiences such as the 6th grade Capital Experience Lab
– Attendance incentives like attendance royalty which awarded kids attendance crowns and wristbands, the opportunity to participate in a family raffle after a full week of attendance, or parties where students had the opportunity to dunk the principal and staff for perfect attendance
– Class-level incentives including a golden clock awarded to every home room that has 95 percent attendance for the week and pizza parties
– Maximizing every minute of the day with things like “Strong Start” activities at the beginning of the day so the school day feels like something students don’t want to miss
Engaging families
– Strong and intentional communication with students and families on why students need to be here for a full day targeted toward families with lower attendance
– Outreach to parents through an attendance team made up of a Multi-Tiered System of Support (MTSS) coordinator, counselor, and social worker
– Sending letters and meeting with families to build authentic relationships with parents
– Tier 2 and Tier 3 interventions with frequent family connections and some home visits
– Intensive communication, which includes weekly detailed newsletters reviewing what students accomplished as well as next week’s plans
Addressing needs and barriers to attendance
– Adjusting the school schedule to make sure that the oldest students have core content later and younger students have core content and interventions in the morning
– Partnering with DC Connect or Boys Town to pick up a small number of students at specific sites and drive them to school
– Focus on middle school prep to get 5th graders excited to be in school and for the transition to 6th grade
“Poverty is the biggest barrier to kids coming to school. The majority of our students are in crisis mode. Their stories are staggering. It’s really hard to teach when the vast majority of your students can’t have their basic needs met. I feel like we’re lucky we have social workers at all grade levels, but even then, that’s not enough. Social workers are under stress, they don’t have the capacity to meet the basic needs of our kids. I think that’s a big problem.”
Teacher
“Kids are going to tell parents they don’t want to go to school, and parents are not forcing them to go, but kids don’t have the capacity to make that call yet. I’m frustrated when parents allow the kid to make that call. It’s not my job to get your kid to school, it’s my job to teach them when they’re in school. It’s my job to make them want to stay all day and love learning, but it’s not my job to put their body in the chair. [It’s the] parents’ job to get kids to school.”
Teacher
“In school, [my son] finishes his work fast and gets bored. Before I was like, ‘You can’t miss days…” Now, I’m more lenient. Now, I just tell him to stay home, take a mental health day, and get your work done. Even the interaction with other kids, social stress, they’re not used to that yet. When they’re home, they can still do their work. Before COVID, they weren’t allowed to do that. Now it’s ‘Missing from out of school, assignments complete.’”
Parent of high school student
“If I wake up and try to get ready but find myself sitting there, I tell my mom it’s not happening. Since everything is digital anyway, I still do my work.”
Student
Discipline and school safety
During school year 2022-23, 6 percent of students received at least one out-of-school suspension, up from 4 percent in school year 2021-22 (see Figure 18). This rise occurred during the second full year of the Student Fair Access to School Act, which aimed to restrict the reasons for and durations of out-of-school suspensions. Despite this legislation, suspension rates have returned to pre-pandemic levels for most groups. Black students, economically disadvantaged students, and students with disabilities experienced the highest levels of out-of-school suspensions. Meanwhile, the rate of in-school suspensions increased slightly to 1.7 percent of students.
Restorative justice/approaches to discipline
In school year 2021-22, OSSE began a restorative justice grant program to make discipline practices across schools more effective and equitable.50 The restorative justice initiative, led by RestorativeDC (RDC), was a partnership that allowed RDC to provide technical assistance to 48 schools in which schools reviewed their systems and reshaped them to create more equitable, just environments.51 Schools worked with RDC over a multi-year period to implement a school-wide integration of restorative justice practices that emphasize the need for developing positive school culture, community-based, and proactive and preventative restorative practices. Of the 48 schools working with RDC, approximately 11-15 of them are working intensely on a whole school approach over this multi-year period. The remaining schools are receiving some technical assistance to integrate restorative practices into their school practices/culture, but that varies greatly depending on a number of factors that include how long they have been working to implement restorative practices, staff capacity and buy-in and other factors. Many of these schools are just beginning this process, which like any organizational shift, does not happen overnight. During our listening sessions, some teachers and parents shared that they felt that consequences being left unenforced or that there was lack of buy-in from staff or training that can help improve practice.
“They are helping the bully by providing better coping and discipline, but they’re not thinking about the student who now has to face the bully every day and has a lot of anxiety” – Parent
Community safety
Community safety continues to be an issue for D.C.’s students. When students do not feel safe, they are less likely to attend school, engage academically, or maintain their social and emotional health. During listening sessions, students spoke about safety as important both inside and outside of the classroom.
Concerns about community safety also connect with incidents of violence across the District, in particular homicides. Understanding the impact of violence across D.C. is paramount in understanding how students navigate attending school, academic outcomes, and mental well-being. In school year 2022-23, homicides (used as a metric as the most reliable type of crime reported) decreased by 5 percent over the previous school year to 222, but this level is higher than 158 homicides in school year 2018-19 pre-pandemic.52 Homicides were still disproportionately concentrated in Wards 7 and 8, where 64 percent of the total occurred—meaning that students living in and attending schools in Wards 7 and 8 are more likely to be directly or indirectly exposed to related trauma.
Educator retention
During school year 2022-23, the number of teachers in D.C.’s public schools for pre-kindergarten through grade 12 rose to 8,73253 marking a 7 percent increase over the 8,151 teachers in school year 2021-22.
Teacher retention (defined as staying in the same role as the same school) reached its highest point at 81 percent in school year 2020-21 amidst the pandemic, but dropped back to 70 percent in the fall of 2022, returning to pre-pandemic levels (see Figure 19). This decrease suggests that the initial uncertainty of the pandemic led to fewer job changes among teachers. An additional 9 percent of teachers stayed in D.C.’s public schools but moved to different schools. Early Childhood Education and English as a Second Language teachers stayed in their schools most often (82 percent), while Career Technical Education teachers were most likely to leave (58 percent).54
During our listening sessions, teachers emphasized the importance of clear and visionary leadership, stability and consistency throughout the year, and the flexibility to be creative and manage their schedules when deciding whether to stay or leave.
“I want support but I also want to be respected as an adult [including through] leadership opportunities within the school so I can keep growing in my career but keep teaching.”
Teacher
In school year 2022-23, the citywide vacancy in teaching positions fell to 3 percent from 6 percent in the previous year, suggesting an improved hiring environment for new positions.55 Even with this decrease, however, both teachers and students noted in our listening sessions that navigating staffing shortages remained a significant challenge. Schools used various strategies to cope, such as virtual teachers, in-house substitutes, or having teachers cover additional classes, which often proved burdensome. The difficulty in finding substitutes prompted some schools to hire dedicated substitutes to reduce strain. In our listening sessions, teachers mentioned that dedicated substitutes helped reduce stress, had more familiarity with school culture, and were able to better relate to students.
“The first Wednesday of every month is called Wellness Wednesday. So our dismissal for students is at 1:30. And then once your students are dismissed, then folks can go about doing whatever they need to do to be well.”
School principal
“Teachers miss because they’re burnt out and underpaid. Any given day we’re short staffed and we’re combining three classrooms and the lesson plan goes out the window. It’s not about the enrichment of the program, it’s about the data. This bleeds into my home life too – when I have to deal with all this at work I’m exhausted, and I don’t have the energy to deal with my own kids’ behavior.”
Teacher
“When you have more teachers, more adults in the building supporting students. Students thrive and teachers thrive because they have that extra support.”
School principal
Principal retention
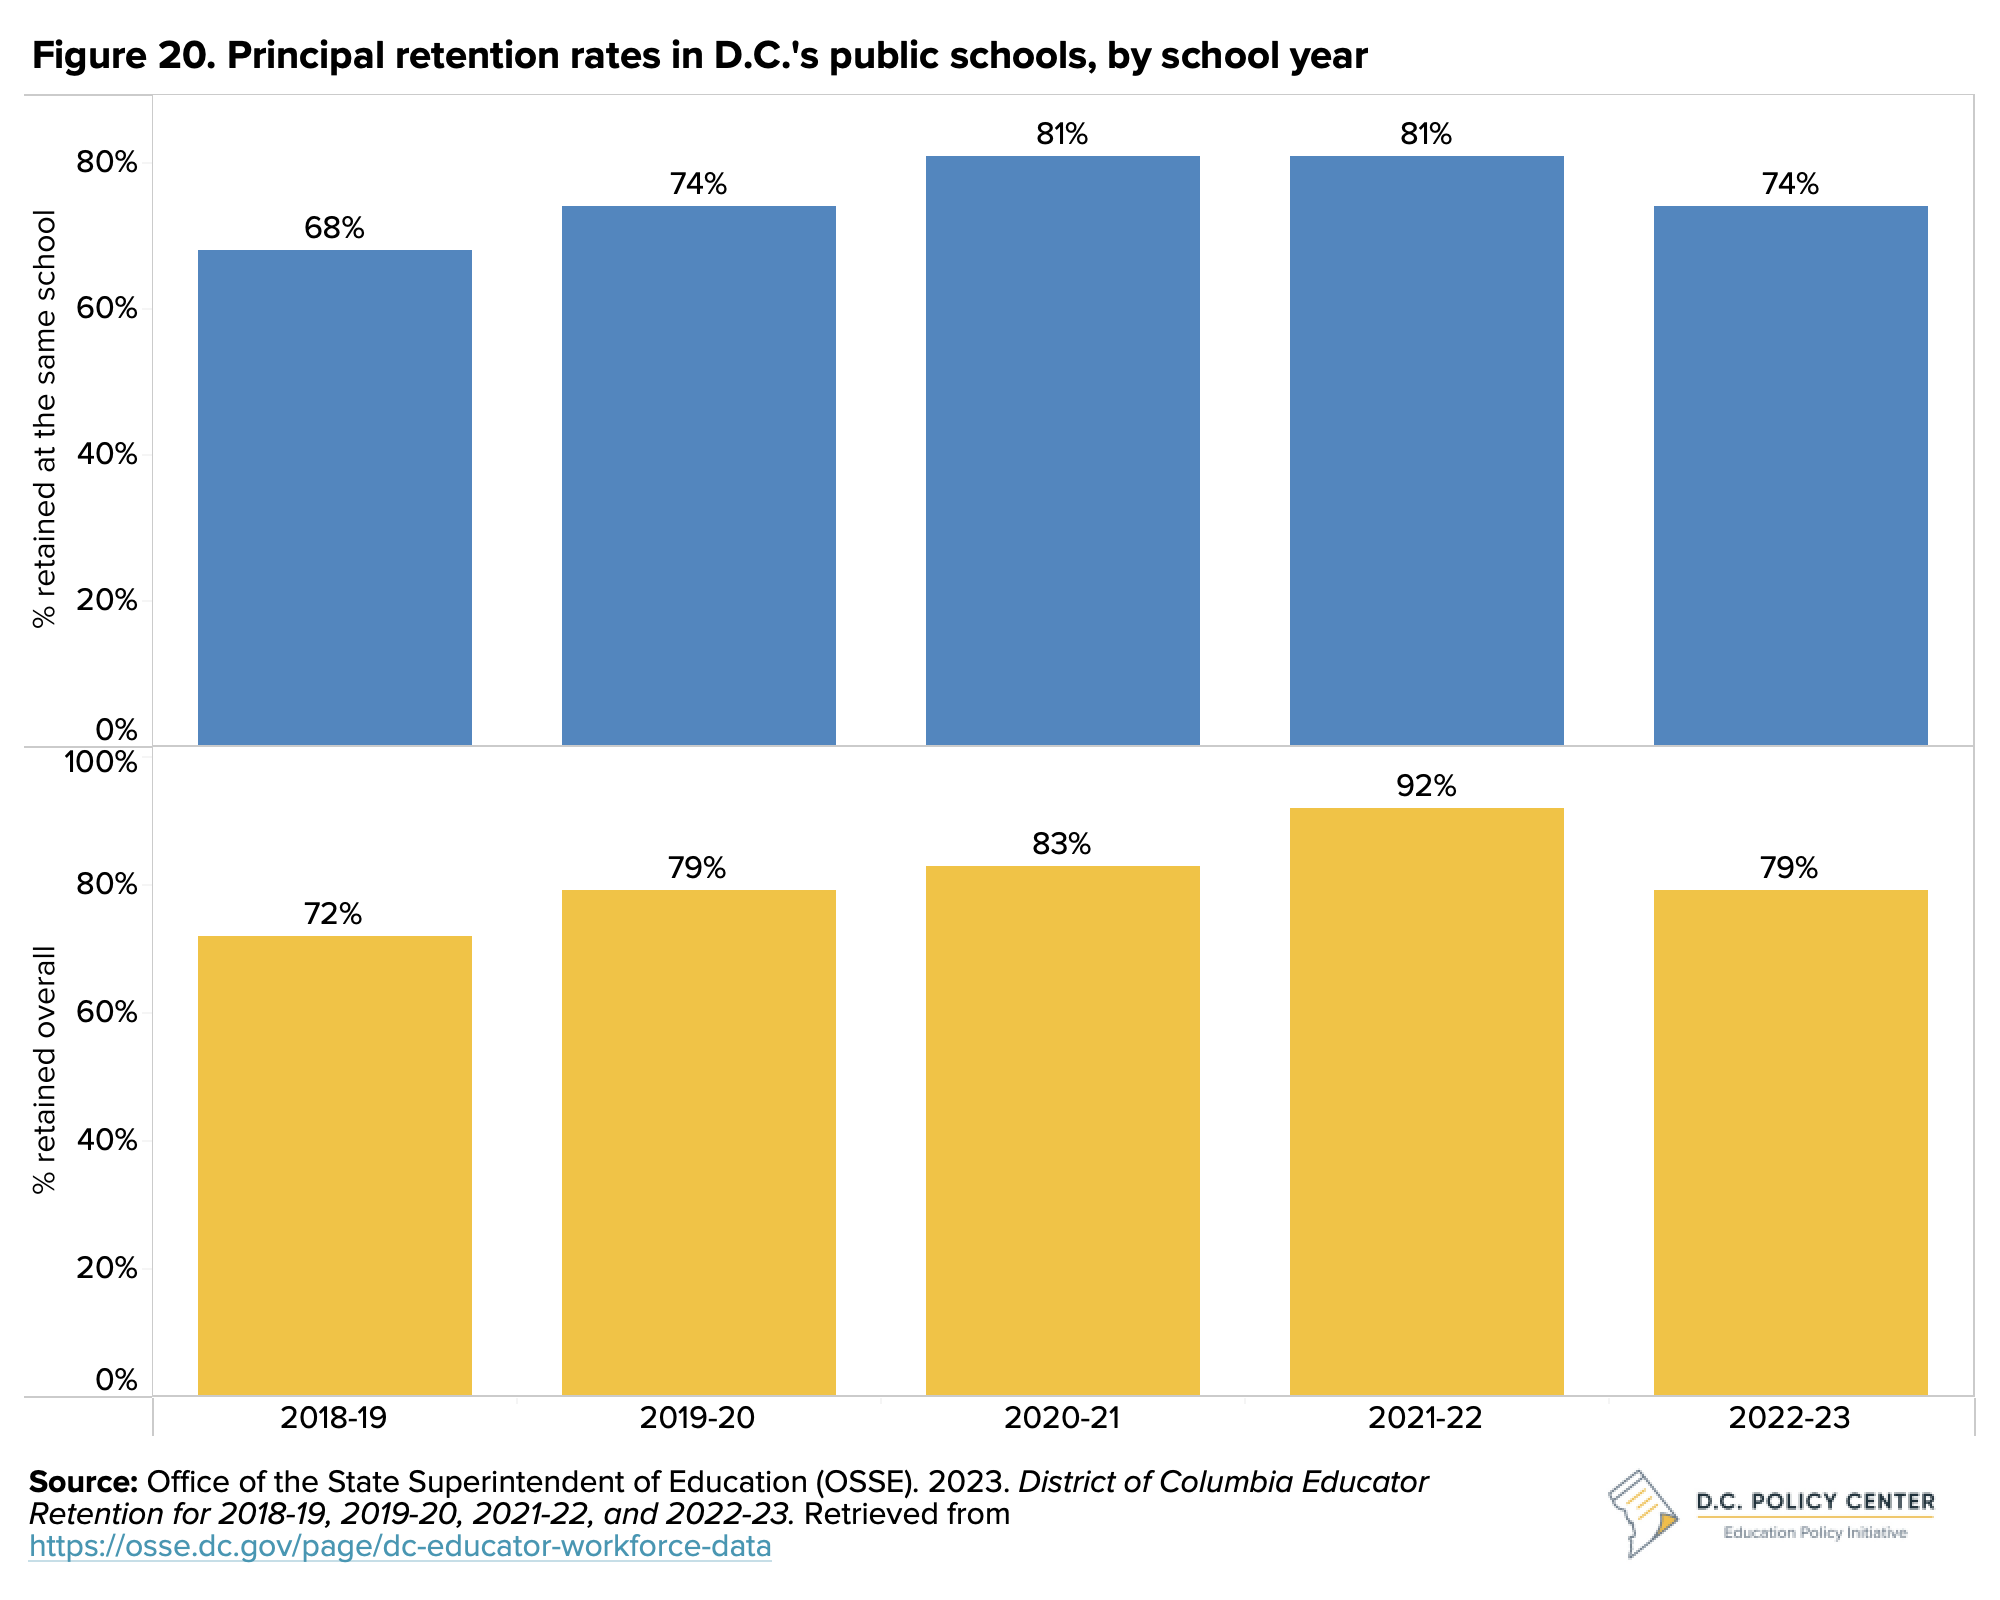
In school year 2022-23, D.C.’s public schools employed 235 principals.56 Of these, 74 percent continued their roles in the same school as the previous school year and another 5 percent remained as D.C. principals, but in different public schools. Principal retention rates have now stabilized to pre-pandemic levels, reflecting a similar trend to teacher retention (see Figure 20). This stabilization follows a period of higher retention during the pandemic. During our listening sessions, teachers expressed a preference for administrators who provided clear direction and flexible schedules and noted that frequent changes in school leadership disrupted the continuity of the school’s vision and mission.
Look ahead to school year 2023-24 and beyond
In school year 2023-24, schools continue to work hard to decrease chronic absenteeism, which is estimated to have improved by between 8 and 12 percentage points for DCPS (data were not available for public charter schools) as of December 1, 2023.57 Enrollment continued to increase to 2.2 percent across all grades. There are a few policy changes that have the potential to shift the education landscape in the years to come, including three studies from the DME, a new public charter accountability framework, a bigger push for a school climate survey, and a new Education through Employment data system. There are challenges ahead, too, with the potential of a fiscal cliff after ESSER funds run out.
DME studies
In 2023 and 2024, the DME is undertaking three interrelated studies on school boundaries, school facilities, and school funding. The first study, the Boundary and Student Assignment Study will evaluate the current boundaries, feeder patterns, and student assignment policies of DCPS, with plans to make recommendations in 2024 to be implemented no earlier than school year 2025-26. Some policies would take longer to implement – this is the earliest that boundary revisions would go into effect.
The second study, the D.C. Public Education Master Facilities Plan (MFP), is a 5- to 10-year strategic plan that aims to optimize school facilities use, guarantee that all students attend modern, state-of-the-art facilities, and ensure that all school facilities are well-maintained.
The third is a funding adequacy study, the first since 2013, which will assess how D.C. distributes resources to improve school quality. This study may lead to revisions in the Uniform Per Student Funding Formula (UPSFF), adjustments to funding formula weights and policies, changes in non-formula funding, and alterations in how school budgets are developed.
In addition to the above studies, the DME is convening a School Safety Enhancement Committee with the objective of providing actionable recommendations on ways schools and those within the school ecosystem can ensure public schools are safe for all youth and children. The committee is comprised of representatives and experts from city education and public safety agencies. The committee will meet between November 2023 and January 2024 and deliver a final report to the Mayor in February 2024.58
Public charter schools accountability framework
The D.C. Public Charter School Board (DC PSCB) has proposed a new academic accountability system, Annual School Performance Index Report & Evaluation (ASPIRE)lix to more effectively evaluate the quality of education for students from marginalized backgrounds. One notable change is a move from a three-tier evaluation scale to a five-tier scale. Another change is the inclusion of school-specific mission and goals in the evaluation rubric. The framework will also consider not just post-secondary outcomes, but also career outcomes, and have a greater focus on absenteeism. This framework will be applied for the first time in school year 2025-26.59
Education through Employment data system
DME has created the Office of Education Through Employment Pathways to support D.C. residents on the path to accessing good jobs and to achieve economic mobility. A key initiative of this office is to establish an Education Through Employment data system. This system will collect, analyze, and report data on the progress of D.C. residents in education, workforce training, and employment.60
Once this data system is in place, for the first time, D.C. will be able to assess the early career outcomes of former D.C. public school students and gain valuable insights on the effectiveness of programs offered to assist D.C. residents in accessing employment opportunities.
Fiscal Cliff
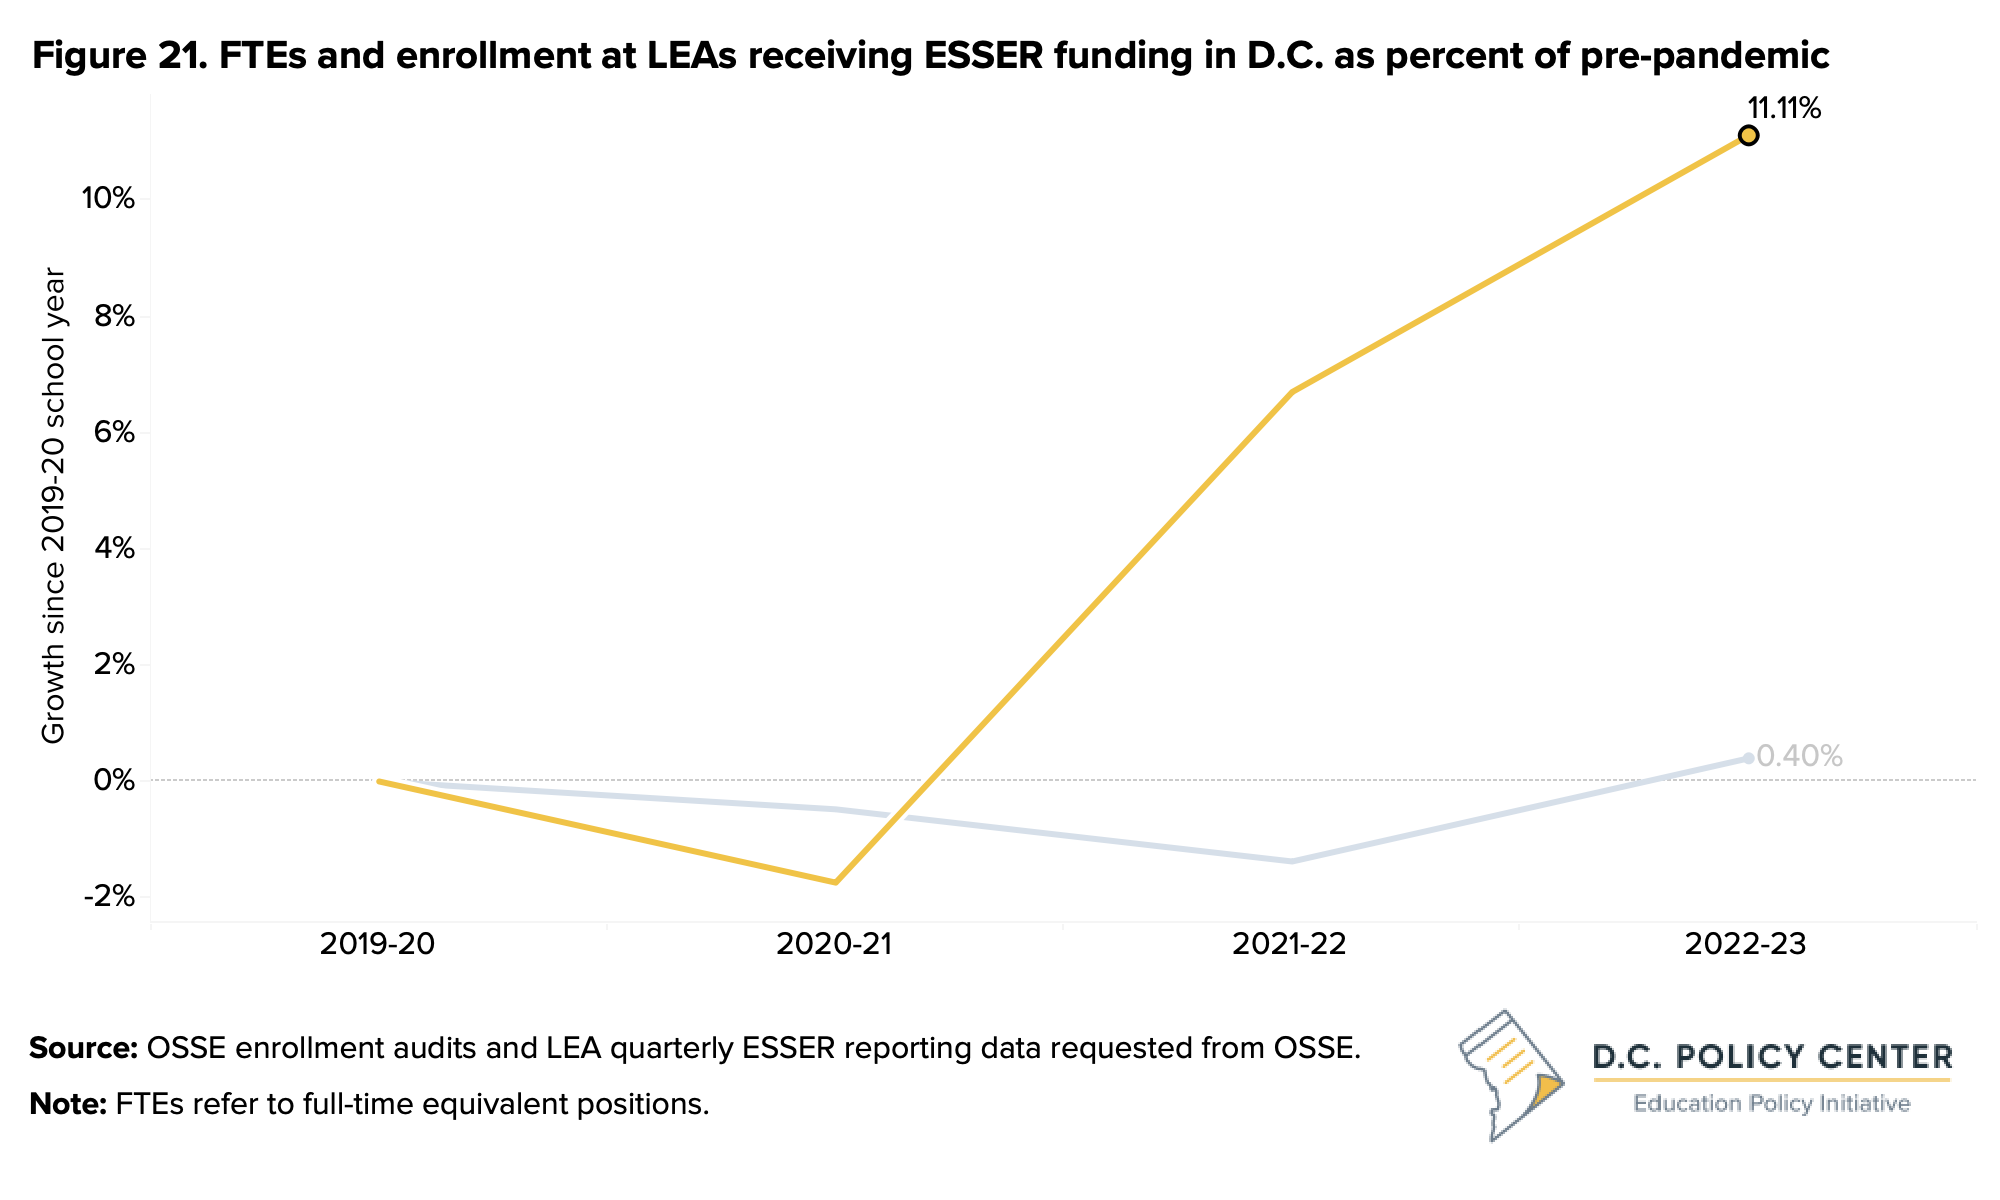
D.C.’s public schools may face a fiscal cliff when ESSER funds are no longer available in school year 2024-25, although there will be potential for leveraging late liquidation to help soften the landing with an extension period. Public funding for schools increased by 56 percent from fiscal year 2019 to 2024, alongside a 9 percent increase in enrollment. An estimated two-thirds of this increase came from UPSFF increases and one-third came from ESSER and other one-time funding.61 Adding a pressure point, Full-Time Equivalents (FTEs) or staff counts have risen faster than enrollments at LEAs receiving ESSER funds, and these extra supports and federal resources will be a challenge to replace moving forward (see Figure 21). The Mayor has proposed a historic 12.4 percent increase to the UPSFF in school year 2024-25, which will provide a smoother landing and allow schools to continue to address many of the pandemic recovery challenges.
Conclusion
Education in D.C. is at a pivotal time in recovery after the pandemic. As the data show, much work is needed to return to and to surpass the progress that was ongoing pre-pandemic (see Figure 22). Chronic absenteeism is a top priority, as students being in school make it possible to learn, to benefit from mental health supports, to participate in opportunities that connect them to college and career, and so much more. The expanded role of schools, which got even larger during the pandemic, can be a challenge to maintain—while necessary as many student needs are outside of the classroom.
Moving forward in this new normal, schools in D.C. should come together with a vision for success post-pandemic, how to achieve it, and how to measure it. This could mean reimagining the school experience with a new citywide focus on school climate. It could mean a new look at experiences after high school with the Education Through Employment data system. It could mean thinking through staffing and flexible scheduling to improve teacher retention. In all these areas, D.C.’s schools need a pledge to improve outcomes for young people—a citywide goal and what each school can do to move the needle to these ends. Importantly, there should be a realignment of incentives that have shifted during the pandemic.
Endnotes
- Dee, T. S. 2023. “Where the Kids Went: Nonpublic Schooling and Demographic Change during the Pandemic Exodus from Public Schools.” Urban Institute: The Learning Curve. Retrieved from https://www.urban.org/sites/default/files/2023-02/Where%20the%20Kids%20Went-%20Nonpublic%20Schooling%20and%20Demographic%20Change%20during%20the%20Pandemic%20Exodus%20from%20Public%20Schools_0.pdf
- District of Columbia Public Schools. At-Risk Funding. Retrieved from https://dcpsbudget.com/budget-model/at-risk-funding/
- Maryland State Department of Education. 2024. “2023 Maryland State Schools at a Glance.” Maryland State Department of Education. Retrieved from https://reportcard.msde.maryland.gov/Graphs/#/AtaGlance/Index/3/17/6/99/XXXX
- Virginia Department of Education. 2024. “Fall Membership Build-A-Table.” Virginia Department of Education. Retrieved from https://www.doe.virginia.gov/data-policy-funding/data-reports/statistics-reports/enrollment-demographics
- Coffin, C. and Rubin, J. 2022. Declining enrollment and lower demand: Charting the future of public school enrollment in D.C. D.C. Policy Center. Retrieved from https://www.dcpolicycenter.org/publications/enrollment-decline/
- Coffin, C. and Mason, H. 2023. Chart of the week: 9th grade repetition is down after the pandemic. D.C. Policy Center. Retrieved from https://www.dcpolicycenter.org/publications/9th-grade-repetition/
- Office of the State Superintendent of Education (OSSE). 2023. “Office of the State Superintendent of Education Responses to Fiscal Year 2022 Performance Oversight Questions.” DC Council. Retrieved from https://dccouncil.gov/wp-content/uploads/2023/06/2023OS1.pdf
- D.C Act 23-0548, DC Law 23-0191 Effective from Mar 16, 2021. This bill was originally enacted without sufficient funding to implement it, but OSSE was able to implement it in school year 2022-23.
- Office of the State Superintendent of Education (OSSE). 2022. EL Exit Criteria Change: 2021-22 School Year. Retrieved from https://osse.dc.gov/sites/default/files/dc/sites/osse/publication/attachments/EL%20Exit%20Criteria%20Change%20for%20Website.pdf
- Office of the State Superintendent of Education (OSSE). 2023. Responses to Fiscal Year 2022 Performance Oversight Questions. Retrieved from https://osse.dc.gov/sites/default/files/dc/sites/osse/page_content/attachments/FY22%20OSSE%20Performance%20Oversight%20Hearing%20Council%20Responses.pdf
- Similar to the Office of the Deputy Mayor for Education (DME), this State of D.C. Schools report focuses on the three largest races and ethnicities in D.C. as the size of each other group is 3 percent or less.
- Coffin, C. and Rubin, J. 2023. D.C.’s adult public charter schools: Who they serve, how they serve, and what they achieve. D.C. Policy Center. Retrieved from https://www.dcpolicycenter.org/publications/adult-charters/
- Coffin, C., & Rubin, J. 2023. D.C.’s adult public charter schools: Who they serve, how they serve, and what they achieve. D.C. Policy Center. https://www.dcpolicycenter.org/publications/adult-charters/#:~:text=Academic%20programs%20at%20adult%20public,Second%20Language%20(ESL)%20programs.&text=All%20nine%20adult%20public%20charter%20schools%20also%20offer%20workforce%20development,variety%20of%20in%2Ddemand%20fields
- United States Census Bureau. 2023. “Census Bureau Releases New Educational Attainment Data.” United States Census Bureau. Retrieved from https://www.census.gov/newsroom/press-releases/2023/educational-attainment-data.html
- Office of the State Superintendent of Education (OSSE). 2023. 2023 DC School Report Card. Retrieved from https://osse.dc.gov/page/dc-school-report-card-resource-library
- The Washington Informer. 2023. DCPS Launches Sixth Grade Academies to Ease Middle School Transition. Retrieved from https://www.washingtoninformer.com/dcps-launches-sixth-grade-academies-to-ease-middle-school-transition/
- District of Columbia Public Schools. District-Wide Summer Programs. Retrieved from https://dcps.dc.gov/summer
- District of Columbia Public Schools (DCPS). 2023. Introducing DCPS 6th Grade Academies. Retrieved from https://dcps.dc.gov/sites/default/files/dc/sites/dcps/page_content/attachments/Sixth%20Grade%20Academy%20One-Pager%20FINAL.pdf
- D.C. Education Fund. DC Reading Clinic. Retrieved from https://dcedfund.org/initiative/reading-clinic/
- D.C. Reading Clinic. In Schools Program. Retrieved from https://www.dcreadingclinic.org/general-6
- DC Reading Clinic. DC Reading Clinic. Retrieved from https://www.dcreadingclinic.org/how-does-it-work
- DC Reading Clinic. For Potential Teachers. Retrieved from https://www.dcreadingclinic.org/for-aspiring-reading-specialists
- EmpowerK12. 2023. Status of K-2 Literacy & Numeracy in DC. Retrieved from https://www.empowerk12.org/research-source/status-k-2-literacy-numeracy
- EmpowerK12. 2023. Status of K-2 Literacy & Numeracy in DC. Retrieved from https://www.empowerk12.org/research-source/status-k-2-literacy-numeracy
- Office of the State Superintendent of Education (OSSE). 2023. Early Literacy Education Task Force – Recommendations for structured literacy implementation in the District of Columbia. Retrieved from https://osse.dc.gov/sites/default/files/dc/sites/osse/page_content/attachments/Early%20Literacy%20Task%20Force%20Report.pdf
- Coffin, C. 2023. Chart of the week: New PARCC data show overall gain for DC students last year—but high school progress remained flat. D.C. Policy Center. Retrieved from https://www.dcpolicycenter.org/publications/parcc-data-gains/
- Coffin, C & Mason, H. 2023. Chart of the Week: 9th grade repetition is down after the pandemic. D.C. Policy Center. Retrieved from https://www.dcpolicycenter.org/publications/9th-grade-repetition/
- Office of the Chief Financial Officer (OCFO). 2022. FY2023 Approved Budget and Financial Plan: Volume 3 Agency Budget Chapters – Part II. Retrieved from https://app.box.com/s/cor7yfhlqka2i8j52xdjvjqmw0jr35vz
- KIPP DC. College and Career Guidance. Retrieved from https://www.kippdc.org/kipp-forward/college-career-guidance/#:~:text=KIPP%20Forward%20provides%20students%20with,college%2C%20career%2C%20and%20beyond
- KIPP DC Public Schools. College and Career Guidance. Retrieved from https://www.kippdc.org/kipp-forward/college-career-guidance/
- KIPP Public Schools. KIPP College Partnerships. Retrieved from https://www.kipp.org/approach/kipp-forward/college-partnerships/
- E.L. Haynes. Alumni Resources. Retrieved from https://www.elhaynes.org/resources/alumni-resources/
- E.L. Haynes Public Charter School. Pre-College Programs. Retrieved from https://www.elhaynes.org/resources/pre-college-program/
- FutureEd. 2024. “Explainer: Progress in Spending Federal K-12 Covid Aid: State by State.” FutureEd. Retrieved from https://www.future-ed.org/progress-in-spending-federal-k-12-covid-aid-state-by-state/
- Office of the State Superintendent of Education. (OSSE). 2023. LEA Esser Dashboard. Retrieved from https://osse.dc.gov/page/lea-esser-dashboard
- Office of the State Superintendent of Education (OSSE). 2023. LEA Continuous Education Plans. Retrieved from https://osse.dc.gov/page/2022-23-lea-continuous-education-plans
- District of Columbia – Office of the State Superintendent of Education. 2023. High-Impact Tutoring Report: Fiscal Year 2023. Retrieved from https://lims.dccouncil.gov/downloads/LIMS/53648/Introduction/RC25-0078-Introduction.pdf?Id=169622
- District of Columbia – Office of the State Superintendent of Education. 2023. High-Impact Tutoring Report: Fiscal Year 2023. Retrieved from https://lims.dccouncil.gov/downloads/LIMS/53648/Introduction/RC25-0078-Introduction.pdf?Id=169622 Note: OSSE defines priority schools as a school identified as a comprehensive support and improvement (CSI) school under DC’s Every Student Succeeds Act State Plan or a school with 70% or more of the student body designated as at-risk.
- The New York Times. 2023. Track Covid-19 in Washington, D.C. The New York Times. Retrieved from https://www.nytimes.com/interactive/2023/us/washington-district-of-columbia-covid-cases.html
- Carroll, K., Patel, P., Lambert, E., and Steel King, M. 2023. Students Speak: A Snapshot of Youth Well-Being in the District of Columbia. Bellwether. Retrieved from https://bellwether.org/publications/students-speak/
- Bellwether – Education Partners. 2023. Students Speak – A Snapshot of Youth Well-Being in the District of Columbia. Retrieved from https://bellwether.org/wp-content/uploads/2023/04/StudentsSpeak_Bellwether_April2023.pdf
- DCPS Connected Schools. DCPS Connect Schools. Retrieved from https://dcps.dc.gov/page/dcps-connected-schools
- DCPS Connected Schools. Our Model. Retrieved from https://www.dcpsconnectedschools.org/our-model
- DCPS Connected Schools. DCPS Connect Schools. Retrieved from https://www.dcpsconnectedschools.org/
- Social workers have a Master’s degree in social work, professional counselors have a Master’s degree in social work, psychologists have Master’s degrees in psychology, and psychiatrists have completed psychology training as well as a Doctor of Medicine (MD) degree. Graduate mental health workers practice under supervision.
- Attendance Works. 2023. Rising Tide of Chronic Absence Challenges Schools. Retrieved from https://www.attendanceworks.org/rising-tide-of-chronic-absence-challenges-schools/#:~:text=Released%20through%20Ed%20Data%20Express,year%20prior%20to%20the%20pandemic.
- Institute of Education Sciences. 2023. Teacher Attrition and Mobility. Retrieved from https://nces.ed.gov/pubs2024/2024039SummaryM.pdf
- Office of the State Superintendent of Education (OSSE). 2023. District of Columbia – Attendance Report 2022-23 School Year. Retrieved from https://osse.dc.gov/sites/default/files/dc/sites/osse/publication/attachments/2022-23%20Attendance%20Report_FINAL_0.pdf
- Mason, H. 2023. Chronic absenteeism is still higher than pre-pandemic, especially in high school grades. D.C. Policy Center. Retrieved from https://www.dcpolicycenter.org/publications/chronic-absenteeism-dc-public-schools/
- Office of the State Superintendent of Education (OSSE). 2023. State of Discipline: School Year 2021-22. Retrieved from https://osse.dc.gov/sites/default/files/dc/sites/osse/page_content/attachments/2021-22%20Discipline%20Report_2.pdf
- Office of the State Superintendent of Education (OSSE). 2023. State of Discipline: School Year 2021-22. Retrieved from https://osse.dc.gov/sites/default/files/dc/sites/osse/page_content/attachments/2021-22%20Discipline%20Report_2.pdf
- Office of the Chief Technology Officer (OCTO). 2023. Open Data DC: Crime Incidents. Retrieved from https://opendata.dc.gov/
- Office of the State Superintendent of Education (OSSE). 2022-23 Educator Workforce Data. Retrieved from https://osse.dc.gov/page/dc-educator-workforce-data Note: 8,732 teachers comprises of PK3-12th grade teachers only.
- Office of the State Superintendent of Education (OSSE). 2023. Educator Workforce Retention Brief. Retrieved from https://osse.dc.gov/sites/default/files/dc/sites/osse/page_content/attachments/EduRetention_1pager_022423.pdf
- Office of the State Superintendent of Education (OSSE). 2023. 2022-23 Educator Workforce Data. Retrieved from https://osse.dc.gov/page/dc-educator-workforce-data
- Office of the State Superintendent of Education (OSSE). 2023. Educator Workforce Retention Brief. Retrieved from https://osse.dc.gov/sites/default/files/dc/sites/osse/page_content/attachments/EduRetention_1pager_022423.pdf
- District of Columbia Public Schools (DCPS). 2023. “Chronic Absenteeism is Down Across All Wards.” DCPS. Retrieved from https://x.com/dcpublicschools/status/1737205410485219638?s=20
- Office of the Deputy Mayor for Education (DME). 2023. Boundary and Student Assignment Study. Retrieved from https://dme.dc.gov/boundaries2023
- District of Columbia Public Charter School Board (DC PCSB). 2023. “A New Way Forward on Charter School Academic Accountability. DC PCSB. Retrieved from https://dcpcsb.egnyte.com/dl/PDtknsippu
- Department of Education; establishment; authority. § 38–191. (2018). https://code.dccouncil.gov/us/dc/council/code/sections/38-191
- Sayin, Y. and Coffin, C. 2024. “The fiscal future of public education in the District of Columbia.” D.C. Policy Center. Retrieved from https://www.dcpolicycenter.org/publications/dc-fiscal-future-in-education/