

In recent years, the District has lost population but gained households. This growth has been largely driven by singles living by themselves. By 2021, single-person households constituted 48 percent of all households in D.C., up from 42 percent in 2015. During this period, the share of family households—households with multiple related people—declined from 45 percent to 40 percent.
Household composition provides important context for other observed outcomes in D.C. For example, it can offer additional insights into why real median household income in D.C. declined by over $8,000 (measured in 2021 dollars) between 2019 and 2021. While, on its face, declining median incomes may suggest that households in D.C. are getting impoverished, household composition data show that we are also observing the impacts of the growth in single-person households (with a single income), especially in the 25 to 34 age group.
The growth in single-person households can also provide valuable insights into housing demand. Continued growth in the number of single-person households will likely put additional pressure on the District’s housing market, making it all the more important to produce more housing. The city’s ability to grow its housing supply is critical now for making the city attractive for new residents, and it will be critical in the future, for keeping them in the city as today’s younger singles age, form families, and increase their incomes.
Recently, the main source of population growth in the District shifted from net in-migration to natural growth.1 During the same period, the city experienced slower growth in tax filers relative to taxable incomes and income tax revenue.2 Outmigration, net of those who moved into the city, resulted in a loss of over 16,000 tax filers and $3.1 billion in adjusted gross income from 2019 through 2021 (though the income loss is offset by the increasing incomes of those who did not migrate to another state).3 Other researchers found that the loss to outmigration was greatest among those between the ages of 26 and 44.4
Less attention, however, has been given to the change in the makeup of District households over time. U.S. Census data show that the District has kept adding new households, even when the city was losing population through the pandemic. 5 Importantly, this growth has been driven by single-person households, especially singles aged 25 to 34 and over the age of 55.
Household data are important because we can glean from these data insights into future demographic trends, such as the increase or decrease of families with children, what pressures the housing market might face, and the city’s income tax revenue potential.6
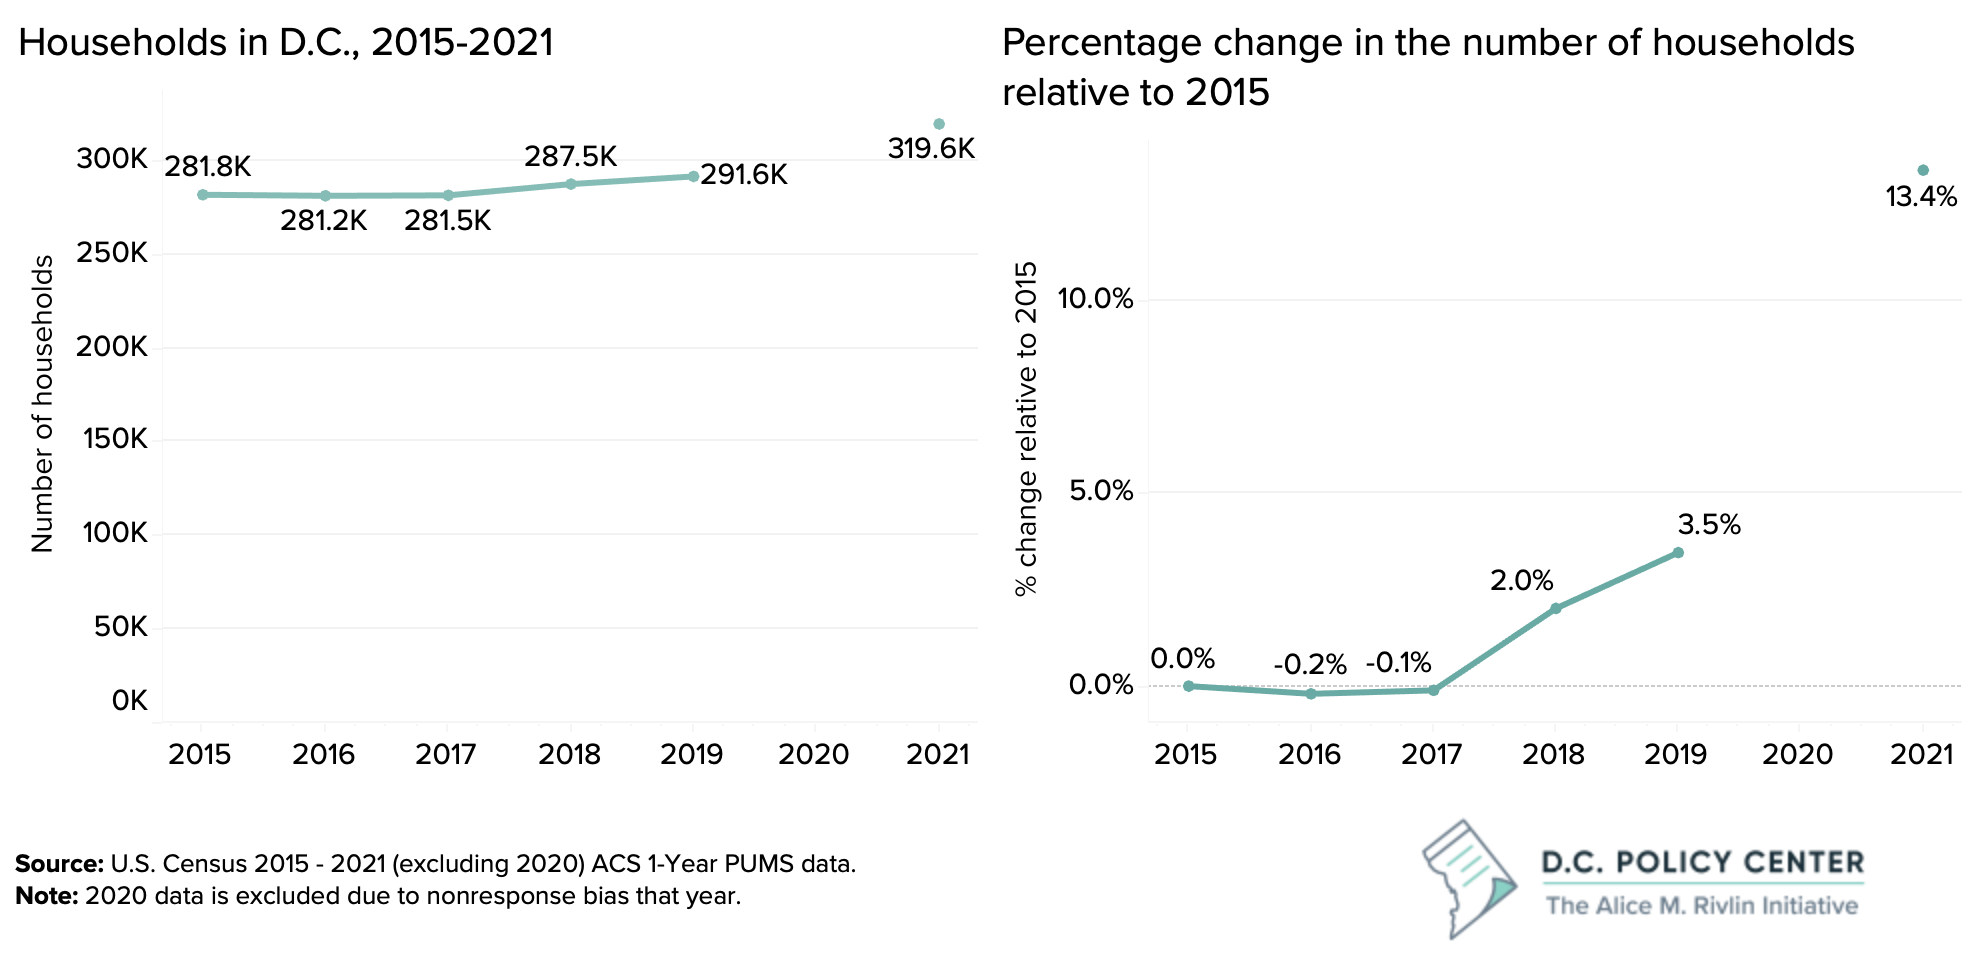
Since, 2019, D.C. has lost population but gained households.
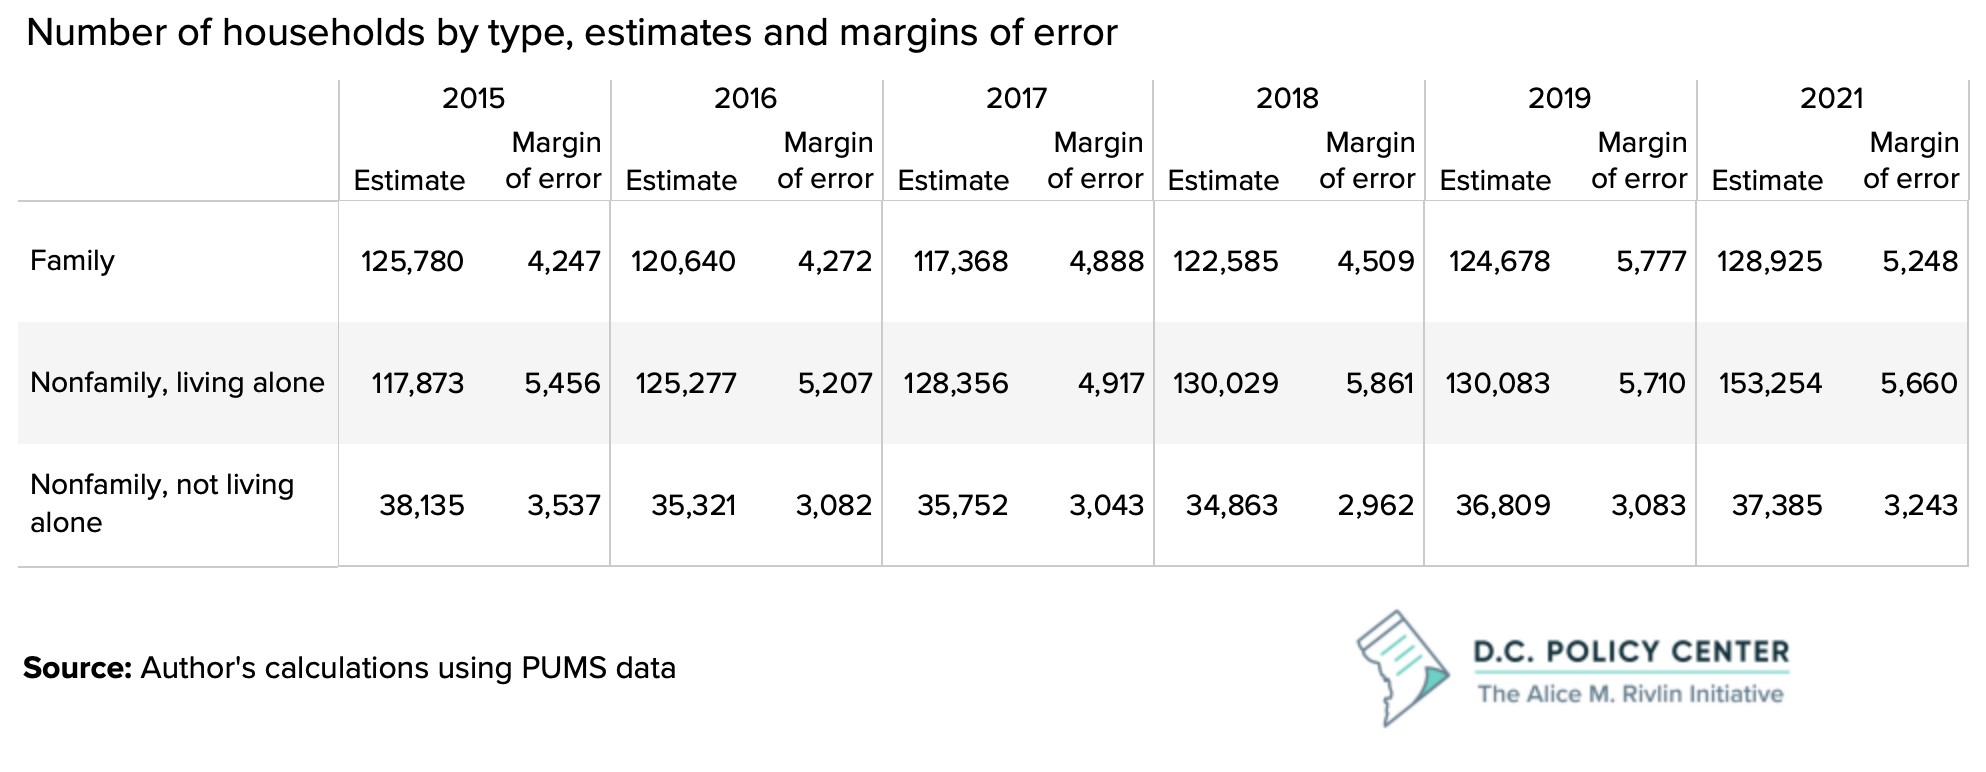
Between 2015 and 2021, the number of households in D.C. grew from 281,788 to 319,564, a 13.4 percent jump (37,800 new households). Much of this increase occurred between 2019 and 2021 when the number of households increased by 9.6 percent (27,994). Despite the uptick in households, during this period, the District has lost population: the city’s estimated population for 2021 was 668,791, a 5 percent decline from 2019.7
The sudden increase in the number of households was largely driven by the formation of new single-person households or breaking up of existing households, rather than new family households forming. Between 2015 and 2021, nonfamily, single-person households grew by 35,381, a 30 percent jump. And between 2019 and 2021, households in this group grew by 24,329, accounting for 83 percent of all household growth since 2015. Meanwhile, family households are only up by 2.5 percent since 2015 (with all this growth happening since 2019), and the number of nonfamily households with multiple members (such as roommates or unmarried couples) has declined.
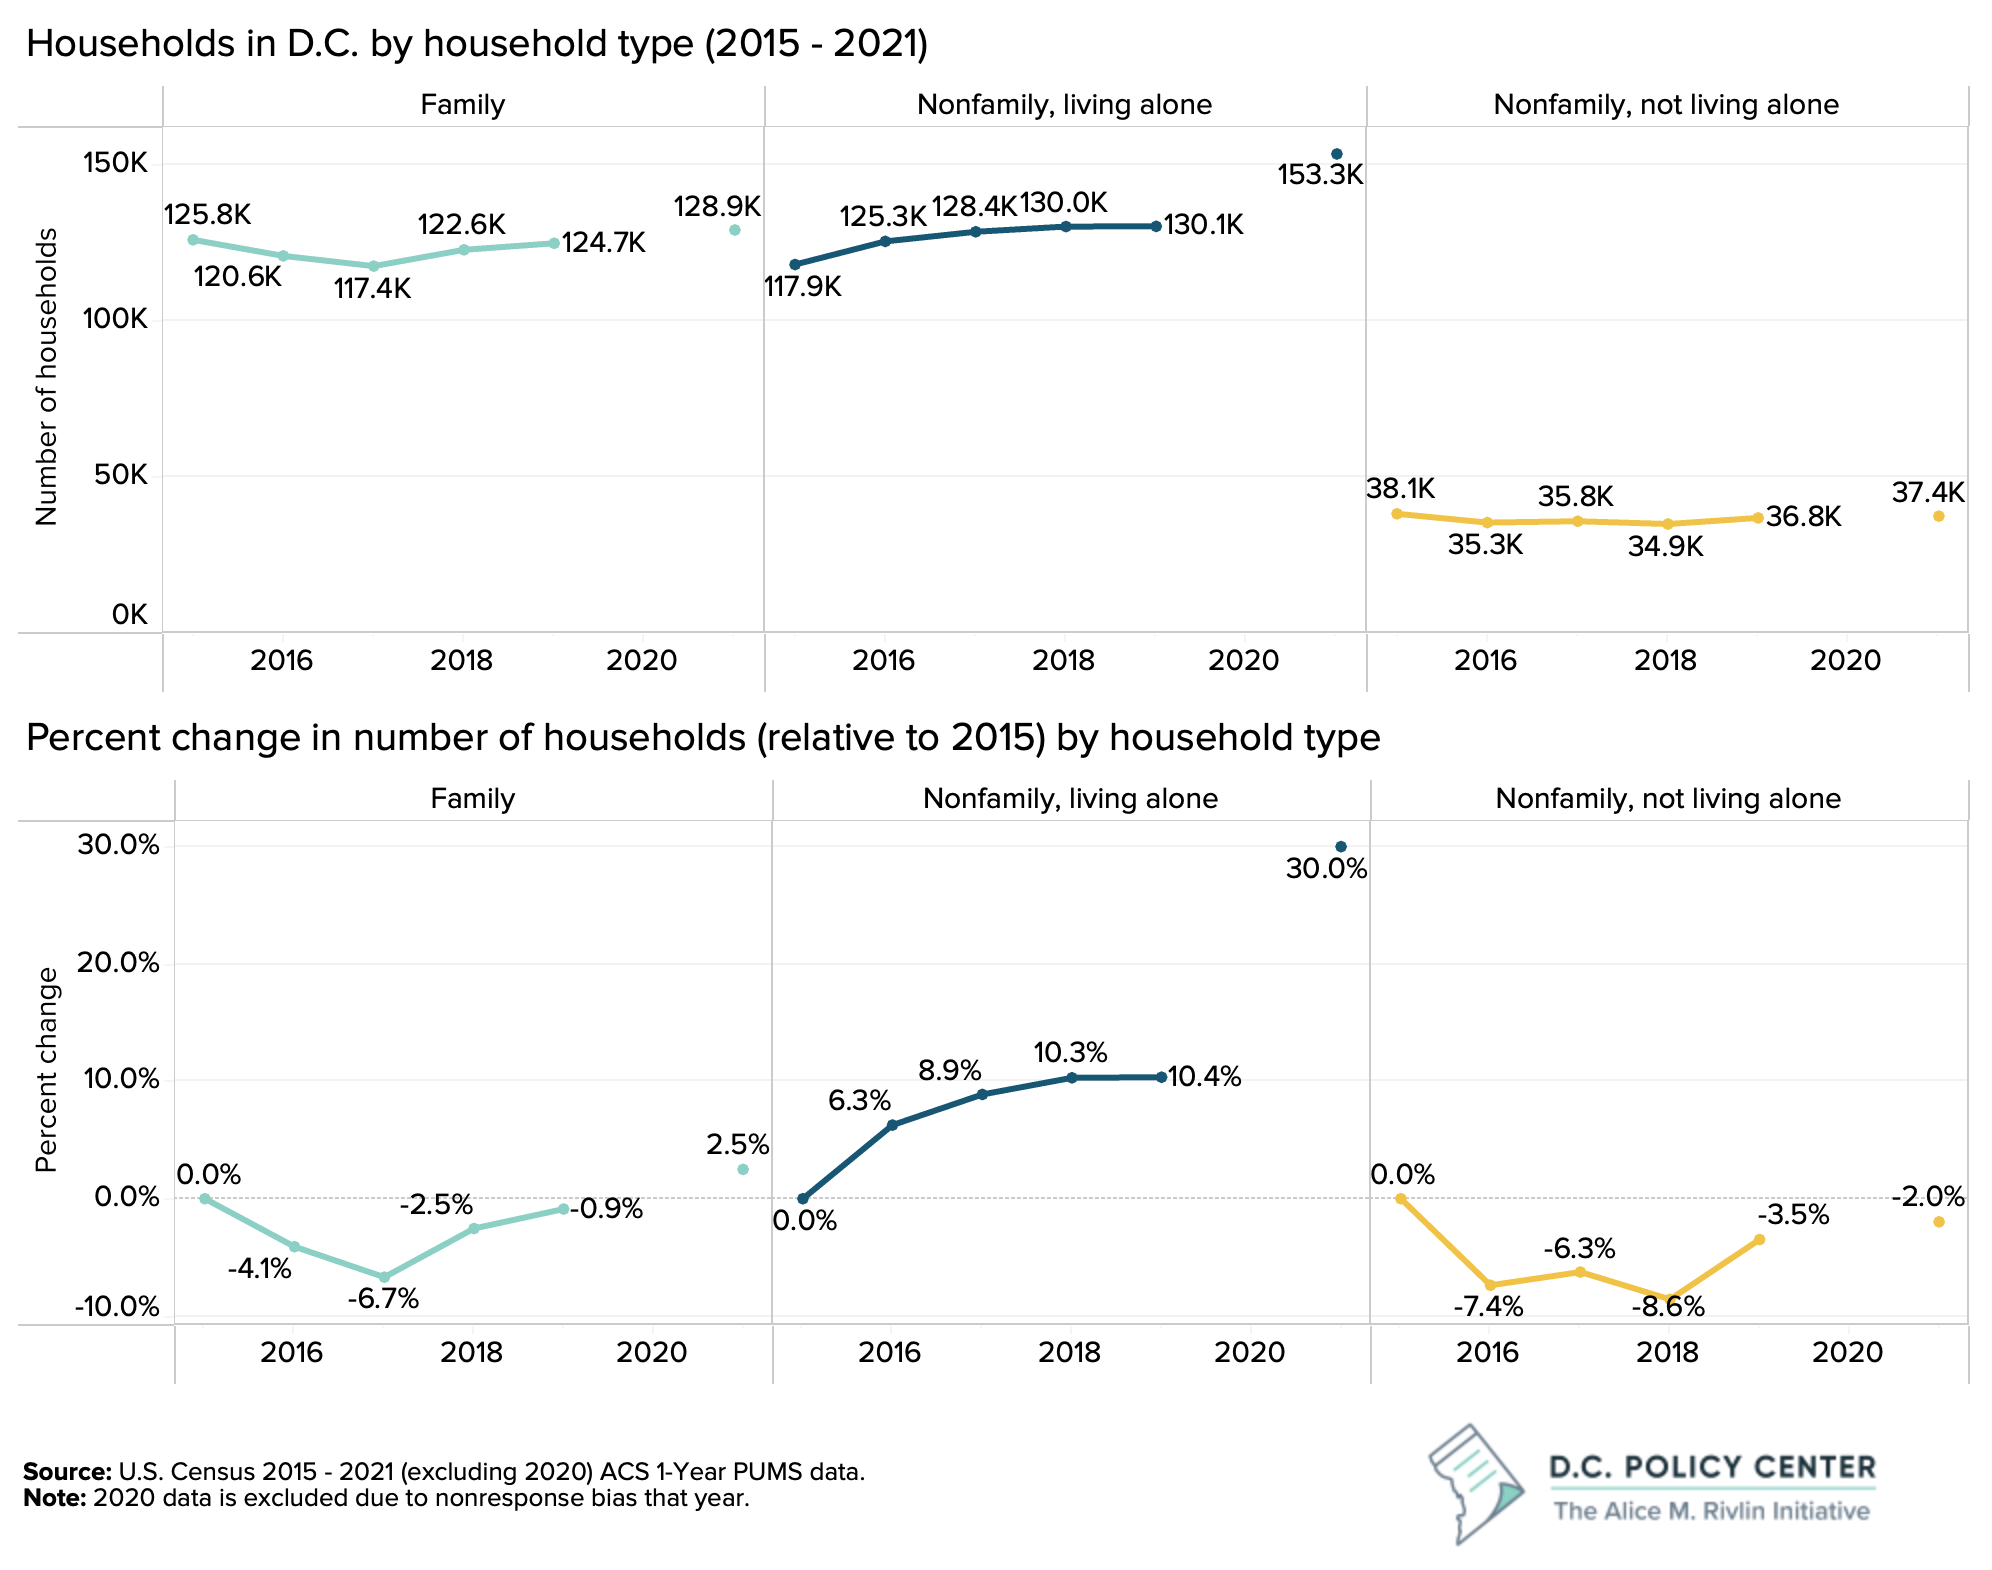
It is possible that the jump in the number of singles living alone between 2019 and 2021 could be related to the pandemic as many residents shifted from living with roommates to living alone due to health concerns, the need for more space, or other lifestyle preferences. However, we cannot tie the growth of single-person households to the pandemic only. This trend was already in place before the pandemic both in D.C., and according to the U.S. Census Bureau, across the entire nation.8
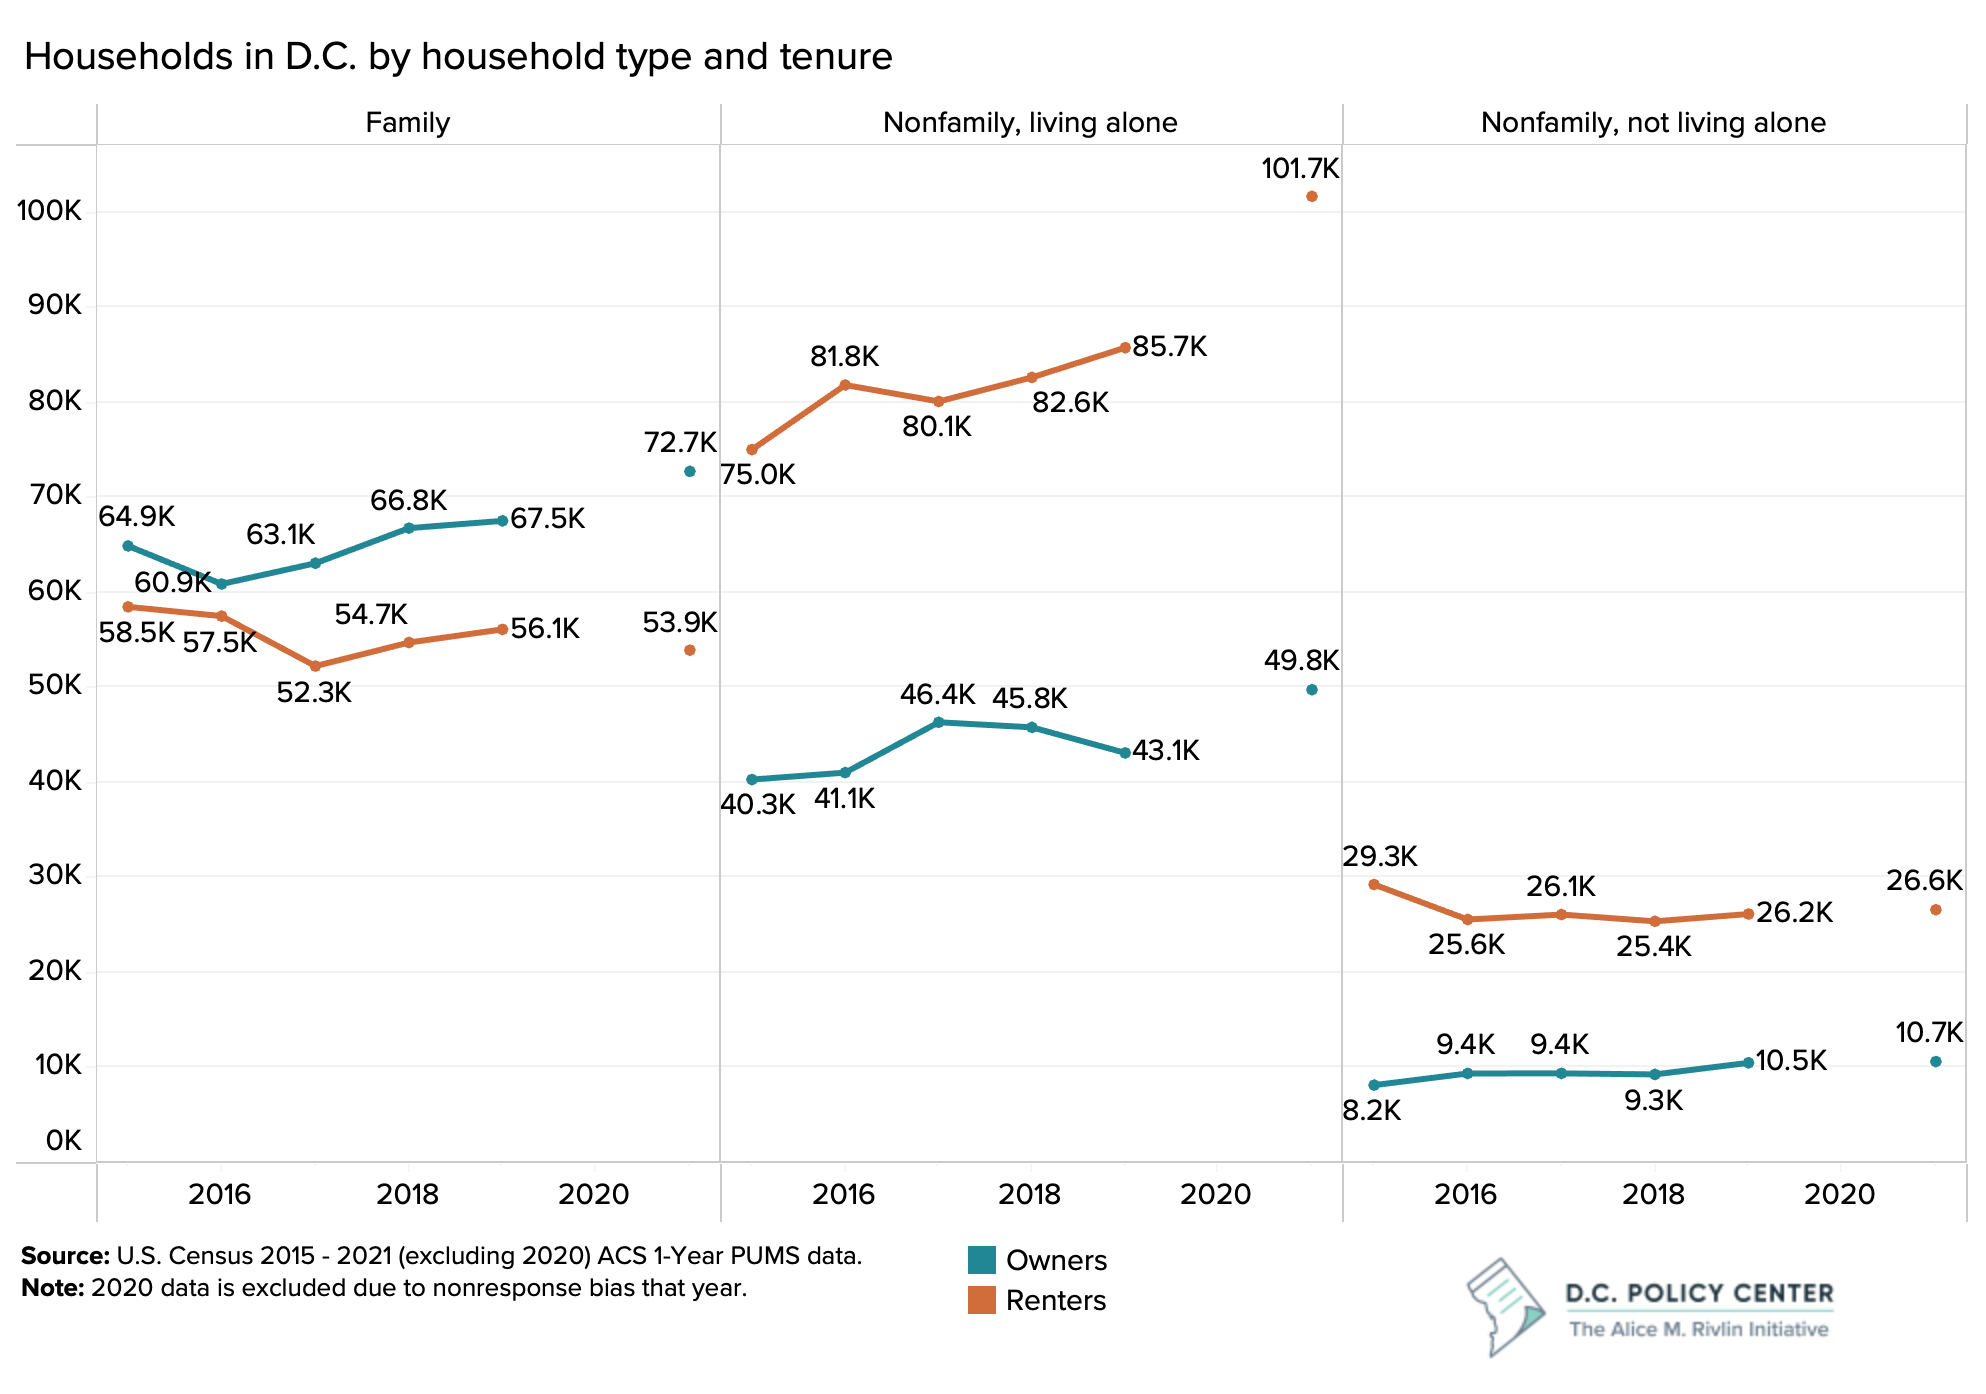
Growth has been strongest among single-person households who rent.
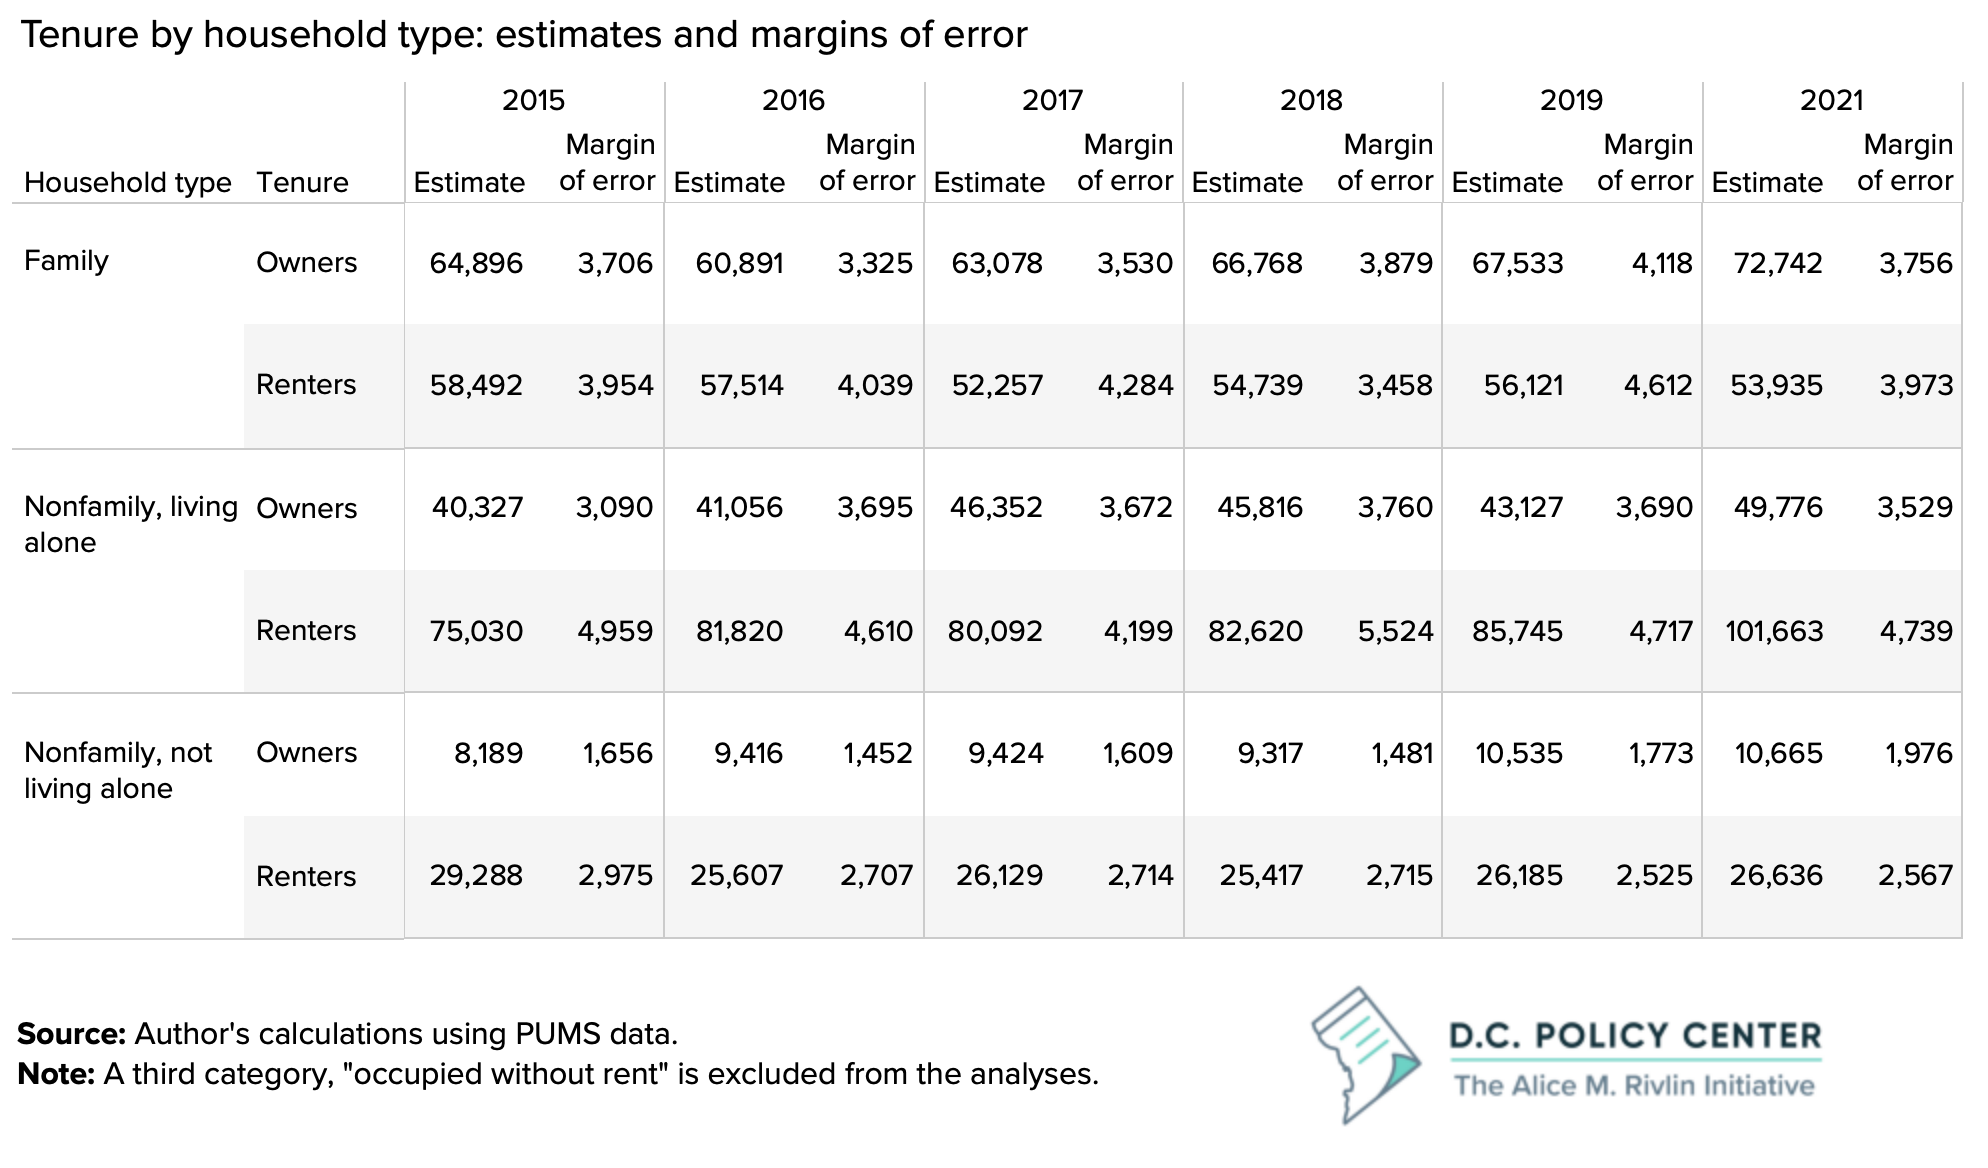
The District has a transient population so renting is common among its households. Since 2015, the share of households that rent has been relatively stable, fluctuating between 57 percent and 60 percent. The number of renter single-person households has grown particularly fast since 2015, but this reflects the overall growth in this group, and not necessarily an increased preference for renting. In 2021, approximately 67 percent of single-person households were renters, and this is the same as it was in 2015.
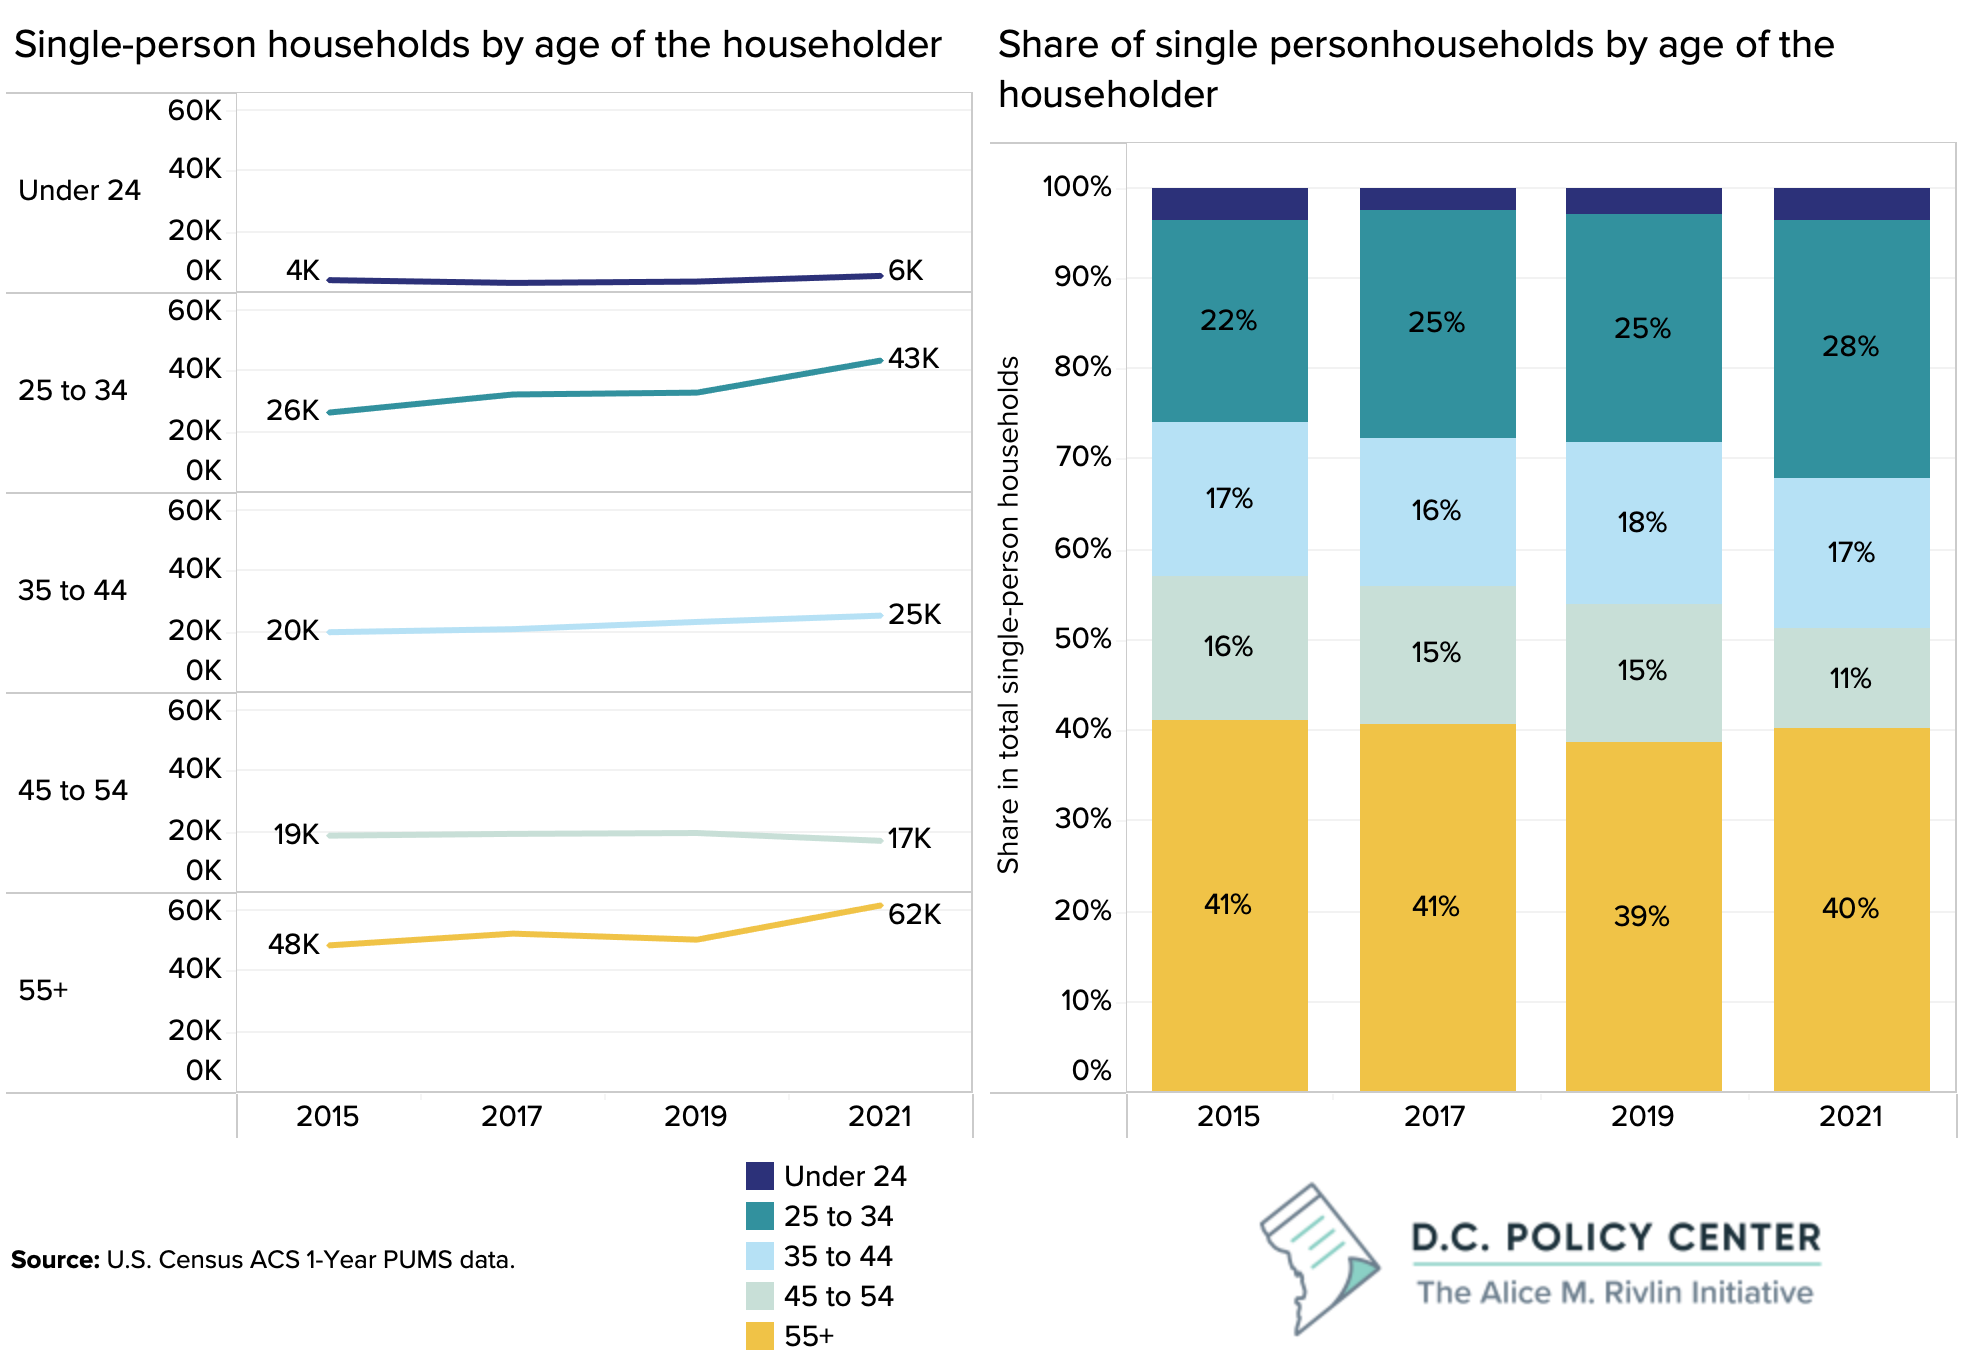
Single-person household growth is driven by the 25 to 34 and 55 and older age groups.
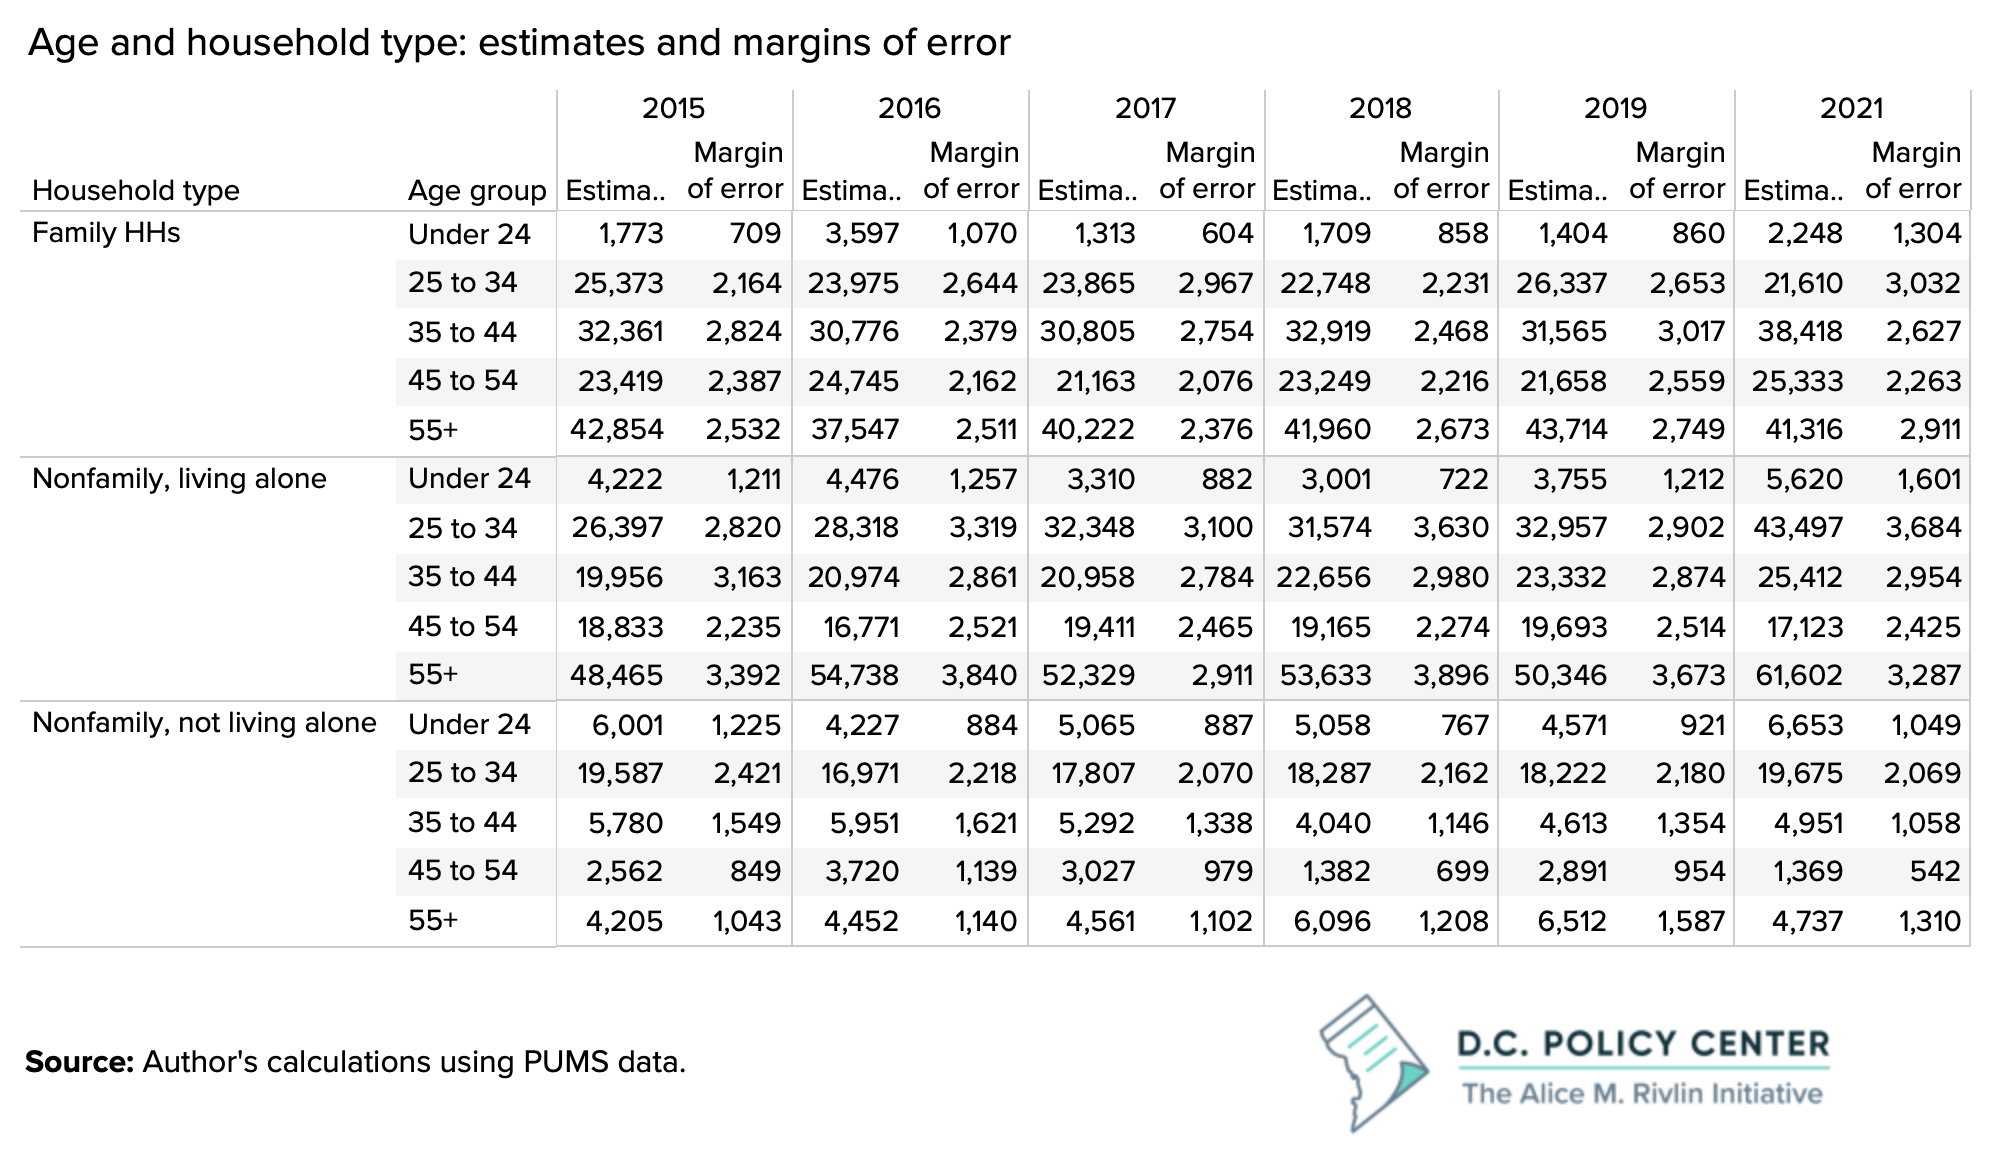
While the number of singles aged 55 or older living alone has increased, the share of such households has been stable at 40 percent of all single-person households. The main driver of growth in single-person households are those aged 25 to 34. This age group now constitute 28 percent of all single-person households in D.C., up from 22 percent in 2015. Between 2019 and 2021, this group accounted for 38 percent of all single-person household growth in D.C.
In 2020, the share of adults aged 25 to 34 who live with their parents peaked across the country, but this share began to decline in 2021. The growth of single-person households in this cohort may be a reflection of these adults finding enough economic security to leave home after a year of tremendous uncertainty. (And this is also the case for the entire country,9 and certainly worthy of additional research.10
The recent spike in one-person households is driven by moderate-earning single-person householders, likely with income growth potential.
Between 2015 and 2021, 54 percent of household growth in D.C. came from households earning over $100,000 annually (measured in 2021 dollars). This is consistent with our finding from the IRS migration data that tax filers who did not migrate out of D.C. had growing incomes. In addition, there was particularly high growth in one-person households with annual incomes between $50,000 and $99,999. Between 2019 and 2021, these households accounted for 44 percent of all household growth in D.C. These are the households with high income potentials, especially if they form families and stay in D.C.
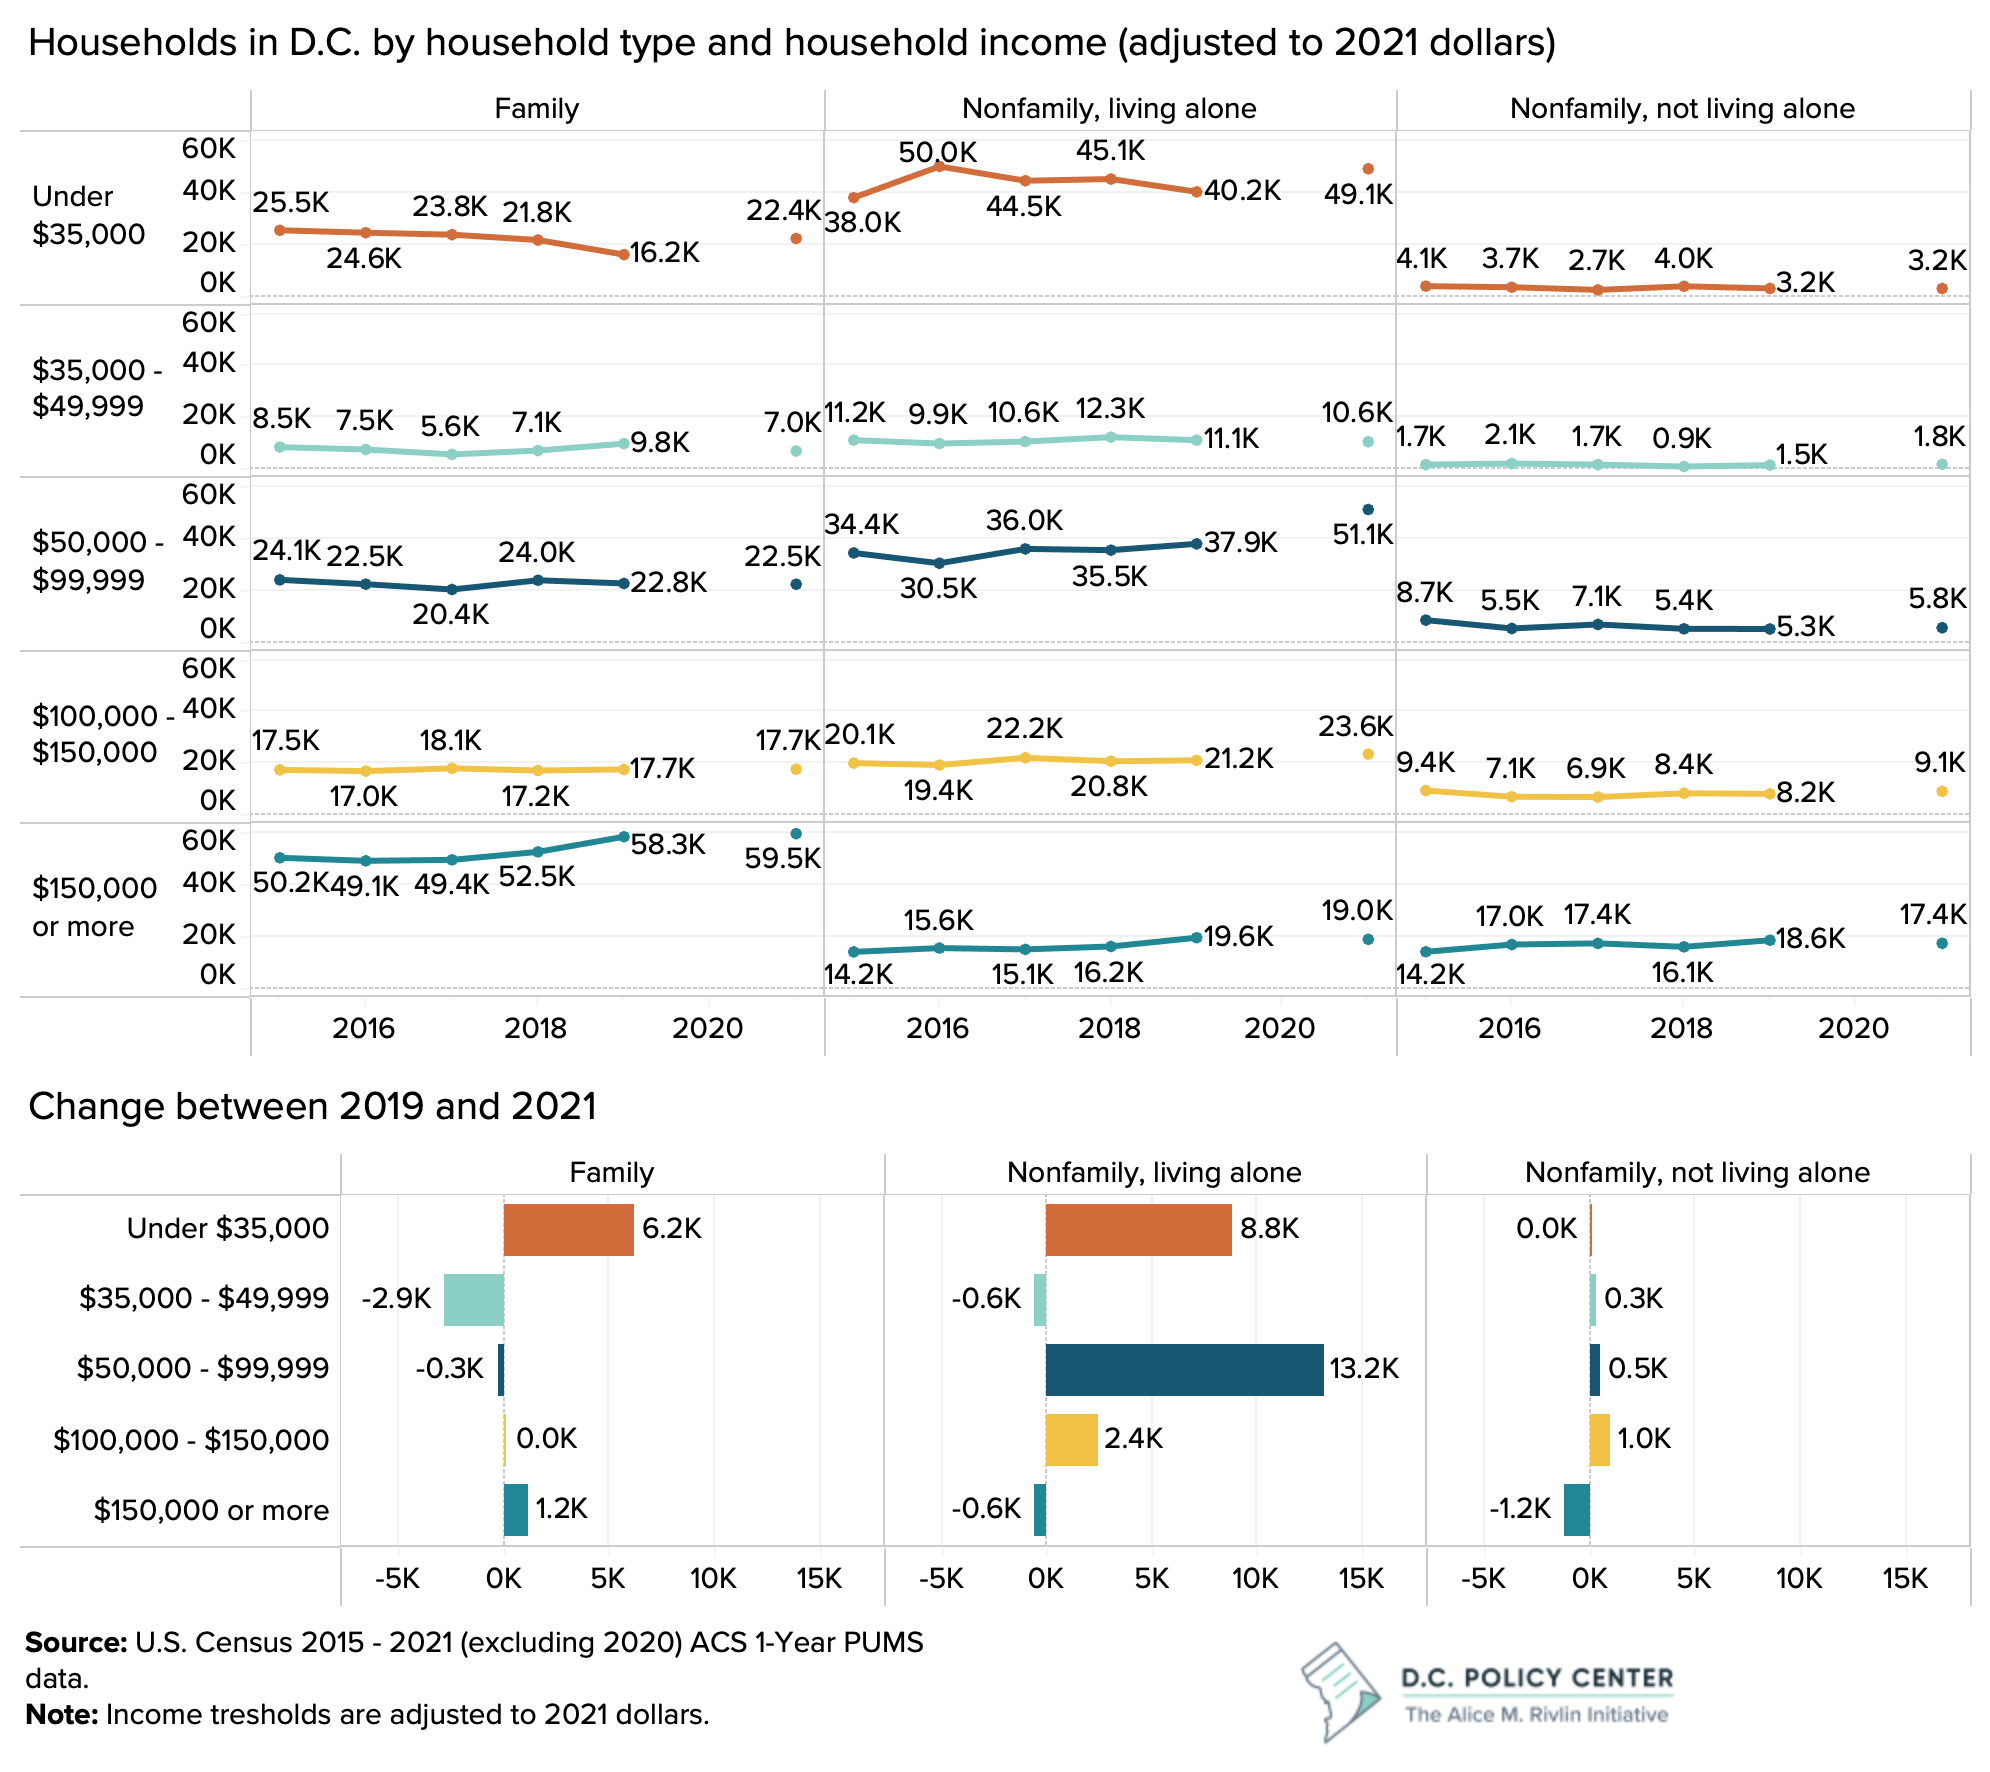
These shifts in household composition can also help explain the observed declines in median household incomes in the District. Real median household income in D.C. increased from $84,820 in 2015 to $106,100 in 2019 but declined to $99,440 in 2020 and $97,740 in 2021. While this may partly be due to an increase in the number of family households with incomes under $35,000, the significant growth in single households with middle incomes can certainly explain the observed reductions in median household incomes in D.C.
We have been here before.
In 2017, the D.C. Policy Center published an essay by David Rusk titled Thermometer of City Health: Count Households, Not Noses which observed that between 1950 and 2010 Washington DC had lost 25 percent of its population “…[b]y nose count but [that was] offset by a 19 percent increase to total households.” This growth in households ultimately resulted in a population boom and a baby boom beginning early 2010s, as singles who formed families increasingly chose to stay in the District.
The growth in middle- and high-income singles, which translated into higher-income families, had impacts in the city that are worth remembering for the future: First retaining these middle-income singles as they grow their incomes and form families can help strengthen the city’s income tax base and tax revenue. This has been particularly important in the District’s history. For example, between 2015 and 2021, the District’s individual income tax revenue, adjusted for inflation, grew by 20 percent,11 which is nearly twice the pace of growth in real GDP across the Washington metropolitan area. Second, the growth in families that followed the influx of singles ultimately led to a baby boom and a transformation of the socioeconomic and racial makeup of District’s public schools. Third, it exacerbated income inequality, economic segregation, and housing segregation as affluent singles and couples outbid low- and moderate-income families in the housing market. This last bit is especially important since retaining today’s younger singles as they age, form families, and increase their incomes will depend upon the ease with which these persons can find housing that they can afford. This makes it all the more important to create a policy environment that incentivizes housing development.
Data notes
The data source for this publication is U.S. Census 2015 – 2021 (excluding 2020) ACS 1-Year PUMS data. 2020 data is excluded due to nonresponse bias that year. The analyses does not cover 2022 for which the PUMS data has not been released yet. But census tabulations show that in this year, the District added 7,405 new households, which is less than half the growth rate the city experienced in households numbers between 2019 and 2021. Real median household income increased between 2021 and 2022 by 4 percent to $101,700.
Census definitions for the types of households analyzed in this report are:
- Family household: All people occupying a housing unit are related to the householder by birth, marriage, or adoption.
- Nonfamily household: A householder living alone or where the householder shares the home with people with whom they are not related.
For more information, see: https://www.census.gov/programs-surveys/cps/technical-documentation/subject-definitions.html#householdnonfamily
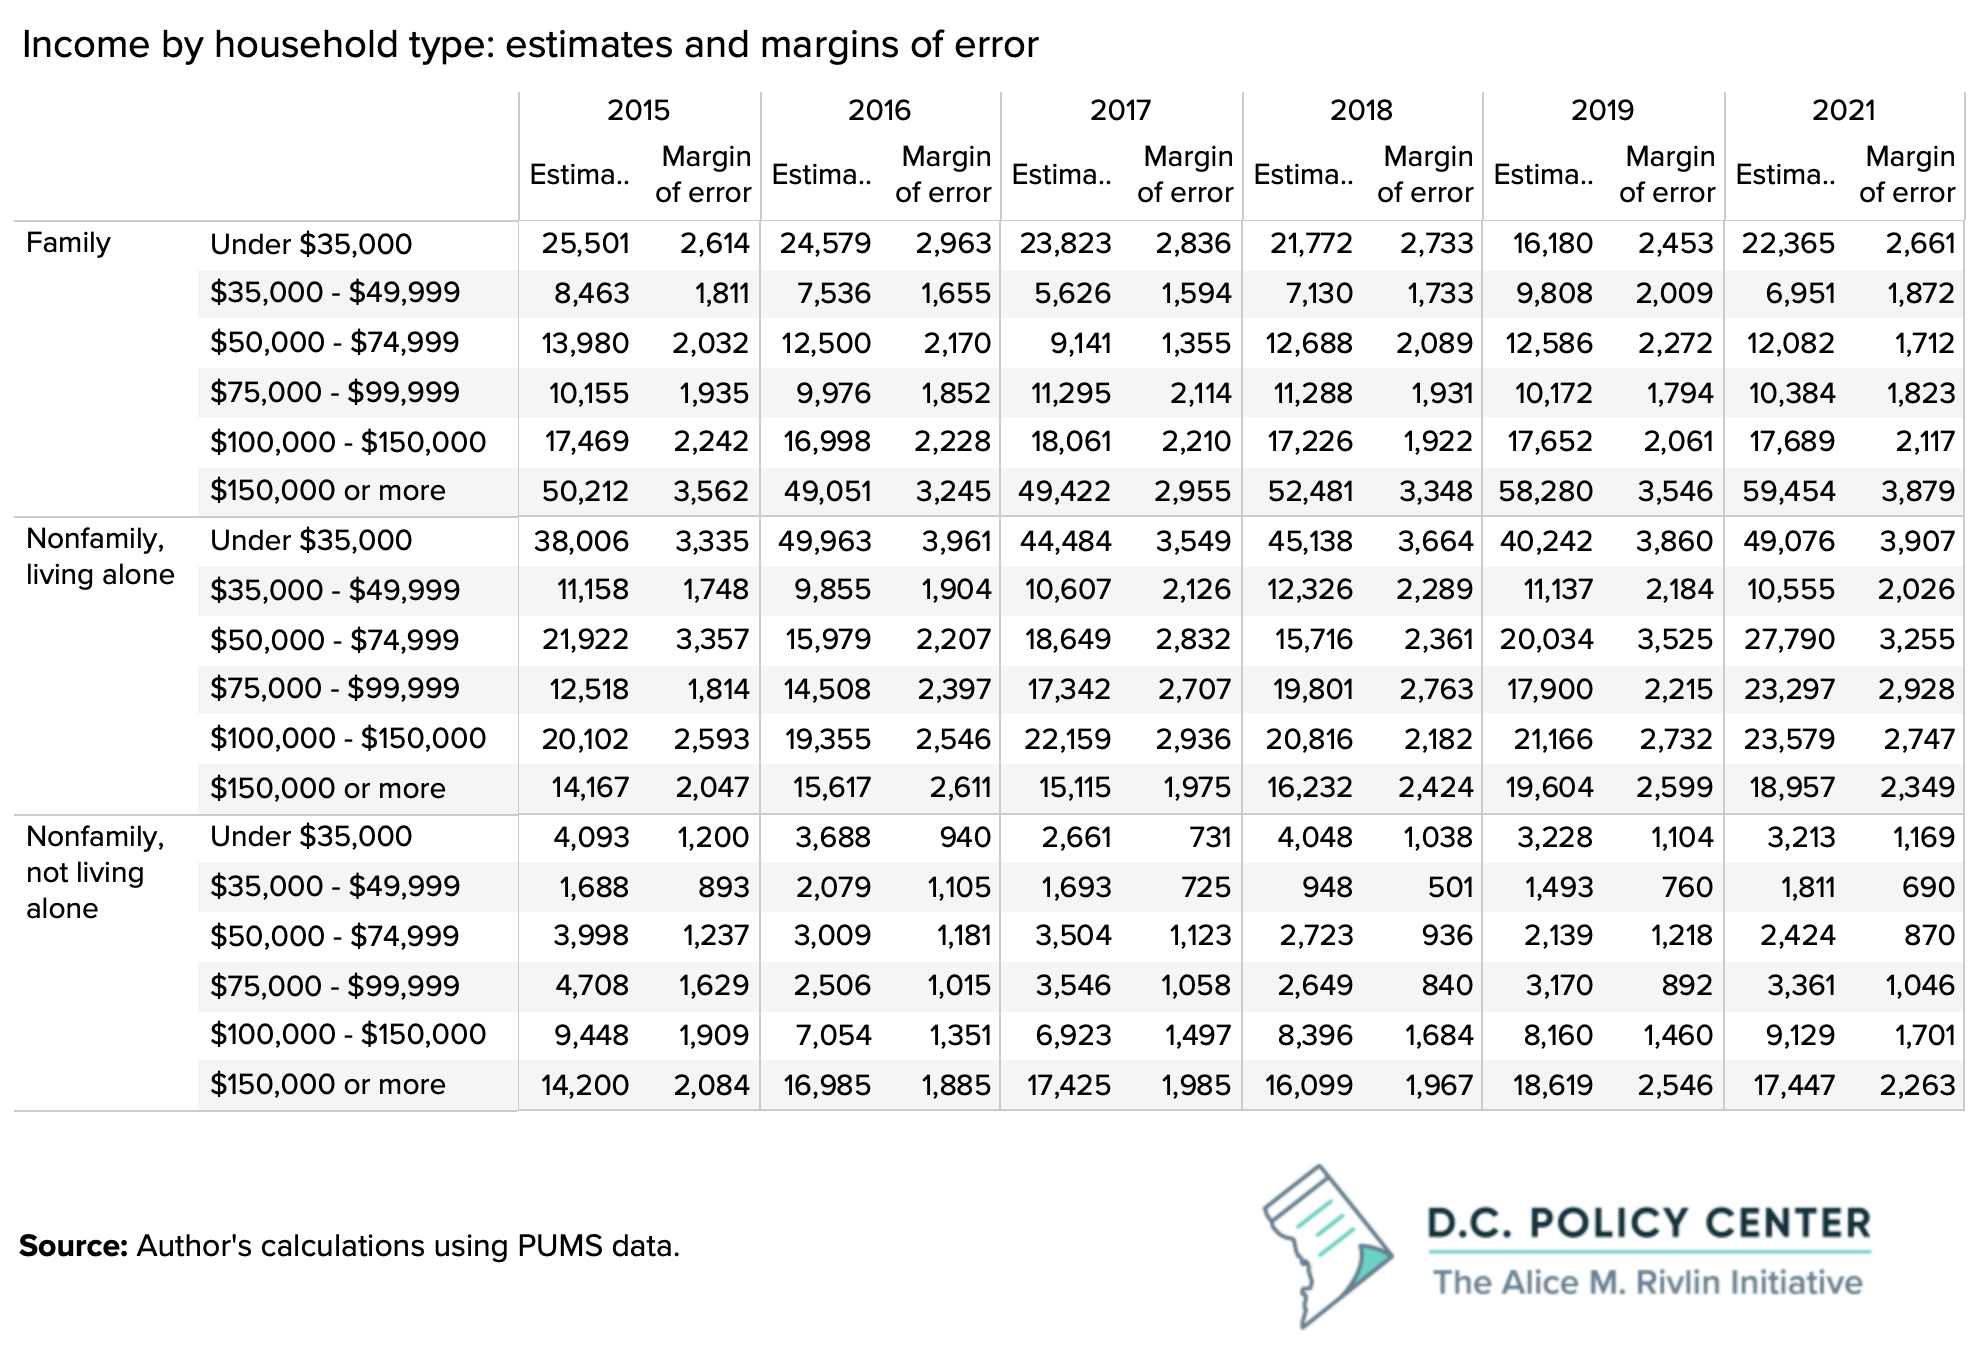
Margins of error
The numbers presented in this analysis are estimates calculated by using the Single Year Public Use Micro Data the U.S. Census has released for the American Community Survey. Because we are using survey data, the estimates are subject to errors. The next tables present the margins of error for all the estimated values used in this report. The errors are calculated at the 90 percent significance level, which is the standard used by the U.S. Census Bureau.
Endnotes
- Kathpalia, Sunaina (2020). “The District’s population grows for the 14th year in a row, but at a weaker rate.” D.C. Policy Center, Washington, D.C.
- Sayin, Yesim (2021). “What is happening to the District’s personal income tax base?” D.C. Policy Center, Washington, D.C.
- Sayin, Yesim (2023). “Charts of the week: What does the IRS migration data tell us about outmigration from D.C.?” D.C. Policy Center, Washington, D.C.
- Moored, Ginger and Kevin Lang (2023). IRS data shows pandemic-era exodus of mid-to-high earners aged 26-44 from DC, leading to taxable income loss. District Measured, Office of the Chief Financial Officer, Washington D.C.
- McConnell, Bailey (2022). “Demographic shifts in the District of Columbia following the COVID-19 pandemic” D.C. Policy Center, Washington, D.C.
- Rusk, David (2017). “Thermometer of City Health: Count Households, Not Noses.” D.C. Policy Center, Washington D.C.
- U.S. Census should be interpreted with caution. In recent years, there was a high undercount compared to a typical Census year. It is also possible that pre-2020, annual population estimates were overestimating population. McConnell, Bailey and Sayin, Yesim (2022). “Remote work and the future of D.C. (Part 2): What does remote work mean for the District of Columbia’s tax base?” D.C. Policy Center, Washington, D.C.
- Anderson, Lydia et. al. (2023) Share of One-Person Households More Than Tripled from 1940 to 2020. U.S. Census Bureau.
- McBride, Bill (2022). Lawler: Likely “Dramatic shift” in Household Formation has “Major implications” for 2023. Calculated Risk.
- McCue, Daniel (2023). The Surge in Household Growth and What It Suggests About the Future of Housing Demand. Housing Perspectives, Joint Center for Housing Studies of Harvard University.
- This is calculated by comparing the actual personal income tax revenue collected in 2021 and 2015 reported by the Office of the Chief Financial Officer, after adjusting for inflation.